R E S E A R C H Open Access
Neuroinflammatory processes are
augmented in mice overexpressing human heat-shock protein B1 following ethanol- induced brain injury
Brigitta Dukay1,2*†, Fruzsina R. Walter3, Judit P. Vigh3, Beáta Barabási3,4, Petra Hajdu1, Tamás Balassa1,5, Ede Migh1, András Kincses3, Zsófia Hoyk3, Titanilla Szögi6, Emőke Borbély6, Bálint Csoboz1,7, Péter Horváth1,8, Lívia Fülöp6, Botond Penke6, László Vígh1, Mária A. Deli3, Miklós Sántha1†and Melinda E. Tóth1*†
Abstract
Background:Heat-shock protein B1 (HSPB1) is among the most well-known and versatile member of the evolutionarily conserved family of small heat-shock proteins. It has been implicated to serve a neuroprotective role against various neurological disorders via its modulatory activity on inflammation, yet its exact role in neuroinflammation is poorly understood. In order to shed light on the exact mechanism of inflammation modulation by HSPB1, we investigated the effect of HSPB1 on neuroinflammatory processes in an in vivo and in vitro model of acute brain injury.
Methods:In this study, we used a transgenic mouse strain overexpressing the human HSPB1 protein. In the in vivo experiments, 7-day-old transgenic and wild-type mice were treated with ethanol. Apoptotic cells were detected using TUNEL assay. The mRNA and protein levels of cytokines and glial cell markers were examined using RT-PCR and immunohistochemistry in the brain. We also established primary neuronal, astrocyte, and microglial cultures which were subjected to cytokine and ethanol treatments. TNFαand hHSPB1 levels were measured from the supernates by ELISA, and intracellular hHSPB1 expression was analyzed using fluorescent immunohistochemistry.
Results:Following ethanol treatment, the brains of hHSPB1-overexpressing mice showed a significantly higher mRNA level of pro-inflammatory cytokines (Tnf,Il1b), microglia (Cd68,Arg1), and astrocyte (Gfap) markers compared to wild-type brains.
Microglial activation, and 1 week later, reactive astrogliosis was higher in certain brain areas of ethanol-treated transgenic mice compared to those of wild-types. Despite the remarkably high expression of pro-apoptoticTnf, hHSPB1-overexpressing mice did not exhibit higher level of apoptosis. Our data suggest that intracellular hHSPB1, showing the highest level in primary astrocytes, was responsible for the inflammation-regulating effects. Microglia cells were the main source of TNFαin our model. Microglia isolated from hHSPB1-overexpressing mice showed a significantly higher release of TNFαcompared to wild-type cells under inflammatory conditions.
(Continued on next page)
© The Author(s). 2021Open AccessThis article is licensed under a Creative Commons Attribution 4.0 International License, which permits use, sharing, adaptation, distribution and reproduction in any medium or format, as long as you give appropriate credit to the original author(s) and the source, provide a link to the Creative Commons licence, and indicate if changes were made. The images or other third party material in this article are included in the article's Creative Commons licence, unless indicated otherwise in a credit line to the material. If material is not included in the article's Creative Commons licence and your intended use is not permitted by statutory regulation or exceeds the permitted use, you will need to obtain permission directly from the copyright holder. To view a copy of this licence, visithttp://creativecommons.org/licenses/by/4.0/.
The Creative Commons Public Domain Dedication waiver (http://creativecommons.org/publicdomain/zero/1.0/) applies to the data made available in this article, unless otherwise stated in a credit line to the data.
* Correspondence:dukay.brigitta@brc.hu;toth.erzsebetmelinda@brc.hu Miklós Sántha and Melinda E. Tóth are shared last authors.
1Institute of Biochemistry, Biological Research Centre, Temesvári krt. 62, Szeged H-6726, Hungary
Full list of author information is available at the end of the article
(Continued from previous page)
Conclusions:Our work provides novel in vivo evidence that hHSPB1 overexpression has a regulating effect on acute neuroinflammation by intensifying the expression of pro-inflammatory cytokines and enhancing glial cell activation, but not increasing neuronal apoptosis. These results suggest that hHSPB1 may play a complex role in the modulation of the ethanol- induced neuroinflammatory response.
Keywords:hHSPB1, Heat-shock protein, Astroglia, Cytokines, Ethanol toxicity, Microglia, Neuron, Neuroinflammation, Transgenic mice, Primary cells
Background
Neuroinflammation plays a central role in the pathophysi- ology of most neurological diseases. The activation of astro- and microglia cells, and their subsequent produc- tion of cytokines and chemokines are the main character- istics of neuroinflammation. Inflammation in the brain is primarily associated with the process of neurodegenera- tion, as it is initiated in order to aid the repair of the dam- aged brain area. However, in the case if it becomes dysregulated, a chronic inflammation could appear which further aggravates tissue damage. Therefore, the tight regulation of the neuroinflammatory response during neuronal tissue damage is crucial in preventing or at least in reducing the negative effects of chronic inflammation [1]. Heat-shock proteins (HSPs) could be one of the po- tential candidates for such an inflammation-regulating role, as they show a rapid induction under stress condi- tions, they promote cell survival under these conditions, and their modulatory effects on inflammatory processes are well described [2].
Heat-shock protein B1 (HSPB1, HSP27/25) is one of the most well-studied members of the evolutionarily conserved small heat-shock protein family. These ATP- independent chaperon proteins are characterized by low molecular weight between 16 and 40 kDa, and a con- served C-terminal α-crystallin domain. As molecular chaperones, small heat-shock proteins have an important role in maintaining the normal cellular protein homeo- stasis by binding to partially denatured proteins, thereby preventing their irreversible aggregation [3]. In the brain, HSPB1 is the most abundant in astrocytes under physio- logical conditions and it is even more elevated in re- sponse to various stress conditions, such as increased temperature or oxidative stress [4, 5]. Increased astro- glial expression of HSPB1 was also detected after transi- ent focal ischemia and in neurodegenerative disorders associated with pathological protein inclusions, such as tauopathies or Alzheimer’s disease [4, 6–8]. This line of observations suggests that HSPB1 might also play a role in reactive astrogliosis. Compared to astrocytes, HSPB1 is present in neurons to a lesser extent, although it was also described to be upregulated in pathological and under stress conditions [4,9,10]. In microglia, HSPB1 is
present only in negligible amounts but following hyper- thermia, it showed an elevated expression [11].
Besides its well-described role as a chaperon, HSPB1 is also associated with neuroinflammation through several mechanisms. HSPB1 can help to maintain the integrity of cytoskeletal networks through its association with various cytoskeletal filaments, such as the glial fibrillary acidic protein (GFAP), vimentin (Vim), or neurofilament [12, 13]. HSPB1 can also interact with several compo- nents of the apoptotic pathways and exert a strong anti- apoptotic function [14]. Moreover, it can modulate the release of cytokines from various cells; however, a multi- tude of effects can be observed in different studies in that regard. There has been an observation that de- scribed an HSPB1-dependent interleukin-10 (IL-10) in- crease and an associated anti-inflammatory response [15]. However, another study pointed towards a more pro-inflammatory role for HSPB1 as it was observed to induce the production of IL-8 and reduce the expression of anti-inflammatory transforming growth factor-β1 (TGF-β1) and the cluster of differentiation 40 (CD40) ligand in astrocytes in vitro [16]. In addition, HSPB1 is described to regulate the activation of the nuclear factor kappa B (NFκB) pathway. Recently, intracellular HSPB1 has been demonstrated to promote the degradation of IkappaB kinase-β resulting in an inactive state of NFκB and a subsequent decrease in tumor necrosis factor-α (TNFα) production in microglial cells [17]. However, in a macrophage culture, extracellular HSPB1 treatment was observed to activate the NFκB pathway via the deg- radation of the inhibitor of nuclear factor-kappa B-α (IκBα), thereby upregulating both pro- and anti- inflammatory factors, such as IL1b,TNF, IL-10, and the granulocyte-macrophage colony-stimulating factor [18].
Moreover, HSPB1 expressed in endothelial cells of the brain microvasculature contributes to an indirect protec- tion against neuroinflammation. HSPB1 was described to ameliorate the impairment of the blood-brain barrier, and by this decreasing the influx of peripheral immune cells into the brain parenchyma after ischemic injury [19]. Overall, a growing number of evidence indicates that HSPB1 can affect the inflammation-related pro- cesses in several ways, but it seems to induce diverse ef- fects depending on the cell type and the extra- or
intracellular presence of the protein. Despite the diver- sity of the observed actions for HSPB1 in the central nervous system, the inflammation modulatory effects of this protein would require further clarification. In addition, there is a lack of comprehensive in vivo studies investigating the impact of HSPB1 on multiple compo- nents of inflammation within the CNS.
In this study, we aimed to test the hypothesis whether HSPB1 is involved in the regulation of cytokine expres- sion, gliosis, and apoptosis in ethanol-induced acute neu- roinflammation. We analyzed the inflammation-related processes using our previously generated human HSPB1 (hHSPB1)-overexpressing transgenic mouse strain [20], as well as using primary cell cultures isolated from the trans- genic mouse model. Ethanol treatment is a suitable method for modeling the sterile inflammatory environ- ment that serves as a central disease-promoting mechan- ism in many neurological disorders. In our in vivo experiments, we used early postnatal acute ethanol expos- ure because, due to the particularly high sensitivity of the developing brain to alcohol toxicity, even a single ethanol treatment leads to robust neurodegeneration, which is ac- companied by neuroinflammatory processes, including cytokine release and glial cell activation [21,22]. Accord- ingly, with this method, we were able to induce neuroin- flammation rapidly in the brains of 7-day-old hHSPB1- overexpressing transgenic and wild-type mice and to in- vestigate the possible immunomodulatory effects of hHSPB1 overexpression in this sterile inflammatory mi- lieu. hHSPB1-overexpressing mice showed enhanced ex- pression of pro-inflammatory cytokines Tnf and Il1b as well as increased immunoreactivity of astrocyte and microglial activation markers in response to ethanol- induced acute brain injury, whereas they exhibited a non- significant trend of decreased apoptosis. In addition, in vitro results showed that the release of hHSPB1 from the cells is minimal even after stress treatment. Therefore, we suggest that the intracellular form of hHSPB1 is re- sponsible for the observed inflammation-regulating ef- fects, showing a significantly increased expression in primary astrocytes after cytokine and ethanol treatment.
Moreover, microglia seemed to be the main source of pro-inflammatory cytokines in vitro, since the highest TNFα response to cytokine treatment was detected in the supernates from microglia cultures from hHSPB1 transgenic animals. Taken together, we found that the ethanol-induced neuroinflammatory processes were aggravated in our HSPB1-overexpressing mice includ- ing the pro-inflammatory cytokine expression and glial cell activation, while we could not detect the fur- ther increase of the inflammation-related neuronal damage in these animals, suggesting that HSPB1 has a complex role in the regulation of ethanol-induced acute inflammation.
Methods
In vivo experiments Animals
The study has been carried out according to the EU Dir- ective 2010/63/EU and was approved by the regional National Food Chain Safety Agency and Animal Health Directorate (Csongrad-county, Hungary) under the pro- ject license XVI/4136/2014. Mice were housed in groups of two to three under standard conditions (24 °C, 12 h of light-dark cycle) with food and water available ad libi- tum. Seven-day-old hHSPB1 transgenic mice and wild- type littermates were used for the studies. The hHSPB1- overexpressing transgenic line was previously established by our group on a homogenous C57BL/6 genetic back- ground [20].
Ethanol treatment
Neurodegeneration was induced in 7-day-old wild-type and hHSPB1-overexpressing transgenic mice by the sub- cutaneous injection of 20% ethanol solution as described earlier in Ikonomidou et al. [21]. Ethanol was adminis- tered in two equal doses of 2.5 g/kg body weight within 2 h (at zero and at the 2nd hour), resulting in a total dose of 5 g/kg. Control pups were treated with physiological sa- line. After cervical dislocation and decapitation, brains were removed at 7 h/24 h/1 week after the second injec- tion and processed as follows: the dissected brains were embedded in optimal cutting temperature (OCT) com- pound (Tissue-Tek, Sakura Finetek, CA, USA) for cryostat sectioning and to carry out the terminal deoxynucleotidyl transferase dUTP nick end labeling (TUNEL) assay; for immunohistochemistry, brains were immersion-fixed in 3% paraformaldehyde (PFA)-0.1 M phosphate buffer solu- tion; the brains were further homogenized in AccuZol Re- agent for RNA isolation or in radioimmunoprecipitation assay (RIPA) buffer for protein isolation. At the same time, small tail biopsies were taken for subsequent genomic DNA isolation and genotype determination.
hHSPB1 Western blot analysis
Protein level of transgenic human HSPB1 was deter- mined from whole-brain homogenates of 7-day-old mice (n= 3 mice per group). Brains were homogenized in 1 ml RIPA buffer containing 2 mM phenylmethylsulfonyl fluoride and 2 mM N-ethylmaleimide. After centrifuga- tion (13,000gfor 25 min at 4 °C), protein concentrations were measured in the supernates at 280 nm using a NanoDropND-1000 spectrophotometer (Nanodrop, DE, USA). Five milligram per milliliter samples were mixed with sample buffer containing sodium dodecyl sulfate (SDS), glycerol, β-mercaptoethanol, and bromophenol blue, and incubated at 95 °C for 5 min. Protein samples (50μg) were loaded into a 15% SDS-polyacrylamide gel and samples were run at 80 V for 2 h in 1× SDS-PAGE
running buffer. Then, proteins were transferred to poly- vinylidene difluoride membranes (Pall Corporation, NY, USA), were submerged in 1× transfer buffer, and run at 200 mA for 1 h on ice. Subsequently, membranes were incubated in phosphate-buffered saline with Tween 20 (PBST) containing 5% nonfat milk powder for 1 h at room temperature. The following primary antibodies were used in the study: rabbit anti-hHSPB1 (O/N at 4 °C, Stressgen - Enzo Life Sciences, NY, USA, no cross- reactivity with mouse HSPB1) and rabbit anti-actin (2 h at room temperature, Sigma-Aldrich Ltd, Budapest, Hungary). The secondary antibody used was horseradish peroxidase–conjugated goat anti-rabbit (Jackson Immu- noResearch Europe Ltd., Cambridgeshire, UK) (see Table S1 for details of antibodies). Afterwards, membranes were incubated with a chemiluminescent detection re- agent (Luminata Forte Western HRP Substrate, Merck Millipore, MA, USA) for 2 min and blots were developed manually on X-ray films. Quantification of the results was performed using the open-access ImageJ software.
mRNA isolation and reverse transcription
mRNA was isolated from whole brains of the mice. Ho- mogenized tissue was mixed with AccuZol Reagent (Bio- neer, South Korea), by adding 1 ml to each tissue sample. Subsequently, 200μl chloroform was added to the samples followed by incubation on ice for 5 min.
Phases were separated by centrifugation at 13,000g for 15 min at 4 °C, and the aqueous phase was separated from the organic phase from where the RNA was precip- itated with 100% isopropyl alcohol during incubation for 10 min at−20 °C. After centrifugation for 10 min at 13, 000g at 4 °C, the RNA pellets were washed with 80%
ethanol and the samples were centrifuged for 5 min at 13,000g at 4 °C. The RNA pellets were dissolved in RNase-free water and cleaned by using Nucleo Spin mRNA Clean-Up columns (Macherey-Nagel, Düren, Germany). Samples were treated with DNase and were eluted from the membrane with RNase-free water. Con- centrations of the samples were measured at 230 nm using a spectrophotometer (NanoDrop ND-1000, Nano- drop, DE, USA). mRNA samples were converted to cDNA using reverse transcription (High Capacity cDNA Reverse Transcription Kit, Applied Biosystems, CA, USA) according to the manufacturer’s instructions.
Real-time PCR analysis
Real-time (RT)-PCR was performed to analyze the level of hHSPB1, cytokines, and glial markers. Gene-specific primers are listed in Table S2. Each reaction was per- formed in a total volume of 20μl containing 10μl of Power SYBR Green PCR Master Mix (Applied Biosys- tems, CA, USA), 1μl of 5 pmol/μl primer mix (forward + reverse), and 9μl of cDNA sample. The amplification
was carried out on a RotorGene 3000 instrument (Cor- bett Research, Australia) with the following cycling pa- rameters: heat activation at 95 °C for 10 min; followed by 45 cycles of denaturation at 95 °C for 15 s, annealing at 56 °C for 15 s, and extension at 60 °C for 40 s. Fluores- cent signals were collected after each extension step at 72 °C and at the end, the registration of the melting curve was performed between 50 and 95 °C. Expression level of the target genes was normalized to an endogen- ous control (glyceraldehyde 3-phosphate dehydrogenase, Gapdh). Relative expression of the target genes com- pared to the untreated wild-type animals was calculated using the ΔΔCt method (n= 8 mice per group at 24 h;
n= 3 mice per group at 7 h and 1 week).
TUNEL assay
To assess the level of apoptotic cell death, TUNEL assay was used, which labels the fragmented DNA. Brains were embedded in OCT compound, then 10-μm sagittal frozen sections were prepared. Sections were post-fixed in 4% paraformaldehyde in phosphate-buffered saline (PBS) solution (pH = 7.4) for 20 min. Following a 30-min PBS rinse, sections were blocked in 3% H2O2in metha- nol for 10 min, then they were permeabilized with a so- lution of 0.1% Triton X-100 and incubated in 0.1%
sodium citrate for 2 min. After washing with PBS, 50μl of TUNEL reaction mixture was added to each sample (In situ Cell Death Detection Kit, POD, Roche Applied Science, IN, USA) and the sections were incubated for 1 h at 37 °C in a humidified atmosphere. Under the same circumstances, the sections were incubated with Converter-POD solution for 30 min, then washed in PBS, followed by a 10-min signal conversion with a per- oxidase reagent. The red apoptotic cells were detected under a light microscope. For quantitative comparison, the TUNEL-positive cells were counted in fifteen fields of view of each brain section (n= 6 mice per group).
Fluorescent immunohistochemistry
Double immunostaining was performed to study the expression pattern of hHSPB1. After washing in PBS, 30- μm-thick frozen sagittal brain sections were permeabilized and blocked with 0.2% Triton X-100 and 3% bovine serum albumin (BSA) in PBS for 1 h at room temperature. Then the sections were incubated overnight at 4 °C with the fol- lowing primary antibodies: goat anti-IBA1 (ionized cal- cium–binding adaptor molecule 1, Abcam, Cambridge, UK), mouse anti-GFAP (Sigma-Aldrich Ltd, Budapest, Hungary), mouse anti-NEUN (neuronal nuclei, Merck Millipore, MA, USA), and rabbit anti-hHSPB1. Appropri- ate secondary antibodies were applied for 2 h: Alexa Fluor-488–conjugated rabbit anti-goat (Jackson Immu- noResearch Europe Ltd., Cambridgeshire, UK); FITC- conjugated goat anti-mouse (Sigma-Aldrich Ltd, Budapest,
Hungary); Alexa Fluor-647–conjugated goat anti-rabbit (Thermo Fisher Scientific, MA, USA) (TableS1). Cell nu- clei were counterstained with 4′,6-diamidino-2-phenylin- dole (DAPI) (Sigma-Aldrich Ltd, Budapest, Hungary), at the concentration of 0.5μg/ml for 5 min. Immunostain- ings were examined with a confocal laser scanning micro- scope (Olympus Fluoview FV1000, Olympus Life Science Europa GmbH, Hamburg, Germany).
Peroxidase immunohistochemistry
To analyze the activation of glial cells, brain sections were labeled with microglia and astrocyte markers. The brain region–specific expression pattern of the transgenic hHSPB1 protein was also examined with this method.
First, the brain sections were treated with 20% methanol and 3% H2O2for 15 min to deactivate endogenous peroxi- dases. The sections were washed in PBS then blocked for 2 h at room temperature using 2% normal rabbit or horse serum and 0.3% BSA in PBS. Then the sections were incu- bated with rabbit anti-hHSPB1, mouse anti-GFAP, or goat anti-IBA1 primary antibodies overnight at 4 °C. Subse- quently, sections were incubated with the appropriate sec- ondary antibodies: peroxidase-labeled goat anti-rabbit, peroxidase-conjugated rabbit anti-mouse (Chemicon- Merck Millipore, MA, USA), or biotinylated donkey anti- goat (Jackson ImmunoResearch Europe Ltd., Cambridge- shire, UK) for 2 h (Table S1). The sections were then incubated with the chromogen substrate, 3,3′-diamino- benzidine (DAB) (Sigma-Aldrich Ltd, Budapest, Hungary) at the concentration of 10 mg/ml for 15 min, and the solu- tion was supplemented with 1% nickel chloride. For IBA1 staining, an avidin-biotin (VECTASTAIN Elite ABC Per- oxidase Kit, Vector Laboratories, CA, USA) treatment was applied for 2 h at room temperature as a signal amplifica- tion step before visualizing the immunoreaction with DAB. The immunostained sections were digitally scanned using a slide scanner (Mirax Midi, 3DHistech Ltd., Budapest, Hungary) (n= 3 mice per group and 3 sections per animal). Images were analyzed with the Pannoramic Viewer 1.15.4; CaseViewer 2.1 and QuantCenter; and His- toQuant module softwares (3DHistech Ltd., Budapest, Hungary). Each region of interest was manually outlined, then followed by automated detection of relative areas of immunopositivity. Results are given in percentage of the immunopositive areas compared to the outlined areas (relative area).
Automated analysis of microglial morphology with deep learning approach
Morphological categorization The activity state of microglia can be well characterized by their morphology, based on which microglia were classified into three sub- types: ramified (first class), intermediate (second class),
and amoeboid (third class) [23, 24]. The ramified morphology of resting microglia is characterized by a small cell body and branching, long, thin processes extending far from the cell body (Fig. S1a). Cells clas- sified into intermediate and amoeboid groups can be considered activated. The former is characterized by having an enlarged cell body and numerous thick, shortened processes which are still branching, while the latter is characterized by a large cell body which is completely round or has a few very short and thick primary processes (Fig. S1b).
Annotation procedure Manual annotations were per- formed using the AnnotatorJ software [25]. In total, 5883 cells on 232 images were annotated independently by two experts. Each annotated object in the set contains an associated class label and a bounding rectangle that was drawn around it. The total number of classes is 3.
The number of the annotated cells in the first class was 2961 and 1461-1461 in the second and third. Rectangle size can vary and they can intersect each other.
For performance evaluation, 30 images with a total of
~ 800 cells were selected. This validation set was anno- tated by both of the experts. Performing this annotation at two different time points, we measured the intraex- pert accuracies.
Evaluation with deep learning Training the model:
pytorch [26], a Python-based deep learning package was used to detect microglia (we used Python 3.6). We trained multiple models based on two different architec- tures, namely the yolov3-SPP [27] and CSPResNext50- PANet-SPP[28]. To make the training robust, the train- ing data was augmented using random affine transfor- mations. We were using ADAM (Adaptive Moment Estimation [29]) optimizer with a base learning rate of 0.001. Because for such data there are no pretrained weights available, we used random initialization. The number of epochs for each setup was 2000. This resulted in 0.594 as the best mAP (mean average precision) for yolov3-SPP and 0.593 as the best mAP for CSPRes- Next50-PANet-SPP. The training was performed on a GPU cluster with a 2.10 GHz Intel(R) Xeon(R) ES-2620 CPU, 32 GB memory, and NVIDIA Titan Xp graphics card and for both cases took roughly 72 h.
Microglia detection with classification We selected the yolov3-SPP model for the evaluation part because it resulted both statistically and visually in better results.
To evaluate the performance of the proposed deep learning model, we measured precision, recall, and F1 score of two different annotators. The object matching between the detection and classification results and the ground truth was done manually by an expert. We
considered a bounding box detection to be correct (true positive, TP) when it fully contained a cell; otherwise, it was considered as false positive (FP). When the detec- tion algorithm was not able to find an object that was listed in the ground truth, that sample was treated as false negative (FN). Based on these conditions, we calcu- lated the precision (P) = TP / (TP + FP); recall (R) = TP / (TP + FN); F1 score (F1) = 2 * P * R / (P + R); and detec- tion accuracy (DA) = TP / (TP + FP + FN).
To inspect the accuracy of the classification part, we have checked all the images selected for the evaluation.
As the detection accuracy was already calculated, we su- pervised the predicted class labels for each object. Based on the correctly (C) and incorrectly (IC) predicted class labels, we calculated the classification accuracy (CA) = (C) / (C + IC) (Fig.S1c).
For the final detection result, we evaluated four different comparisons. First, we measured self-accuracy of the hu- man experts. This involves intra- and interexpert accur- acies. We measured intraexpert accuracy by multiple annotations of the same images made by the same expert.
We did this by annotating the same images with 2 weeks time difference. The intraexpert accuracies resulted in 97.4% accuracy (precision = 0.985, recall = 0.989, F1 score = 0.987) and 97.8% accuracy (precision = 0.984, re- call = 0.993, F1 score = 0.988). Meanwhile, interexpert accuracy is the comparison of the annotations made by two experts on the same test set. This observation has reached 92.9% accuracy (precision = 0.949, recall = 0.977, F1 score = 0.963). In these cases, we used the test set made by the first annotator as the ground truth. Finally, we compared the ground truth to the predicted bounding boxes. This performed almost as well as the annotators and reached a surprising 94.4% accuracy (precision = 0.966, recall = 0.977, F1 score = 0.971) (Fig.S1d).
For the final classification result, we evaluated four dif- ferent comparisons, following the same scheme as for the detection part. The intraexpert accuracies reached 97% accuracy and 98.1% accuracy. The interexpert ac- curacy resulted in 90.5% accuracy. And the final com- parison achieved 90.1% accuracy.
In vitro experiments
Preparation of primary cultures
The isolation of primary neurons was carried out ac- cording to Pacifici and Peruzzi [30] with some modifica- tions. Primary cortical neurons were obtained from hHSPB1 transgenic mice and wild-type littermates on the 17th embryonic day. Briefly, embryos were washed in cold dissection medium, then the whole brain was ex- tracted and was placed into an ice-cold Hibernate E medium (BrainBits, IL, USA). Cerebral cortices were iso- lated, while meninges were removed from the surface, and cortices were washed 3 times with Hibernate E, then
were enzymatically digested with TrypLE (Gibco, Life Technologies, CA, USA) at 37 °C for 10 min. Next, the digested cortices were washed 3 times with Hibernate E and were homogenized in Neurobasal/B27 complete medium (Gibco, Life Technologies, CA, USA) containing 200 mM Glutamax (Gibco, Life Technologies, CA, USA) with 18-G and 20-G needles (Braun, Germany). Finally, the suspension was diluted with Neurobasal/B27 complete medium, and cells were counted using Count- ess Automated Cell Counter (Thermo Fisher Scientific, MA, USA). Cells were plated on poly-D-lysine-coated 96-well plates at the density of 2 × 10⁴cells/well. Primary neurons were cultured in an incubator with 5% CO2and 37 °C for 5 days.
Primary mouse glial cells were isolated and cultured as described in Lenárt et al. [31]. Briefly, forebrains without the cerebellum and the bulbus olfactorius were obtained from 4-day-old wild-type and hHSPB1 transgenic mice and placed into ice-cold PBS. Meninges were removed from the surface of the brains by using a fine forceps and sterile filter paper. Little pieces of cortices were pi- petted to 50-ml tubes and then the tissue was mechanic- ally dissociated using a long and thin needle (21G 4 ¾, Braun, Germany). Isolated cells were plated onto un- coated T25 flasks (Corning Costar Co., MA, USA) and cultured in low-glucose Dulbecco’s modified Eagle’s medium (Gibco, Life Technologies, CA, USA) containing 10% fetal bovine serum (Sera Plus, Pan Biotech, Aiden- bach, Germany) and gentamycin (Sigma-Aldrich Ltd, Budapest, Hungary) at the concentration of 50μg/ml and were cultured until confluency before used for ex- periments. Medium was changed every 2 days.
Microglial cells were isolated from the surface of pri- mary astroglia cultures [32]. Here astroglia were not pas- saged after reaching confluency but kept in the flask for longer periods. After 10 days, microglia cells migrate to the top of the confluent astroglia layer and start to round up on the surface. After gently tapping the flasks, the detaching microglia cells were collected and plated in astroglia culture medium onto poly-L-lysine-coated 96-well plates with a cell density of 2 × 10⁴ cells/well.
With this method, additional microglia cells were col- lected every second day for up to a week from the sur- face of the glial layer. Half of the medium was changed every day. Microglia cells received 50% glia cell–condi- tioned medium from day 3 and were cultured for 7 days before treatments.
Assessment of the purity of the isolated primary cell cultures by immunostaining
In order to determine the purity of primary neuron, astroglia, and microglia cultures, cells were passaged either to thin-bottom 96-well plates (Corning Costar Co., MA, USA) or to coverslips (VWR, PA, USA) and
stained for specific markers. Glial cells and microglia were cultured on poly-L-lysine-coated glass coverslips and in 96-well plates along with neurons. Following the regular permeabilization and blocking steps (for this, see Methods’ section “Fluorescent immunostain- ing”), cells were stained for specific markers. To evaluate the purity of the neuronal cultures, cells were double-labeled for neuronal marker micro- tubule–associated protein-2 (chicken anti-MAP2, Abcam, Cambridge, UK) and astrocyte marker GFAP (mouse anti-GFAP). Primary isolated astroglia cultures can be contaminated by microglia cells and vice versa;
therefore, to assess the level of astroglia and microglia purity, we stained for GFAP and for the microglial marker IBA1 (goat anti-IBA1) (Table S1). The follow- ing secondary antibodies were used: Alexa Fluor-594–
conjugated donkey anti-chicken (Jackson ImmunoRe- search Europe Ltd., Cambridgeshire, UK); Alexa Fluor-488–conjugated donkey anti-mouse (Life Tech- nologies, Invitrogen, USA), Alexa Fluor-488–conju- gated donkey anti-goat (Life Technologies, Invitrogen, USA), Dylight 549–conjugated goat anti-mouse (Jack- son ImmunoResearch Europe Ltd., Cambridgeshire, UK) (Table S1). After mounting the samples (Fluoro- mount-G; Southern Biotech, AL, USA), pictures were taken at random positions (at least 3 images/sample), using fluorescent confocal laser scanning microscopes:
Olympus Fluoview FV1000 (Olympus Life Science Europa GmbH, Germany) and Leica SP8 Confocal Microscope (Leica Microsystems, Germany). Cell nu- clei were counted for both stainings and an image quantitation was performed where percentages of the marker positive cells were given normalized to the total cell number (n= 3–11).
Treatments and collection of supernates
Primary neurons were treated 5 days after the isolation with human TNFα and IL-1β(10 ng/ml each) and 200 mM EtOH. The treatments on primary neurons were performed in 96-well plates in 50μl/well Neurobasal/
B27 complete medium (Gibco, Life Technologies, CA, USA). After 24 h of treatment, cell culture supernates were collected, an 3-3 wells were pooled, centrifuged at 510g to remove any contaminating cells or debris, and then stored at −80 °C. Meanwhile, cells were fixed with 4% PFA for 20 min and then stored in 1× PBS at 4 °C for immunofluorescent staining.
All treatments and supernate collection from primary astroglia and microglia cells were performed similarly except that a lower concentration of EtOH (50 mM) was used in glial cell culture medium. After the treatment, cell culture supernates were collected and stored at − 80 °C. Cells were fixed with 3% PFA for 15 min at room
temperature and then stored in PBS containing 0.1% so- dium azide at 4 °C for immunofluorescent staining.
Fluorescent immunostaining
To analyze the expression pattern of hHSPB1, PFA-fixed primary neuronal cells were permeabilized with 0.1% Tri- ton X-100 for 10 min. Cells were then blocked with 3%
BSA in PBS for 1 h and were incubated overnight with pri- mary antibodies: chicken anti-MAP2 and rabbit anti- hHSPB1. Subsequently, the cells were incubated with sec- ondary antibodies: Alexa Fluor-594–conjugated donkey anti-chicken and Alexa Fluor-488–conjugated goat anti- rabbit (Thermo Fisher Scientific, MA, USA) for 45 min (TableS1). Cell nuclei were labeled with DAPI (Sigma-Al- drich Ltd, Budapest, Hungary) at 0.5μg/ml for 5 min. The stainings were examined with a Leica SP8 Confocal Microscope (Leica Microsystems, Germany).
To further assess the hHSPB1 expression, microglia and astroglia cells were co-stained for their corresponding markers and for hHSPB1. After PFA fixation, permeabilization was carried out with 0.2% Triton X-100 in PBS for 10 min, followed by blocking with 2% normal horse serum or 5% normal goat serum. Primary antibodies were in- cubated overnight: goat anti-IBA1, mouse anti-GFAP, rabbit anti-hHSPB1. Incubation with secondary antibodies Alexa Fluor-488–labeled donkey anti-goat, Cy3-labeled sheep anti- rabbit (Sigma-Aldrich Ltd, Budapest, Hungary), Dylight A488–conjugated goat anti-rabbit (Jackson ImmunoResearch Europe Ltd., Cambridgeshire, UK), and Dylight 549–conju- gated goat anti-mouse lasted for 1 h. Hoechst dye 33342 was used for nucleus staining (Table S1). After mounting the samples (Fluoromount-G; Southern Biotech, AL, USA), staining was examined by Olympus Fluoview FV1000 con- focal laser scanning microscope (Olympus Life Science Eur- opa GmbH, Hamburg, Germany).
The images were analyzed using the Matlab software (MathWorks, Natick, MA, USA). An average threshold was calculated for each staining using the images from the trans- genic and wild-type animals. The binary images were deter- mined by using the corresponding average threshold.
Objects with a size of less than 4 pixels were eliminated to re- duce any false structures. The colocalization was received by taking overlapping structures of the corresponding binary images. The overall intensities were calculated using the final binary images as masks on the original grayscale images. The intensity values gained from astrocytes were normalized to the pixel numbers from where the intensity data was col- lected (n= 9–12 for GFAP in TG astrocytes;n= 14–15 for GFAP in WT astrocytes;n= 10–11 for hHSPB1 in TG astro- cytes). Due to the presence of astrocytes in neuronal culture, which also highly express the transgene, HSPB1 intensity values were obtained from neurons and normalized to the pixel number of neuronal marker MAP2 (n= 12).
Enzyme-linked immunosorbent assay analysis of cell culture supernates
Concentrations of released hHSPB1 and TNFα in the supernate of all three primary isolated cell cultures were quantified using human HSPB1 ELISA kit (Enzo Life Sciences, NY, USA) and mouse TNF alpha ELISA kit (Life Technologies, Invitrogen, USA). Briefly, cell culture supernates were collected and additional sample diluents were added. For all cell types, samples from multiple ex- periments were tested to create biological and technical parallels (n= 2–3). We used 47 μl sample/well for the mouse TNFα assay, and 95 μl sample/well for the hHSPB1 assay. After the addition of supernates to the wells, the assay was carried out according to the manu- facturer’s instructions.
Statistical analysis
All data obtained in this experiment are expressed as mean ± SEM. Statistical analysis was performed by two- way analysis of variance (2-way ANOVA) followed by Tukey post hoc test using the OriginPro8 software (Ori- ginLab, MA, USA) and unpaired two-tailed ttest using GraphPad Prism software (GraphPad Software Inc., San Diego, CA, USA). Data were considered statistically sig- nificant atp< 0.05.
Results
Expression pattern of transgenic human HSPB1 in the mouse brain
The expression of the transgenic hHSPB1 was studied in the brain of 7-day-old mice using various methods.
Whole-brain homogenates were analyzed by Western blotting (Fig.1a, b) and RT-PCR (Fig.1c). High expres- sion of transgenic hHSPB1 was detected in transgenic brains both at the protein and mRNA levels. hHSPB1 expression increased 24 h after ethanol treatment, espe- cially in the hippocampal region and in the retrosplenial cortex, as shown by our immunohistochemical analysis (Fig. 1d). The cell-specific expression pattern of the transgene was also monitored using NEUN-hHSPB1, GFAP-hHSPB1, and IBA1-hHSPB1 fluorescent double immunostainings (Fig. 1e). The NEUN-hHSPB1 double immunostaining revealed the presence of the transgenic hHSPB1 protein in neuronal cells. The GFAP immuno- labeling colocalized with hHSPB1, indicating that astrocytes also expressed the transgene. IBA1 immuno- reactive microglia, however, showed no remarkable colo- calization with hHSPB1.
Differences in the gene expression of pro- and anti- inflammatory cytokines in hHSPB1 transgenic and wild- type mouse brains
The expression level of cytokines as molecular markers of inflammation was studied using semiquantitative RT-
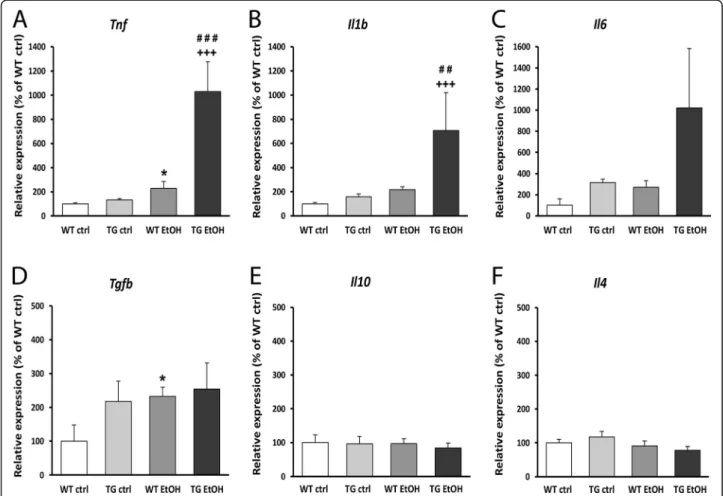
PCR at different time points after ethanol treatment. In nontreated transgenic mice, hHSPB1 overexpression alone did not affect significantly the mRNA level of the studied pro-inflammatory cytokines, whereas it contrib- uted to a marked increase in gene expression after etha- nol treatment. In response to ethanol, the level of Tnf mRNA was elevated as early as 7 h, showing a threefold (297%) increase in wild-type and a fourfold (413%) in- crease in hHSPB1-overexpressing animals compared to saline-treated controls (Fig. S2a). One day later,Tnf ex- pression started to decrease in the wild-type animals but still maintained a twofold (229%) increase compared to the nontreated controls (Fig.2a). However, in transgenic animals, we detected a further elevation in the level of Tnf mRNA, reaching a tenfold (1031%) increase in ex- pression compared to untreated wild-types (Fig. 2a).
Similar changes were found in the expression level of Il1b: it also increased in response to the ethanol treat- ment; however, this had happened at a later time point.
One day after the treatment, it showed a twofold in- crease in the wild-type animals, while in the transgenic ones, we detected a much higher, a more than sevenfold increase (706%, Fig.2b). Another inflammation-inducing cytokine, Il6, also showed a similar, but nonsignificant trend towards increased expression in ethanol-treated transgenic mice (Fig. 2c). Contrarily, in the case of anti- inflammatory cytokines, we observed changes only in the mRNA level ofTgfb, whereas the expression levels of Il10andIl4remained unchanged in response to hHSPB1 overexpression as well as after ethanol treatment (Fig.
2d–f). In the nontreated group, the expression level of the Tgfb was twice as high in hHSPB1-overexpressing animals as in wild-type ones 24 h after saline injection (Fig. 2d). One day after ethanol administration, the ex- pression level of Tgfb showed a significant increase in wild-type animals (233%), whereas in transgenic mice, no further increase was detected. After 1 week, the gene expression levels of the investigated cytokines decreased to their original levels both in the wild-type and in the transgenic brains (Fig.S2a-c).
Altered microglial activation in hHSPB1 transgenic brains The expression level of the microglia-specific allograft inflammatory factor 1 (Aif1, gene encoding protein IBA1) was analyzed using RT-PCR. In the saline-treated group, hHSPB1 transgenic animals had more than two times higherAif1mRNA level (261%) compared to wild- types after 24 h (Fig. 3a). Ethanol administration in- creased the Aif1 mRNA levels in wild-type animals (205%) 1 day after treatment, while no further increase was observed in the ethanol-treated transgenic pups (Fig. 3a). Morphological changes of microglial cells were studied using IBA1 immunostaining which was evalu- ated by deep learning methods. The highest proportions
Fig. 1(See legend on next page.)
of resting microglial cells with highly ramified, fine pro- cesses were detected in the brain of the untreated ani- mals; however, there were some differences observed between the wild-type and transgenic samples (Fig. 3b, c). Control transgenic animals had significantly smaller amounts of activated (intermediate and amoeboid) and higher amounts of resting microglia in the thalamus, and similar, albeit nonsignificant, changes were observed in the other brain regions as well (Fig.3c; see Table S3 for the statistical analysis of the proportion of activated
microglia). In contrast to saline treatment, 24 h after ethanol administration, we detected a high proportion of activated, hypertrophied microglia with increased cell bodies and shorter, thicker processes in the striatum as well as in the parietal and frontal parts of the cortex, whereas amoeboid microglia were only present in a smaller percentage in these areas. Contrarily, in the ret- rosplenial and occipital cortical regions or in the thal- amus and in the hippocampus, we found a particularly high proportion of amoeboid microglia cells along with
Fig. 2Gene expression analysis of inflammatory cytokines and glial activation markers in the brain. Relative expression ofaTnf,bIl1b,cIl6,d Tgfb,eIl10, andfIl4was studied in the brain of hHSPB1-overexpressing and wild-type mice 24 h after ethanol treatment using RT-PCR. Relative expression was correlated with the wild-type control group (100%). Values are presented as mean ± SEM;n= 8 mice per group. Asterisk indicates wild-type EtOH vs wild-type control group; plus sign indicates transgenic EtOH vs transgenic control group; hashtag indicates transgenic EtOH vs wild-type EtOH group. Statistical analysis: 2-way ANOVA followed by Tukey post hoc test. *p< 0.05;##p< 0.01;###/+++p< 0.001
(See figure on previous page.)
Fig. 1Transgene expression analysis in the brain.ahHSPB1 protein expression level was measured in whole-brain homogenates 24 h after ethanol treatment using Western blot. Mouseβ-actin was used as an internal control.bQuantification of the results was performed using the open-source ImageJ software. Fold changes were correlated with the transgenic control group. Data are represented as mean ± SEM;n= 3 mice per group.cRelative expression of the transgenic hHSPB124 h after ethanol treatment was studied in the brain using RT-PCR. Fold changes were correlated with the transgenic control (nontreated) group.
Values are presented as mean ± SEM;n= 8 mice per group.dhHSPB1 immunolabeling on sagittal brain sections of saline- and ethanol-treated transgenic mice 24 h after treatment. Scale bar: 500μm (Ctx, Hip) and 100μm (OCx and RSCx). Ctx cortex, Hip hippocampus, RSCx retrosplenial cortex, OCx occipital cortex.
eFluorescent double immunohistochemistry on sagittal brain sections showing cell type–specific expression of the transgene in the cortical region. Scale bar:
20μm. Red: hHSPB1; green: IBA1/NEUN/GFAP; blue: DAPI
Fig. 3(See legend on next page.)
the intermediate ones (Fig. 3b, c). The proportion of intermediate and amoeboid microglia was significantly higher in all brain areas of the ethanol-treated mice com- pared to those of the control animals; however, the trans- genic group showed a nonsignificant trend of increased proportion of activated microglia compared to ethanol- treated wild-type one (Fig.3c). In parallel, the IBA1 cover- age was more extensive in both ethanol-treated transgenic and wild-type brains compared to control ones. This in- crease in extent after ethanol treatment was more pro- nounced in the transgenic animals with significant differences in the frontal cortical, thalamic, and striatal re- gions (Fig.3d). To determine the characteristic features of the activated microglia cells, we analyzed the expression of M1 (pro-inflammatory) and M2 (anti-inflammatory) phenotypic markers. In the case of M1 markers, onlyCd68 showed notable changes; as in response to ethanol treat- ment, a significant threefold increase (312%) was detected in hHSPB1 transgenic animals, whereas only a slight in- crease was observed in wild-type animals. Interestingly, the level of the other M1 marker, the inducible nitric oxide syn- thase (iNos), remained unchanged after treatment (Fig.3e).
Similar changes were observed for M2 markers. One of the markers, the mannose receptor C-type 1 (Mrc1), also remained unchanged, while the other one, arginase 1 (Arg1), was nearly doubled in wild-type animals (186%) and showed an even significantly higher, almost fourfold in- crease (375%) in hHSPB1 transgenic animals after ethanol treatment (Fig.3e). One week after the treatment, micro- glial cells returned to their resting state-like morphology (Fig.S3a). AlthoughAif1mRNA levels were approximately the same in each group, 1 week after treatment, the IBA1- covered area remained smaller in most brain areas of ethanol-treated wild-type animals compared to those of the control wild-type group (Fig.S2d and Fig.S3b).
Ethanol-induced activation of astrocytes in the brain of hHSPB1-overexpressing mice
In the next step, we studied the mRNA expression levels of GfapandVim, two intermediate filament proteins of
astrocytes used as markers of reactive astrogliosis. The level of Gfap mRNA was increased 24 h after ethanol treatment both in the wild-type and transgenic groups, showing a fourfold increase in the transgenic group (440%) and a twofold increase in the wild-type one (196%, Fig. 4a). In contrast, the expression level of Vim mRNA did not change in the wild-type group and only slightly increased in the transgenic group in response to ethanol treatment (Fig. 4a). The level of both markers returned to the level of the control group 1 week after the treatment (Fig. S2e-f). The expression pattern of GFAP at the protein level and morphological changes of astrocytes was studied using immunohistochemistry. No significant change was detected in the morphology of astroglia 24 h after ethanol treatment (Fig. S4a-b). One week later, however, an increased GFAP immunoreactiv- ity and hypertrophic astrocytes were detected in differ- ent brain regions both in wild-type and transgenic mice in response to ethanol treatment (Fig.4b, c). Quantifica- tion of the immunostained area revealed a strong en- hancement in GFAP coverage throughout the brain 1 week after ethanol treatment. A significant difference be- tween ethanol-treated wild-type and transgenic mice was found in the striatum and in the parietal cortex (Fig.4b).
Changes in the level of ethanol-induced apoptosis in HSPB1-overexpressing transgenic mice
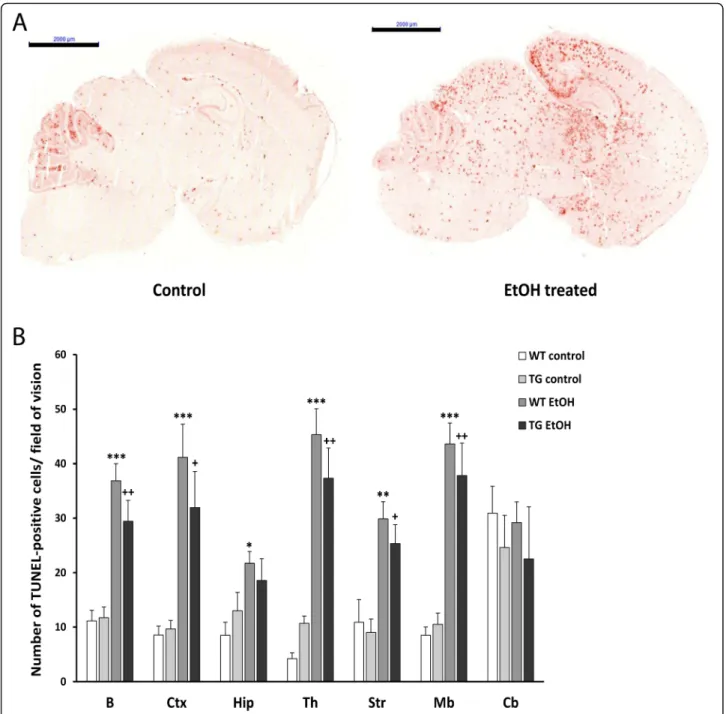
In order to detect programmed cell death in the brain sections of mice, we analyzed the amount of fragmented DNA using TUNEL assay. In the brain of the control, saline-treated animals, a very low level of apoptosis was observed, while the number of TUNEL-positive cells was dramatically increased 24 h after ethanol treatment (Fig. 5a). For quantitative comparison, the TUNEL-positive cells were counted in fifteen areas of each brain section of each group.
The statistical analysis revealed a significant increase in the number of apoptotic cells in most of the stud- ied brain regions following ethanol treatment. The highest number of apoptotic cells was found in the
(See figure on previous page.)
Fig. 3Activation of microglia 24 h after ethanol treatment in the brain of transgenic and wild-type mice.aRelative expression ofAif1in the brain of hHSPB1-overexpressing and wild-type mice 24 h after ethanol treatment. Relative expression was correlated with the wild-type control group (100%).n= 8 mice per group.bMorphological changes of microglia 24 h after EtOH treatment on sagittal brain sections of hHSPB1-
overexpressing and wild-type mice. Microglia with different morphologies were visualized with IBA1 immunostaining using the peroxidase method. Scale bar: 100μm (OCx and Hip).cProportions of IBA1+ microglia in different brain regions according to their morphology.d Quantification of IBA1 immunoreactive areas. Results are given in percentage of the immunopositive areas compared to the outlined brain areas (relative area).n= 3 mice per group, 3 sections per animal.eRelative expression of M1 microglia markers (Cd68,iNos) and M2 microglia markers (Mrc1,Arg1) in the brain of hHSPB1-overexpressing and wild-type mice 24 h after ethanol treatment. Relative expression was correlated with the wild-type control group (100%).n= 8 mice per group. Values are presented as mean ± SEM. Asterisk indicates wild-type EtOH group vs wild-type control group; plus sign indicates transgenic EtOH group vs transgenic control group; hashtag indicates transgenic EtOH group vs wild-type EtOH group; white triangle indicates transgenic control vs wild-type control group. Statistical analysis: 2-way ANOVA followed by Tukey post hoc test.
*/#/+/Δp< 0.05; **/##/++p< 0.01; ***/###/+++p< 0.001. Ctx cortex, Hip hippocampus, RSCx retrosplenial cortex, OCx occipital cortex, PCx parietal cortex, FCx frontal cortex, Th thalamus, Str striatum
cortex, thalamus, striatum, and midbrain, whereas a lower level of apoptosis was detected in the hippocampus. In the cerebellum, a high level of physiological cell death was vis- ible, but the number of apoptotic cells remained similar after ethanol treatment (Fig. 5b). Comparing wild-type and hHSPB1-overexpressing animals, a slightly lower number of apoptotic cells was found in the brain of the
transgenic animals; however, the difference was not statis- tically significant (Fig.5b).
These in vivo results (summarized in Fig.S9) served as a basis for our subsequent in vitro experiments where we aimed to characterize the specific cell type that could be responsible for the aforementioned alteration of immune regulation triggered by the overexpression of hHSPB1.
Fig. 4Astrocyte activation after ethanol treatment in the brain of transgenic and wild-type mice.aRelative expression ofGfapandVimin the brain of hHSPB1-overexpressing and wild-type mice 24 h after ethanol treatment. Relative expression was correlated with the wild-type control group (100%).n= 8 mice per group.bAstrocytes with different morphologies were visualized with GFAP immunostaining using the peroxidase method 1 week after EtOH treatment. Quantification of GFAP immunoreactive areas: results are given in percentage of the immunopositive areas compared to the outlined brain areas (relative area).n= 3 mice per group, 3 sections per animal.cMorphological changes of astrocytes 1 week after EtOH treatment on sagittal brain sections of hHSPB1-overexpressing and wild-type mice. Scale bar: 500μm. Values are presented as mean ± SEM. Asterisk indicates wild-type EtOH group vs wild-type control group; plus sign indicates transgenic EtOH group vs transgenic control group;
hashtag indicates transgenic EtOH group vs wild-type EtOH group. Statistical analysis: 2-way ANOVA followed by Tukey post hoc test. */+p< 0.05;
**/##/++p< 0.01; ***/###/+++p< 0.001. Hip hippocampus, RSCx retrosplenial cortex, OCx occipital cortex, PCx parietal cortex, FCx frontal cortex, Th thalamus, Str striatum
Characterization of primary neuronal, astrocyte, and microglial cell cultures derived from hHSPB1 and wild- type mice
Primary neuron, astrocyte, and microglia cultures were prepared from the brain of hHSPB1 transgenic animals and from their wild-type littermates. First, the purity of the primary cultures was assessed by fluorescent immu- nohistochemistry, examining the presence of microglial
(IBA1), astrocyte (GFAP), and neuronal (MAP2) markers. IBA1-GFAP double staining of the primary microglia culture confirmed that its purity exceeded 93%
(Fig. 6a). We used the same double staining to deter- mine the purity of the primary astrocyte culture, which indicated that the microglia cells were present at the cell culture at a proportion of 22% (Fig. 6b). The primary neuronal culture was labeled with MAP2 and GFAP
Fig. 5Apoptotic cell death detection using TUNEL assay 24 h after EtOH treatment.aProgrammed cell death was detected on sagittal brain sections of control and EtOH-treated hHSPB1-overexpressing and wild-type mice after 24 h of the respective treatment. Scale bar: 2000μm.bApoptotic cells were counted in the brain of transgenic and wild-type mice 24 h after EtOH treatment. Values are presented as mean ± SEM;n= 6 mice per group. Asterisk indicates wild-type EtOH group vs wild-type control group; plus sign indicates transgenic EtOH group vs transgenic control group. Statistical analysis: 2-way ANOVA followed by Tukey post hoc test. */+p< 0.05; **/++p< 0.01; ***p< 0.001. B whole brain, Ctx cortex, Hip hippocampus, Th thalamus, Str striatum, Mb midbrain, Cb cerebellum
Fig. 6(See legend on next page.)
antibodies, which showed that more than 85% of the cells were neurons in the culture (Fig. 6c). We also analyzed the expression pattern of the transgene in the primary cell cultures using hHSPB1-MAP2, hHSPB1- GFAP, and hHSPB1-IBA1 fluorescent immunostainings.
The colocalization of the cell-specific markers with hHSPB1 was similar to what was observed in the brain sections earlier. We found that hHSPB1 colocalized with MAP2 and GFAP, but was rarely detectable together with IBA1, indicating that the transgenic hHSPB1 pro- tein was mainly expressed by primary neurons and astrocytes (Fig.6d).
Effect of ethanol and cytokine treatment on the TNFα production of primary neuron, astrocyte, and microglia cultures
Primary cell cultures were treated with ethanol in order to investigate the effect of alcohol on different cell types of the brain. Ethanol can induce inflammatory processes in the brain directly by itself and also by its metabolites [33, 34], and it can also contribute to cerebral
inflammation indirectly by disrupting the integrity of the blood-brain barrier, subsequently promoting the infiltra- tion of peripheral immune cells to the brain [35]. Con- sidering this affiliation of ethanol treatment with inflammation, we also treated our model with pro- inflammatory cytokines in order to model the inflamma- tory milieu connected with the presence of ethanol. The effective treatment concentrations of the cytokine and ethanol were selected based on the data available in the literature [21, 36] and on corresponding cell viability measurements. We used a concentration of 50 mM etha- nol for astrocytes and microglia cells and 200 mM for neurons. During the cytokine treatment, the combin- ation of 10 ng/ml human TNFαand 10 ng/ml human IL- 1β was applied to all cell types (see Supplementary ma- terial and Fig.S5for further details).
In order to analyze which cell type is the main source of TNFαand to confirm whether hHSPB1 regulates cytokine production in different brain-derived cells in our model, we performed an enzyme-linked immunosorbent assay (ELISA) assay specific against TNFαusing the supernates
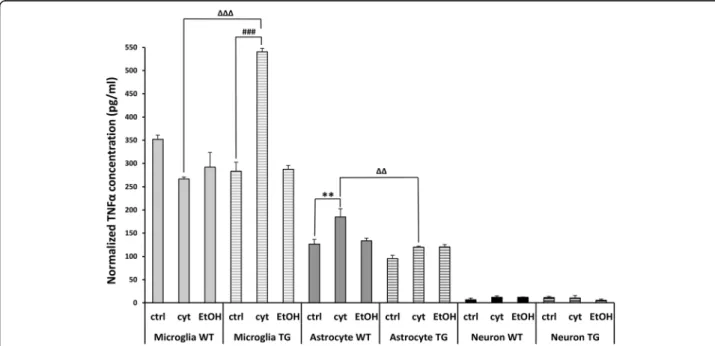
Fig. 7Quantification of TNFαproduction of primary cell cultures. Twenty-four hours after EtOH and cytokine treatment, cell culture supernates were collected. Concentrations of released TNFα(pg/ml) in the supernate of all the three isolated primary cell cultures were quantified using ELIS A. TNFαconcentrations were normalized to cell number of microglia and to RTCA values of astrocytes and neurons. crtl untreated control, EtOH ethanol treatment, cyt cytokine treatment. Values presented are means ± SEM;n= 2–3. Asterisk indicates wild-type cytokine vs wild-type control group; hashtag indicates transgenic cytokine vs transgenic control group; white triangle indicates transgenic cytokine vs wild-type cytokine group. Statistical analysis: 2-way ANOVA followed by Tukey post hoc test. **/ΔΔp< 0.01;###/ΔΔΔp< 0.001
(See figure on previous page.)
Fig. 6Characterization of the established primary cell cultures. Evaluation of the purity of primaryamicroglia,bastrocyte, andcneuronal cultures using fluorescent immunohistochemistry and detection of the presence of microglial (IBA1—green), astrocytic (GFAP—green/red), and neuronal (MAP2—red) markers. Cell nuclei were counted for cell-specific markers and percentages compared to the total cell number are given.
Scale bar: 100μm. Values are presented as mean ± SEM;n= 3–11.dAnalysis of the expression pattern of the transgenic hHSPB1 protein in primary cell cultures using double immunofluorescent staining. Scale bar: 50μm. Green: hHSPB1; red: IBA1/MAP2/GFAP; blue: DAPI
from primary cultures. The TNFα concentration values were normalized to the corresponding cell viability mea- surements: to cell number for microglia and to RTCA values for astrocytes and neurons. Under control condi- tions, TNFα was detectable in the highest proportion in the supernates of glial cells. Microglial cells had almost three times higher basal expression of TNFα (TG group:
283 pg/ml; Wt group: 351 pg/ml; columns 1–6, Fig. 7) compared to astrocytes (TG group: 95 pg/ml; Wt group:
126 pg/ml; columns 7-12, Fig.7), indicating that microglia are the primary source of TNFα in the brain. Cytokine treatment significantly increased the release of TNFαfrom hHSPB1-expressing transgenic microglial cells compared to nontreated transgenic cells (from 283 to 540 pg/ml).
However, no such effect was observed in wild-type micro- glia. This indicates that the overexpression of hHSPB1 might modulate the release of TNFαsince microglia from hHSPB1 transgenic animals expressed a significantly higher level of TNFα after cytokine treatment than the cytokine-treated wild-type group (540 pg/ml and 266 pg/
ml, respectively; Fig. 7). Contrarily, after cytokine treat- ment, TNFα production was significantly higher in wild- type astrocytes compared to the control group; however, it remained unchanged in the hHSPB1 transgenic cells resulting in a significant difference between the two geno- types upon cytokine treatment (WT: 184 pg/ml and TG:
120 pg/ml, respectively; Fig.7). Surprisingly, ethanol treat- ment only did not elicit a response from either glial cell type (Fig.7). In the supernates of primary neurons, a very low TNFα presence was observed under control condi- tions (Fig.7), and no change was seen in response to the various treatments.
Effect of cytokine and ethanol treatments on extracellular and intracellular hHSPB1 levels
To determine whether extracellular or intracellular hHSPB1 elicits the proposed inflammation-regulating ef- fects, we examined the level of hHSPB1 protein in the cell culture supernates by ELISA and in the cells by im- munohistochemistry. The results of the human HSPB1 ELISA showed that no detectable amount of hHSPB1 was released by any of the analyzed cell types, upon treatment or under control conditions (Fig. S6). As microglial cells did not express an appreciable amount of intracellular hHSPB1 even after treatment (Fig. S7), we analyzed the changes in the intracellular level of the transgenic protein only in primary astrocytes and neu- rons. We found that the expression level of the trans- gene within primary neurons and astrocytes was influenced by the different treatments. In the case of pri- mary neurons, the size of the MAP2-positive area was not altered by cytokine treatment, while it was signifi- cantly reduced by the ethanol treatment in both trans- genic and wild-type neuronal cultures (to 41% and 46%,
respectively) (Fig.8a, b, Fig.S8a-b). In HSPB1 transgenic neurons, the fluorescence intensity corresponding to hHSPB1 remained unchanged after ethanol treatment, whereas it showed a moderate, but not significant in- crease after the cytokine treatment (Fig. 8a, c). In astro- cyte cells, treatment with cytokines or ethanol elevated the intracellular GFAP levels. The cytokine treatment re- sulted in a significant increase in GFAP intensity in both transgenic and wild-type cells (to 138% and to 131%, re- spectively), whereas after the exposure to ethanol, a sig- nificant change was detected only in the transgenic astrocytes (136 %), but not in wild-type ones (Fig.8d, e, Fig.S8c-d). In transgenic astrocytes, the level of hHSPB1 expression elevated significantly to 475% well above the control’s baseline expression after cytokine treatment and up to 205% after the ethanol treatment (Fig.8d, f).
Discussion
The neuroprotective role of HSPB1 in both acute and chronic neurodegenerative disorders has been previously demonstrated by multiple research groups including ours [20, 37, 38]. In parallel, a number of studies, using either mouse models of peripheral inflammation or cell cultures, revealed the regulatory function of HSPB1 in inflammation. In these studies, HSPB1 was affiliated with either pro- or anti-inflammatory functions in a context- dependent manner [2]. By expanding our knowledge on HSPB1 function as an immunoregulatory factor, it could become a potential therapeutic target for fine-tuning neuroinflammation, which is a common pathological characteristic of most neurological disorders. Therefore, in the present study, we investigated the immunoregula- tory role of hHSPB1 in neuroinflammation using our previously established hHSPB1-overexpressing mouse model, as well as using primary cell cultures isolated from the brain of these transgenic animals.
The brain is extremely sensitive to the cytotoxic effect of ethanol during synaptogenesis, the period of brain de- velopment when it undergoes rapid growth. Neurons are vulnerable to ethanol-induced damage at this period to such an extent that even a single day of alcohol treatment can lead to neurodegeneration in the brain. Ikonomidou and colleagues [21] demonstrated that maintaining the blood ethanol concentration in 7-day-old rat pups above a toxic threshold (200 mg/dl) for at least 4 h triggers apop- totic cell death detectable 24 h after the treatment. Besides apoptosis, acute ethanol overdose has been demonstrated to trigger microglia and astrocyte activation in different animal models, so it is also suitable for investigating neu- roinflammation [39]. Therefore, in this study, the same ex- perimental arrangement was used to induce brain damage in wild-type and hHSPB1-overexpressing transgenic mice.
In our transgenic animals, the human HSPB1 gene expres- sion is driven by a cytomegalovirus (CMV) promoter. It is
Fig. 8(See legend on next page.)