Genome-wide reprogramming of the chromatin landscape underlies endocrine therapy resistance in breast cancer
Luca Magnania,1, Alexander Stoeckb, Xiaoyang Zhanga, András Lánczkyc, Anne C. Mirabellaa,2, Tian-Li Wangb, Balázs Gyorffyc,3, and Mathieu Lupiena,d,e,f,3
aNorris Cotton Cancer Center, Geisel School of Medicine, Dartmouth College, Lebanon, NH 03756;bDepartments of Gynecology/Obstetrics and Oncology, Johns Hopkins University, Baltimore, MD 02131;cResearch Laboratory for Pediatrics and Nephrology, Hungarian Academy of Sciences, H-1083, Budapest, Hungary;dOntario Cancer Institute, Princess Margaret Cancer Center–University Health Network, Toronto, ON, Canada M5G 1L7;eOntario Institute for Cancer Research, Toronto, ON, Canada M5G 1L7; andfDepartment of Medical Biophysics, University of Toronto, Toronto, ON, Canada M5G 2M9
Edited by Bert W. O’Malley, Baylor College of Medicine, Houston, TX, and approved March 7, 2013 (received for review November 16, 2012) The estrogen receptor (ER)αdrives growth in two-thirds of all breast
cancers. Several targeted therapies, collectively termed endocrine therapy, impinge on estrogen-induced ERαactivation to block tumor growth. However, half of ERα-positive breast cancers are tolerant or acquire resistance to endocrine therapy. We demonstrate that ge- nome-wide reprogramming of the chromatin landscape, defined by epigenomic maps for regulatory elements or transcriptional activa- tion and chromatin openness, underlies resistance to endocrine ther- apy. This annotation reveals endocrine therapy-response specific regulatory networks where NOTCH pathway is overactivated in re- sistant breast cancer cells, whereas classical ERαsignaling is epige- netically disengaged. Blocking NOTCH signaling abrogates growth of resistant breast cancer cells. Its activation state in primary breast tumors is a prognostic factor of resistance in endocrine treated patients. Overall, our work demonstrates that chromatin landscape reprogramming underlies changes in regulatory networks driving endocrine therapy resistance in breast cancer.
open chromatin
|
histone modification|
drug resistance|
epigenetic|
transcriptional regulation
O
ver two-thirds of breast cancers rely on the estrogen receptor alpha (ERα) for growth. This transcription factor binds dis- tant regulatory elements upon activation by estrogen (1, 2) to promote a transcriptional program typical of good outcome tumors (3, 4). This is facilitated by pioneer factors, including FOXA1, PBX1, TLE1, and AP2γ, which interact with epigenetic mod- ifications, including the mono- and dimethylation of lysine 4 on histone H3 (H3K4me1/me2) (5–8), to locally maintain chromatin open, enabling ERαbinding (7, 9–12).Estrogen receptor (ER) ERα-positive tumors are treated with endocrine therapies (ETs) that block the estrogen-induced ERα activation. These consist of selective ER modulators (e.g., ta- moxifen), interfering with estrogen binding to ERα; aromatase inhibitors (e.g., letrozole), blocking estrogen biosynthesis; or se- lective ER down-regulators (SERDs) (e.g., fulvestrant), promoting receptor degradation (13). Approximately half of the tumors are tolerant or acquire resistance to these therapies (14, 15), leading to poor outcome (1). This is true for all ET including SERDs (16–18), suggesting that resistance can arise through ERα-independent mechanisms.
Reprogramming of the chromatin landscape, through epigenetic modifications or changes in chromatin openness (19), is an integral component of cellular differentiation that favors lineage-specific transcriptional programs (20–23). Acquisition of ET resistance (ETR) is a long-term sequential process accompanied by extensive transcriptional reprogramming reminiscent of cell fate commit- ment (24–28). This suggests that reprogramming of the chromatin landscape may play a central role in ETR. Previous reports focused on theUBE2Clocus demonstrate that epigenetic reprogramming promotes ETR in prostate cancer (8). Here, we investigate the
extent of reprogramming to the chromatin landscape occurring across the genome of breast cancer cells as they acquire ETR, delineating its impact on transcriptional network to identify the functional biology and targets for therapeutic intervention.
Results
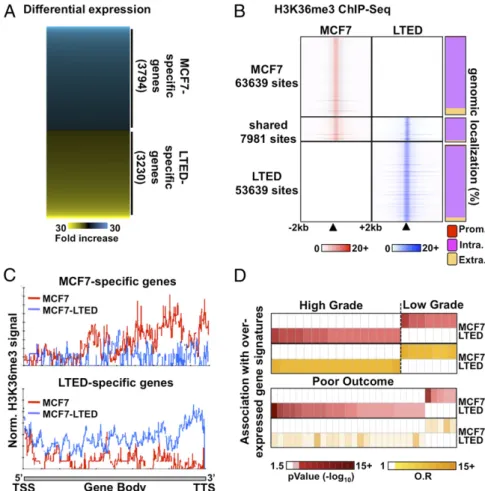
Epigenetic Reprogramming Within Transcriptional Units Characterizes Response to Endocrine Therapy.The transcriptional programs differ significantly between ET-resistant and -responsive breast cancer cells (27–29), including ET-responsive MCF7 and ET-resistant MCF7–long-term estrogen-deprived (LTED) cells, which gradually acquire resistance upon culture in estrogen/steroid-free conditions modeling aromatase inhibitor resistance (26, 30–32). Indeed, ex- pression profiling identified 3,230 genes preferentially expressed in LTED and 3,794 genes preferentially expressed in parental MCF7 cells (cutoff atP<5×e−2) (Fig. 1AandSI Appendix, Table S1).
This parallels distinct genome-wide distributions between LTED and MCF7 breast cancer cells for the histone H3 lysine 36 trime- thylation (H3K36me3), an epigenetic hallmark of transcriptional
Significance
Resistance to treatment with endocrine therapy occurs in∼50%
of all breast cancer patients. The pathway(s) leading to drug resistance is ill-defined. We show that accessibility to the genome is altered in drug-resistant compared with responsive breast can- cer cells. This coincides with the overactivation of the NOTCH pathway in drug-resistant compared with responsive cancer cells.
The transcription factor PBX1, a known NOTCH target gene, is required for the growth of endocrine therapy-resistant breast cancer cells. Accordingly, a gene expression signature based on NOTCH-PBX1 activity can discriminate a priori breast cancer patients that are responsive or not to endocrine therapy.
Author contributions: L.M., T.-L.W., B.G., and M.L. designed research; L.M., A.S., X.Z., A.L., and A.C.M. performed research; A.S., A.L., T.-L.W., and B.G. contributed new reagents/
analytic tools; L.M., A.S., X.Z., A.L., T.-L.W., B.G., and M.L. analyzed data; and L.M., B.G., and M.L. wrote the paper.
Conflict of interest statement: L.M. and M.L. hold a patent on the use of PBX1 and the NOTCH/PBX1-dependent gene signature presented in this paper for prognostic purposes to discriminate endocrine therapy-responsive from nonresponsive ERα-positive breast cancer patients.
This article is a PNAS Direct Submission.
Data deposition: The data reported in this paper have been deposited in the Gene Ex- pression Omnibus (GEO) database,www.ncbi.nlm.nih.gov/geo(accession nos.GSE37323 andGSE39418).
1Present address: Division of Cancer, Imperial College, London W120NN, United Kingdom.
2Present address: Epigenetics Group, Medical Research Council, Imperial College, London W120NN, United Kingdom.
3To whom correspondence may be addressed. E-mail: gyorffy@kmplot.com or mlupien@
uhnres.utoronto.ca.
This article contains supporting information online atwww.pnas.org/lookup/suppl/doi:10.
1073/pnas.1219992110/-/DCSupplemental.
elongation (33–35) (Fig. 1BandSI Appendix, Fig. S1A). Indeed, micrococcal nuclease (MNase)–ChIP-seq assays against this mark revealed over 50,000 sites specific to either cell types (Fig. 1B).
Only∼12% of H3K36me3 sites were shared between MCF7 and LTED cells (Fig. 1BandSI Appendix, Fig. S1A). Importantly, the H3K36me3 signal from LTED cells was stronger than the signal from MCF7 cells across the body of genes preferentially expressed in LTED cells detected by microarray expression profiling and vice versa (Fig. 1C).
Oncomine Concepts Map analysis (36) revealed that genes preferentially expressed in LTED cells are significantly associated with signatures of genes overexpressed in high-grade or poor- outcome tumors in vivo (P<0.01; odds ratio, >1.5) (Fig. 1D).
Conversely, genes preferentially expressed in MCF7 cells associ- ate with expression signatures from low-grade (Fig. 1D). Overall, this suggests that the transcriptional programs that characterize ET-resistant breast cancer cells are correlated with changes in histone modifications and preferentially associate with genes expressed in breast tumors with poor prognosis and more likely to relapse (37, 38).
Reprogramming of Regulatory Elements Marks Resistance to Endocrine Therapy.Cell type- and tissue-specific transcriptional programs are strongly driven by lineage-specific regulatory elements, such as enhancers. Epigenomic maps for H3K4me2 can readily identify
these regulatory elements (5, 20, 39–47). We profiled this modi- fication using MNase–ChIP-seq assays in MCF7 and LTED cells to determine whether the distinct transcriptional program of ET- resistant vs. -responsive breast cancer cells relies on global reprog- ramming of regulatory elements. This identifies a total of 27,354 and 15,439 sites specific to LTED and MCF7 cells, respectively, whereas 30,026 sites are shared (Fig. 2AandSI Appendix, Fig. S1B).
H3K4me2 sites specific to either MCF7 or LTED cells maps pref- erentially outside of promoters compared with shared sites (91%, 87%, and 77%, respectively) (Fig. 2A).
The presence of the H3K4me2 mark is insufficient to discrim- inate active from poised functional regulatory elements. To re- solve this, we measured open chromatin (6, 48), through formaldehyde assisted isolation of regulatory elements (FAIRE)- seq assays (49). This reveals that 85% of open chromatin sites are cell type-specific and lie away from promoters. Only a minority of sites is shared between responsive and resistant cells (∼15%) (Fig.
2BandSI Appendix, Fig. S1C), suggesting that significant changes in the open chromatin landscape discriminate ET response in breast cancer cells (Fig. 2B).
Resistant Cell Lines Disengage from Classical ERαSignaling.ERαis highly expressed in most ET-resistant breast tumors and model cell lines (SI Appendix, Fig. S1D) (50, 51). Whether this is in- dicative of its active contribution to ETR is still unclear. Presence
Fig. 1. Distinct transcriptional programs typify ET response. (A) Microarray-based expression profiling in ET-resistant LTED and -responsive MCF7 breast cancer cells reveals distinct transcriptional profiles. (B) MNase–ChIP-seq profiling of H3K36me3 in LTED (blue) and MCF7 (red) cells over a 4-kb window around called peaks (Left). The proportion (%) of H3K36me3 sites mapping to promoters (prom), intragenic (intra), or extragenic (extra) regions are presented for the unique or shared sites between MCF7 and LTED cells (Right). (C) ChIP-seq enrichment for H3K36me3 from either MCF7 (red line) or LTED (blue line) cells across genes specifically expressed in MCF7 (Upper) or LTED (Lower) cells based on the microarray expression profile. (D) Oncomine Concepts Map analysis com- paring genes overexpressed in LTED (>twofold ratio vs. MCF7) or in MCF7 (>twofold ratio vs. LTED) cells and expression signatures from high-grade, low- grade, or poor-outcome breast tumors are presented.
MEDICALSCIENCESPNASPLUS
of the estrogen response elements (EREs) that are recognized by ERαin open chromatin or H3K4me2-marked genomic regions is a proxy for estrogen-dependent ERαbinding (52). This motif is significantly enriched in the H3K4me2, FAIRE, and FAIRE- H3K4me2 epigenomic maps specific to MCF7 (Fig. 2C). It is also enriched in extragenic H3K36me3 sites specific to MCF7 cells (Fig. 2C), in agreement with the enrichment of this histone mark at active distant regulatory elements (48). In contrast, the ERE motif is not enriched in FAIRE, FAIRE-H3K4me2, or extragenic H3K36me3 sites and is reduced in H3K4me2 sites specific to LTED or shared with MCF7 cells (Fig. 2C). This suggests that classical ERαsignaling through ERE-enriched regions is reduced in ET-resistant breast cancer cells. In agreement, overlap analysis performed using the Genome Structure Correction (GSC) tool (40) comparing epigenomic maps with estrogen-induced ERαcistromes derived from two independent studies (53, 54) reveals the prefer-
ential overlap of estrogen-induced ERα cistrome with MCF7 compared with LTED epigenetically marked regions (14.7%, 5.8%, and 13.1% vs. 5.2%, 1.1%, and 11.4% for FAIRE, FAIRE- H3K4me2, or H3K4me2 regions, respectively) (SI Appendix, Fig.
S1EandF).
Recently, ERαcistromes from ET-responsive (good-outcome) and ET-resistant (poor-outcome) breast tumors have identified gene signatures specific to responsive or resistant breast tumors (55). Median expression of genes that are part of the resistant signature, such as RACGAP1, ERBB2, and TMEM97, is higher in ET-resistant cells, whereas median expression is higher in MCF7 cells for genes, such as LOXL1, TAF1C, and PRKCSH, that are part of the responsive signature (Fig. 2DandSI Appendix, Fig. S2AandB). To determine whether the expression of these genes relies on ERαsignaling, we measured their expression in ET-responsive and -resistant breast cancer cells upon ERα si-
as in Fig. 1B. (B) Genome-wide analysis of open chromatin regions (FAIRE-seq) from MCF7 and LTED are presented as in Fig. 1B. (C) Enrichment of the ERE within epigenetically defined regions (H3K4me2, FAIRE, and H3K36me3) from LTED and MCF7 cells. (D) Expression level based on microarray analysis in LTED (blue) and MCF7 (red) cells of genes discriminating ET response based on ERα-binding profiles in good-outcome (responsive) and poor-outcome (resistant) primary breast tumors. (E) Transcriptional analysis of a selected list of genes discriminating good- and poor-outcome breast tumors (55) in response to ERαsilencing in MCF7 or ET-resistant breast cancer cell line models. Expression is presented as mRNA fold change comparing siERαto control (siCTRL). The central circle indicates ERα- silencing efficiency. (F) Growth assays using two different siRNA targeting ERαare represented. Cell number is plotted as a ratio against day 0.
lencing. This included two tamoxifen-resistant (TMX2-11 and TMX2-28) (56) and three aromatase inhibitor-resistant cells (MCF7-LTED LM 6mo, LM>12mo, and HA) (27, 57). Estab- lished estrogen-target genes, namely TFF1, XBP1, CA12, and RARA (10, 58, 59), were also included as controls. This reveals that ERαdepletion alters the expression of all tested genes in ET-responsive MCF7 breast cancer cells but only affects a small subset of these genes in resistant cells (Fig. 2EandSI Appendix, Fig. S2A andB). Growth assays using the same cells and the additional tamoxifen-resistant (TMX2-4) (52, 56), aromatase inhibitor-resistant (MCF7-LTED ME and T47D-LTED ME) (10, 27, 57–59), and fulvestrant-resistant cells (MCF7-FulR-KN) (60) reveal the requirement for ERα only in responsive breast cancer cells (Fig. 2F). Altogether, these data suggest that clas- sical ERαsignaling does not significantly contribute to ETR in breast cancer.
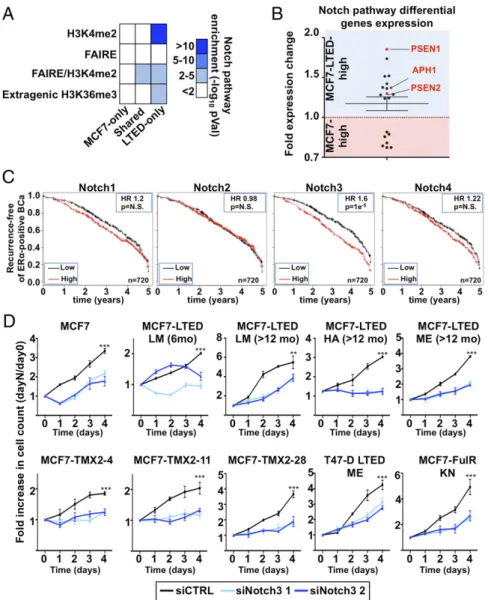
Reprogramming of the Chromatin Landscape Promotes NOTCH Signaling in Resistant Breast Cancer.We performed a Genomic Region En- richment of Annotation Tool (GREAT) analysis to identify the
biological networks engaged in regulating transcription in ET- resistant breast cancer cells (61). This revealed the enrichment of the NOTCH pathway in epigenomic maps of LTED-specific enhancers (Fig. 3A) where the majority of genes defining this pathway (62) are preferentially expressed in LTED compared with MCF7 cells (Fig. 3B). This includes the threeγ-secretase complex subunit PSEN1, PSEN2, and APH1 (Fig. 3Band SI Appendix, Fig. S3AandB). Cleavage of NOTCH proteins by the γ-secretase complex drives its activation (63), suggesting that increased secretase activity may account for an increased NOTCH signaling in ET-resistant breast cancer cells. Kaplan–
Meier analysis integrating 21 breast cancer datasets (64) shows that NOTCH3 is the only family member whose expression discriminates progression in ERα-positive breast cancer (Fig. 3C and SI Appendix, Fig. S3 C–E). A patient’s stratification is detected within thefirst 5 y from diagnosis, which corresponds to the time frame with the highest risk of recurrence and me- tastasis in ERα-positive breast cancer (14, 65, 66) (SI Appendix, Fig. S4 A and B). Growth assays following NOTCH family members (NOTCH1, -2, -3, or -4) depletion using specific siR-
Fig. 3. NOTCH pathway is critical for growth of resistant cells. (A) Enriched pathway analysis using GREAT reveals the significant enrichment of the NOTCH pathway in H3K4me2, FAIRE, or extragenic H3K36me3 regions specific to LTED compared with MCF7 cells. (B) Expression level based on microarray analysis in LTED and MCF7 cells of genes defining the NOTCH pathway [Kyoto Encyclopedia of Genes and Genomes (KEGG) pathway]. (C) Kaplan–Meier analysis for the NOTCH family members against ERα-positive breast tumors. (D) Growth assays using two different siRNA targeting NOTCH3 are represented. Cell number is plotted as a ratio against day 0.
MEDICALSCIENCESPNASPLUS
sistant cell lines only upon NOTCH3 silencing (Fig. 3D), sup- porting a central role for NOTCH3 signaling in these cells.
NOTCH3 depletion also reduced growth of MCF7 cells (Fig.
3D), suggesting that this specific signaling pathway may have already primed ERα-positive breast cancer cells for resistance to ET.
PBX1 Mediates NOTCH3 Signaling in Resistant Breast Cancer Cells.
NOTCH3 controls a large number of downstream target genes such as the pioneer factor PBX1 (67). We recently demonstrated that PBX1 expression in ERα-positive primary breast tumors stratifies patients for metastasis-free survival (7). Expression of PBX1 is dependent on NOTCH3 expression in ET-resistant cells (SI Appendix, Fig. S5AandB). Confocal imaging proves the nu- clear localization of PBX1 in these cells (SI Appendix, Fig. S5C).
Compared with ET-responsive cells, PBX1 mRNA expression is
primary and metastatic lesions compared with normal tissue (SI Appendix, Fig. S5EandF). Moreover, PBX1 knockdown abro- gates the growth of PBX1-positive ET-responsive or -resistant breast cancer cell lines (Fig. 4A) (7, 67), whereas it had no effect on breast cancer cells with low PBX1 expression (SI Appendix, Fig.
S6A). Notably, PBX1 overexpression rescue MCF7 cells from proliferation defects induced by NOTCH3 silencing (SI Appendix, Fig. S6B).
PBX1 activity in ET-responsive cells guides the expression of genes typical of breast tumors that fail to respond to ET (7). To determine whether PBX1 maintained the expression of these genes in resistant cells, we conducted expression-profiling assays in cells depleted or not of PBX1 and identified 439 genes dependent on PBX1 for their expression in ET-resistant breast cancer cells, of which 153 were common with ET-responsive cells (Fig. 4BandSI Appendix, Fig. S6C and Table S2). A total of 650 genes are de-
Fig. 4. PBX1 contributes to ETR regulating a unique transcriptional program. (A) Growth assays using two different siRNA targeting PBX1 are represented.
Cell number is plotted as a ratio against day 0. (B) Microarray analysis comparing PBX1-dependent expressed genes in MCF7 and LTED cells and the expression levels of the one shared between both cell lines. (C) ChIP-seq for PBX1 around the PBX1-dependent expressed genes shared between MCF7 and LTED cells (±20 kb from transcription start site). Motif search analysis was conducted on the unique and shared PBX1-binding sites. (D) Microarray analysis for the transcription factors recognizing the motifs identified inC. (E) qRT-PCR of PKNOX1 mRNA levels upon siRNA treatment. (F) Growth assays using two different siRNA targeting PKNOX1 are represented. Cell number is plotted as a ratio against day 0.
pendent on PBX1 for their repression in resistant LTED cells, of which 167 are common with ET-responsive cells (SI Appendix, Fig.
S6Dand Table S2). Kaplan–Meier analyses indicate that the ex- pression level in primary breast tumors of PBX1-dependent genes unique to either responsive or resistant cells cannot discriminate response to ET (SI Appendix, Fig. S7A). However, genes commonly regulated by PBX1 in resistant and responsive cells discriminate the response to ET (SI Appendix, Fig. S7B). The mRNA abundance for most genes dependent on PBX1 for their expression is higher in ET-resistant compared with -responsive cells (Fig. 4B). Taken to- gether, these results suggest that PBX1 gains in activity in ET-re- sistant breast cancer cells increasing the expression of a subset of genes highly expressed in breast tumors that fail to respond to ET.
Considering its role as a pioneer factor in responsive breast cancer cells (7), we performed ChIP-seq assays against PBX1.
This identifies over 25,000 sites in LTED and MCF7 cells with 6,834 sites shared (SI Appendix, Fig. S7C). DNA-recognition motif analysis reveals enrichment for the PKNOX1 motif in PBX1 bound sites specific to resistant LTED cells proximal (±20 kb from the transcription start site) to the 153 PBX1-dependent genes common to responsive and resistant cells (Fig. 4C). The same analysis identifies the AP-1 motif enrichment in the PBX1- bound sites specific to responsive MCF7 cells near these same genes (Fig. 4C). Heterodimerizing homeodomain protein part-
ners, such as PKNOX1, guide PBX1 binding to the chromatin (68). PKNOX1 and components of the AP-1 complex (FOSL2, FOS, JUN, and JUND) are, respectively, expressed and re- pressed in LTED compared with MCF7 cells (Fig. 4D). Similarly, PKNOX1 is overexpressed in ERα-positive primary breast tumors and in metastatic lesions compared with normal breast (SI Appendix, Fig. S8 A and B). Moreover, PKNOX1 is up- regulated in all ET-resistant cell lines (SI Appendix, Fig. S8C).
Growth assays following PKNOX1 depletion using siRNA transfection in MCF7 and LTED cells demonstrate that it is required for growth of ET-resistant LTED but not MCF7 cells (Fig. 5EandF). Overall, this suggests that PKNOX1 contributes to ETR in breast cancer.
Inhibition of NOTCH Signaling Antagonizes PBX1 Activity and Blocks ETR. NOTCH proteins are activated upon cleavage of their in- tracellular portions by aγ-secretase complex (69). This rate-lim- iting step can be targeted byγ-secretase inhibitors (GSIs) (70, 71).
Treatment with GSIs reduces PBX1 expression and hinders growth of ETR cell lines (Fig. 5AandSI Appendix, Fig. S8D). GSI treatment significantly alters the transcriptional program of LTED cells (Fig. 5B). Genes up-regulated upon GSI treatment (Fig. 5B) are not associated with poor-outcome or high-grade breast tumors gene signatures. In contrast, genes whose expression is decreased
Fig. 5. GSI MRK003 antagonizes ET-resistant breast cancer cells through down-regulation of PBX1. (A) Growth assays in GSI-treated (MRK003 for HA-LTED and MK0572 for all other cell lines) or control-treated (CTRL) ET-resistant cells. (B) Microarray-based expression-profile analysis in LTED cells treated with the MRK003 GSI (Right) or transfected with siPBX1 (Left) are presented compared with their respective controls. All three replicates are shown. Genes whose expression is affected by both the MRK003 GSI and siPBX1 are presented (Center). (C) Oncomine Concepts Map analysis comparing the list of genes whose expression is down-regulated by both the MRK003 GSI and siPBX1 to expression signatures associated with breast tumors with poor outcome.
MEDICALSCIENCESPNASPLUS
distinct expression signatures characterizing patients with poor- outcome and high-grade breast tumors, respectively (SI Appendix, Fig. S9A). This parallels the association between these poor-out- come or high-grade expression signatures from breast tumors and genes whose expression is dependent on PBX1 in LTED cells (SI Appendix, Fig. S9A). In fact, 137 genes dependent on PBX1 for their expression are also repressed upon GSI treatment in LTED cells (MRK003-PBX1 gene list), revealing a strong overlap be- tween these two gene sets (Fig. 5BandSI Appendix, Table S3).
On the other hand, a total of 29 genes repressed by PBX1 are up- regulated upon GSI treatment in LTED cells (Fig. 5B). In- terestingly, there are 120 binding sites for PBX1 near MRK003- PBX1 genes in LTED cells (compared with 50 in MCF7, 2.4-fold increase). Increased binding is not dependent on the total number of sites (>37,000 in MCF7 compared with >25,000 in LTED). However, the PKNOX1 DNA-recognition motif is not
suggests that PKNOX1 alone cannot account for PBX1 binding at these sites.
The MRK003-PBX1 gene list is associated with expression signatures consisting of genes overexpressed in poor-outcome or high-grade breast tumors (Fig. 5C and SI Appendix, Fig. S9B).
These genes are also associated with expression signatures characterizing triple negative and ERBB2-positive breast tumors (SI Appendix, Fig. S9C) and are underexpressed in ERα-positive breast tumors (SI Appendix, Fig. S9D). Taken together, our data demonstrate that GSI treatment can antagonize the expression of genes typical of NOTCH signaling through PBX1 and arrest the growth of ET-resistant breast cancer cells.
NOTCH-PBX1 Signaling Discriminates Response to Endocrine Therapy in ERαPrimary Breast Tumors.A total of 24 genes from the MRK003- PBX1 gene list are common to at least 10% of all poor outcome
Fig. 6. NOTCH-PBX1–driven transcriptional program predicts patient outcomes. (A) Kaplan–Meier analysis for recurrent events using the NOTCH-PBX1 gene signature consisting of PBX1 and the 24 genes whose expression is affected by MRK003 and siPBX1 in LTED cells that are found in at least 10% of all breast cancer poor-outcome expression signatures. Both the 5 and +15 y analysis is presented. (B) Kaplan–Meier analysis for metastatic events for 5 or +15 y analysis is presented as inA. (C) Schematic representation of changes in pathway addiction based on epigenetic reprogramming between ET-responsive and -resistant breast cancer cells.
breast tumor expression signatures (SI Appendix, Table S4). In- terestingly, 22 of these genes are PBX1-dependent in both MCF7 and LTED cells but preferentially expressed in LTED cells. Using a Kaplan–Meier analysis approach against a database of publicly available breast cancer samples (64), we demonstrate that the expression of this core list of 24 genes in combination with PBX1 expression (NOTCH-PBX1 signature) is a significant prognostic factor in ERα-positive breast cancer treated with ET (hazard ratios of 2.4 and 2.5 for recurrence and metastatic-free survival, re- spectively) (Fig. 6 A and B). Significant discrimination is also achieved based on the 5 y following diagnosis (Fig. 6AandB). To exclude that the NOTCH-PBX1 signature simply identifies high- grade, high-proliferative ERα-positive breast cancer, we compared it against the genomic-grade index signature (GGI) (72). NOTCH- PBX1 signature outperformed the GGI signature to discriminate ERαbreast cancer patients and high-grade (grade 3) ERα-positive patients (SI Appendix, Fig. S10AandB). In addition, the NOTCH- PBX1 signature appears to be specific to ERα-positive breast tumors because it could not discriminate outcome in other cancer types (colorectal, ovarian, or gastric cancer) nor in other breast cancer subtypes (SI Appendix, Fig. S11AandB). Altogether, our results demonstrate that the NOTCH-PBX1 signature defined in ET-resistant breast cancer cells has a significant prognostic value in discriminating outcome of breast cancer patients treated with ETs.
Discussion
ETR represents a major challenge in the treatment of ERα-positive breast cancer patients. Numerous events can promote resistance, including overexpression of ERBB2, activation of the PI3K/AKT pathway, high expression of AIB1, AP-1, and the CYP2D6 ge- notype (8, 15, 36, 38, 73–76). The majority of these alternative pathways impinge on ERα, although clinical data suggest that ERαplays a reduced role in resistant breast tumors (77). This highlights the need to further investigate the molecular mecha- nisms that contribute to resistance. Transcriptional profiles have previously helped identify druggable pathways in cancer (78–81), and recent sequencing efforts have identified mutated molecular pathways involved in ETR in breast cancer (77). However, epi- genetic reprogramming of regulatory elements is increasingly being recognized for its contribution to cancer development (82).
Here, we demonstrate that ET-resistant breast cancer cells un- dergo changes in the chromatin landscape that can be captured by epigenomic mapping of enhancer-specific histone mod- ifications and chromatin openness. Using this strategy, we reveal a switch between ERαand NOTCH signaling as breast cancer cells acquire resistance to ET (summarized in Fig. 6CandSI Appendix, Fig. S12). This parallels results focused on the UBE2C locus in ET- resistant prostate cancer where epigenetic reprogramming at enhancers control the expression of the UBE2C gene (8).
In agreement with previous work based on model systems (27, 83–85) or clinical trials (16–18, 86), our results suggest that, in some cases, ERαsignaling is not essential for the growth of breast cancer cells that have acquired ETR. This does not exclude a role for ERα in the initial steps leading to resistance. Indeed, previous in vitro studies conducted with LTED models have reported contrasting results (refs. 32 and 87 vs. refs. 27, 57, 60, 84, and 88). Such dif- ference may be the results of the conditions under which cell lines are originated. ERα is maintained in most ETR cell lines and
∼80% of ETR tumors. Our results suggest that ERαexpression is uncoupled from its transcriptional activity, in agreement with the limited clinical benefits observed in fulvestrant-treated ETR breast cancers (16–18, 86, 89). This needs to be taken into account for prognostic purposes, considering that the assessment of ERα abundance is used as a standard biomarker for ET response.
Epigenetic mapping also reveals the importance of the NOTCH pathway in ET-resistant breast cancer cells. This pathway confers resistance to PI3K inhibitors (90) currently tested against ETR (57).
It also promotes ERBB2-induced growth of breast tumors (91), and
its activity is increased by tamoxifen treatment and in tamoxifen and fulvestrant-resistant MCF7 breast cancer cells (52, 60, 92). Phar- maceutical approaches aimed to interfere with NOTCH signaling (GSI) (29) emerge then as an interesting therapeutic avenue in the context of ETR breast cancer.
Our results also highlight the cooperative nature of NOTCH3, PBX1, and PKNOX1 to promote ETR in breast cancers. In- teraction between these factors was reported previously to pro- mote gene expression (93). Our results show that NOTCH3 and PBX1 control the expression of a large amount of genes associated with ETR in resistant breast cancer cells. Whereas these factors are required for ET-responsive breast cancer cell growth (7, 67), PBX1 potential collaborator PKNOX1 is not. Future investigation will dwell more on the putative interaction between these two homeodomain proteins in relation to ETR breast cancer. How- ever, targeting PBX1 directly or its interaction with the DNA may represent a more viable strategy in the short term (94, 95). Finally, we introduce an expression signature with significant predictive power to stratify breast cancer patients a priori as ET-responsive or -nonresponsive. If validated in a clinical context, this signature could determine predisposition to NOTCH signaling and may be used to assign patients to GSI-ET adjuvant therapy.
Materials and Methods
siRNA Transfection, Ectopic Expression, and Proliferation Studies of Breast Cancer Cells.MCF7 and ET-resistant breast cancer cell lines were maintained in phenol red-free medium (Invitrogen) supplemented with 10% charcoal dextran treated-FBS as described previously (5) before transfection. Cells were transfected with siERα#1 or #2 (Invitrogen), siPBX1 #1 (Darmacon) or siPBX1 #2 (Invitrogen), siNOTCH3 #1 or #2 (Invitrogen), and siPKNOX1 #1 or #2 (Invi- trogen). siRNA against Luciferase was used as a negative control (5). Trans- fection was performed using Lipofectamine 2000 according to the manufacturer’s instructions (Invitrogen). Transfection efficiency was similar between MCF7 and LTED (monitored as percentage of knockdown of ERα, NOTCH3, PBX1, and PKNOX1). PBX1 rescue experiments were conducted by ectopically expressing PBX1 in MCF7 cells. This was achieved by transfecting 0.4 μg of PBX1 (pcDNA3.1/PBX1 or pcDNA6/PBX1) or empty vector (pcDNA3.1 and pcDNA6) in parallel with siRNA against NOTCH using Lip- ofectamine 2000 (Invitrogen). Cell number was assessed 3 d after siRNA- DNA transfection. For GSI treatment, cells were treated with 5 μM of MRK003, MK0572, or DMSO (control). For cell-proliferation assays, cell number was determined every 24 h after transfection by counting live cells (trypan blue staining) on a hemocytometer.
ChIP–Quantitative PCR and Western Blot.ChIP–quantitative (q) PCR was per- formed as described previously (5). Antibodies against PBX1 (Abnova), H3K4me2 (Abcam), and H3K36me3 (Abcam) were used in these assays. Sta- tistically significant differences were established using a Studentttest com- parison for unpaired data vs. an internal negative control. Primer sequences used in this assay are found inSI Appendix, Table S5. Western blots used antibodies against NOTCH1 (Abcam; ab52627), NOTCH2 (Cell Signaling;
D67C8), NOTCH3 (Abcam; ab23426), and NOTCH4 (Millipore; 07-189).
ChIP-Seq.ChIP assays were conducted as described above. Library preparation for next-generation sequencing was performed according to the manu- facturer’s instructions, starting with 5 ng of material (Illumina). Single paired libraries were sequenced using the GAIIx (Illumina): (i) PBX1 (MCF7:∼20 million reads, 95% aligned; LTED: ∼21 million reads, 94% aligned); (ii) H3K4me2 (MCF7:∼10.5 million reads, 97% aligned; LTED:∼2 million reads, 90% aligned); (iii) H3K36me3 (MCF7:∼37 million reads, 70% aligned; LTED:
∼15 million, 92% aligned); and (iv) FAIRE (LTED:∼30 million reads, 92%
aligned). Raw sequences across the various experiments were consistently aligned to the human reference genome using the Bowtie software. Peaks were called using model-based analysis of ChIP-Seq (MACS) (default settings:
significant threshold ofP<10−5). H3K4me2, H3K36me3, and PBX1 data are accessible in the Gene Expression Omnibus (GEO) database (accession no. GSE37323).
FAIRE-qPCR and FAIRE-Seq. FAIRE-qPCR and FAIRE-seq were performed as described previously (6). The MACS peak-calling algorithm was used to call significantly enriched peaks using default settings (significant threshold ofP<
10−5). The data are accessible in the GEO database (accession no. GSE39418).
MEDICALSCIENCESPNASPLUS
calculated using EpiChIP (96). Pathway enrichment was performed using GREAT (61) using the whole genome as background region and“single nearest gene” default settings. Overlap analysis between ERαand the epigenomic maps was calculated using the GSC tool developed by Encyclopedia of DNA Elements (ENCODE) project (40).
Motif Discovery.Cell type-specific sites were identified using the BedTools software (http://code.google.com/p/bedtools). Motif analysis was performed using the“Integrative Analysis–SeqPos motif tool”function available on the Cistrome Web site using default settings and the curated database (97).
Correlation Analysis.Expression correlation between PBX1-dependent genes (LTED, shared, and MCF7) or PBX1/MRK003 datasets vs. clinical outcome/
molecular subtype/pathological staining was performed using the Oncomine Concepts Map tool (www.oncomine.com).
Microarray.RNA samples from siControl- or siPBX1-treated MCF7 and LTED cells, as well as DMSO- or MRK003-treated LTED cells, were hybridized on HT12 human beads array (Illumina). Analyses were performed using BRB-Array Tools Version 3.8.1. Raw intensity data were log2-transformed, median-normalized, andfiltered to remove nondetected spots as determined by Illumina software.
The normalization was performed by computing a gene-by-gene difference between each array and the median (reference) array and subtracting the median difference from the log intensities on that array, so that the gene-by- gene difference between the normalized array and the reference array is zero.
attest for each gene using normalized log intensities. Differentially expressed genes were determined at a significance level ofP<0.05. A four-class ANOVA atP<0.05 was also performed to identify genes expressed differentially across the four groups. Hierarchical clustering was performed by using a Euclidean distance measure to generate heat maps for subsets of significant genes using the open-source software Cluster/Treeview. The data can be accessed in the GEO database under SuperSeries accession no. GSE39418.
Kaplan–Meier Curves.Kaplan–Meier curves were generated using the KMplot software, using a database of public microarray datasets (64) (http://kmplot.com/
analysis). Altogether, results from 3,597 patients were collected; of these, 1,862 were ERα-positive by immunohistochemistry. Kaplan–Meier plots were gener- ated after averaging the probes. Patients were divided according to the median expression value, and only ERα, luminal A, luminal B, endocrine-treated, ERα- negative, or basal subtype patients were included in the analysis, as indicated.
ACKNOWLEDGMENTS.We thank Walter Taylor from the Genomics Core at Dartmouth College for the development of an epigenomic mapper tool and Carol Ringelberg for assistance with analyzing the microarray-based expres- sion profiles. We thank Swenke Bailey and Kinjal Desai for bioinformatic support. We thank Matt Ellis, Kenneth Nephew, and Kathleen Arcaro for sharing ET-resistant cell lines, Francesco Blasi for sharing pcDNA 3.1 PBX1 plasmids, and Till Barkte for reagents. This work was supported by National Cancer Institute Grant R01CA155004 (to M.L.), American Cancer Society Grant IRG-82-003-27 (to M.L.), and the Princess Margaret Foundation.
1. Musgrove EA, Sutherland RL (2009) Biological determinants of endocrine resistance in breast cancer.Nat Rev Cancer9(9):631–643.
2. Tyson JJ, et al. (2011) Dynamic modelling of oestrogen signalling and cell fate in breast cancer cells.Nat Rev Cancer11(7):523–532.
3. Sørlie T, et al. (2001) Gene expression patterns of breast carcinomas distinguish tumor subclasses with clinical implications.Proc Natl Acad Sci USA98(19):10869–10874.
4. van de Vijver MJ, et al. (2002) A gene-expression signature as a predictor of survival in breast cancer.N Engl J Med347(25):1999–2009.
5. Lupien M, et al. (2008) FoxA1 translates epigenetic signatures into enhancer-driven lineage-specific transcription.Cell132(6):958–970.
6. Eeckhoute J, et al. (2009) Cell-type selective chromatin remodeling defines the active subset of FOXA1-bound enhancers.Genome Res19(3):372–380.
7. Magnani L, Ballantyne EB, Zhang X, Lupien M (2011) PBX1 genomic pioneer function drives ERαsignaling underlying progression in breast cancer.PLoS Genet7(11):
e1002368.
8. Wang Q, et al. (2009) Androgen receptor regulates a distinct transcription program in androgen-independent prostate cancer.Cell138(2):245–256.
9. Carroll JS, et al. (2005) Chromosome-wide mapping of estrogen receptor binding reveals long-range regulation requiring the forkhead protein FoxA1.Cell122(1):33–43.
10. Laganière J, et al. (2005) From the Cover: Location analysis of estrogen receptor alpha target promoters reveals that FOXA1 defines a domain of the estrogen response.Proc Natl Acad Sci USA102(33):11651–11656.
11. Holmes KA, et al. (2012) Transducin-like enhancer protein 1 mediates estrogen receptor binding and transcriptional activity in breast cancer cells.Proc Natl Acad Sci USA109(8):2748–2753.
12. Tan SK, et al. (2011) AP-2γ regulates oestrogen receptor-mediated long-range chromatin interaction and gene transcription.EMBO J30(13):2569–2581.
13. Ali S, Buluwela L, Coombes RC (2011) Antiestrogens and their therapeutic applications in breast cancer and other diseases.Annu Rev Med62:217–232.
14. Davies C, et al.; Early Breast Cancer Trialists’Collaborative Group (EBCTCG) (2011) Relevance of breast cancer hormone receptors and other factors to the efficacy of adjuvant tamoxifen: Patient-level meta-analysis of randomised trials. Lancet 378(9793):771–784.
15. Osborne CK, Schiff R (2011) Mechanisms of endocrine resistance in breast cancer.
Annu Rev Med62:233–247.
16. Perey L, et al. (2007) Clinical benefit of fulvestrant in postmenopausal women with advanced breast cancer and primary or acquired resistance to aromatase inhibitors:
Final results of phase II Swiss Group for Clinical Cancer Research Trial (SAKK 21/00).
Ann Oncol18(1):64–69.
17. Di Leo A, et al. (2010) Results of the CONFIRM phase III trial comparing fulvestrant 250 mg with fulvestrant 500 mg in postmenopausal women with estrogen receptor- positive advanced breast cancer.J Clin Oncol28(30):4594–4600.
18. Chia S, et al. (2008) Double-blind, randomized placebo controlled trial of fulvestrant compared with exemestane after prior nonsteroidal aromatase inhibitor therapy in postmenopausal women with hormone receptor-positive, advanced breast cancer:
Results from EFECT.J Clin Oncol26(10):1664–1670.
19. Hajkova P (2010) Epigenetic reprogramming—taking a lesson from the embryo.Curr Opin Cell Biol22(3):342–350.
20. Heintzman ND, et al. (2009) Histone modifications at human enhancers reflect global cell-type-specific gene expression.Nature459(7243):108–112.
21. Heinz S, et al. (2010) Simple combinations of lineage-determining transcription factors prime cis-regulatory elements required for macrophage and B cell identities.
Mol Cell38(4):576–589.
22. Rodríguez-Ubreva J, et al. (2012) Pre-B cell to macrophage transdifferentiation without significant promoter DNA methylation changes.Nucleic Acids Res40(5):
1954–1968.
23. Wang KC, et al. (2011) A long noncoding RNA maintains active chromatin to coordinate homeotic gene expression.Nature472(7341):120–124.
24. Santen RJ, et al. (2008) Adaptation to estradiol deprivation causes up-regulation of growth factor pathways and hypersensitivity to estradiol in breast cancer cells.Adv Exp Med Biol630:19–34.
25. Chan CMW, Martin L-A, Johnston SRD, Ali S, Dowsett M (2002) Molecular changes associated with the acquisition of oestrogen hypersensitivity in MCF-7 breast cancer cells on long-term oestrogen deprivation.J Steroid Biochem Mol Biol81(4-5):333–341.
26. Brodie A, et al. (2005) Model systems: Mechanisms involved in the loss of sensitivity to letrozole.J Steroid Biochem Mol Biol95(1-5):41–48.
27. Aguilar H, et al. (2010) Biological reprogramming in acquired resistance to endocrine therapy of breast cancer.Oncogene29(45):6071–6083.
28. Miller WR, Larionov A (2010) Changes in expression of oestrogen regulated and proliferation genes with neoadjuvant treatment highlight heterogeneity of clinical resistance to the aromatase inhibitor, letrozole.Breast Cancer Res12(4):R52.
29. Haughian JM, et al. (2011) Maintenance of hormone responsiveness in luminal breast cancers by suppression of Notch.Proc Natl Acad Sci USA109(8):2742–2747.
30. Jeng MH, et al. (1998) Estrogen receptor expression and function in long-term estrogen-deprived human breast cancer cells.Endocrinology139(10):4164–4174.
31. Song RX, et al. (2002) Adaptive mechanisms induced by long-term estrogen deprivation in breast cancer cells.Mol Cell Endocrinol193(1-2):29–42.
32. Martin L-A, et al. (2011) An in vitro model showing adaptation to long-term oestrogen deprivation highlights the clinical potential for targeting kinase pathways in combination with aromatase inhibition.Steroids76(8):772–776.
33. Strahl BD, et al. (2002) Set2 is a nucleosomal histone H3-selective methyltransferase that mediates transcriptional repression.Mol Cell Biol22(5):1298–1306.
34. Bannister AJ, et al. (2005) Spatial distribution of di- and tri-methyl lysine 36 of histone H3 at active genes.J Biol Chem280(18):17732–17736.
35. Pokholok DK, et al. (2005) Genome-wide map of nucleosome acetylation and methylation in yeast.Cell122(4):517–527.
36. Lupien M, et al. (2010) Growth factor stimulation induces a distinct ER(alpha) cistrome underlying breast cancer endocrine resistance.Genes Dev24(19):2219–2227.
37. Contesso G, et al. (1987) The importance of histologic grade in long-term prognosis of breast cancer: A study of 1,010 patients, uniformly treated at the Institut Gustave- Roussy.J Clin Oncol5(9):1378–1386.
38. Chen S-T, et al. (2011) Correlation of histologic grade with other clinicopathological parameters, intrinsic subtype, and patients’clinical outcome in Taiwanese women.
Jpn J Clin Oncol41(12):1327–1335.
39. Sabo PJ, et al. (2004) Discovery of functional noncoding elements by digital analysis of chromatin structure.Proc Natl Acad Sci USA101(48):16837–16842.
40. Birney E, et al.; ENCODE Project Consortium; NISC Comparative Sequencing Program;
Baylor College of Medicine Human Genome Sequencing Center; Washington University Genome Sequencing Center; Broad Institute; Children’s Hospital Oakland Research Institute (2007) Identification and analysis of functional elements in 1% of the human genome by the ENCODE pilot project.Nature447(7146):799–816.
41. Lee TI, et al. (2006) Control of developmental regulators by Polycomb in human embryonic stem cells.Cell125(2):301–313.
42. Guenther MG, Levine SS, Boyer LA, Jaenisch R, Young RA (2007) A chromatin landmark and transcription initiation at most promoters in human cells.Cell130(1):77–88.
43. Heintzman ND, et al. (2007) Distinct and predictive chromatin signatures of transcriptional promoters and enhancers in the human genome.Nat Genet39(3):311–318.
44. Visel A, et al. (2009) ChIP-seq accurately predicts tissue-specific activity of enhancers.
Nature457(7231):854–858.
45. Ernst J, Kellis M (2010) Discovery and characterization of chromatin states for systematic annotation of the human genome.Nat Biotechnol28(8):817–825.
46. Ernst J, et al. (2011) Mapping and analysis of chromatin state dynamics in nine human cell types.Nature473(7345):43–49.
47. Rada-Iglesias A, et al. (2011) A unique chromatin signature uncovers early developmental enhancers in humans.Nature470(7333):279–283.
48. Zentner GE, Tesar PJ, Scacheri PC (2011) Epigenetic signatures distinguish multiple classes of enhancers with distinct cellular functions.Genome Res21(8):1273–1283.
49. Giresi PG, Kim J, McDaniell RM, Iyer VR, Lieb JD (2007) FAIRE (Formaldehyde-Assisted Isolation of Regulatory Elements) isolates active regulatory elements from human chromatin.Genome Res17(6):877–885.
50. Lapidus RG, Nass SJ, Davidson NE (1998) The loss of estrogen and progesterone receptor gene expression in human breast cancer.J Mammary Gland Biol Neoplasia 3(1):85–94.
51. Gutierrez MC, et al. (2005) Molecular changes in tamoxifen-resistant breast cancer:
Relationship between estrogen receptor, HER-2, and p38 mitogen-activated protein kinase.J Clin Oncol23(11):2469–2476.
52. He HH, et al. (2012) Differential DNase I hypersensitivity reveals factor-dependent chromatin dynamics.Genome Res22(6):1015–1025.
53. Schmidt D, et al. (2010) A CTCF-independent role for cohesin in tissue-specific transcription.Genome Res20(5):578–588.
54. Hurtado A, Holmes KA, Ross-Innes CS, Schmidt D, Carroll JS (2011) FOXA1 is a key determinant of estrogen receptor function and endocrine response.Nat Genet43(1):
27–33.
55. Ross-Innes CS, et al. (2012) Differential oestrogen receptor binding is associated with clinical outcome in breast cancer.Nature481(7381):389–393.
56. Fasco MJ, Amin A, Pentecost BT, Yang Y, Gierthy JF (2003) Phenotypic changes in MCF-7 cells during prolonged exposure to tamoxifen.Mol Cell Endocrinol206(1-2):
33–47.
57. Sanchez CG, et al. (2011) Preclinical modeling of combined phosphatidylinositol-3- kinase inhibition with endocrine therapy for estrogen receptor-positive breast cancer.
Breast Cancer Res13(2):R21.
58. Bourdeau V, et al. (2008) Mechanisms of primary and secondary estrogen target gene regulation in breast cancer cells.Nucleic Acids Res36(1):76–93.
59. Sengupta S, Sharma CGN, Jordan VC (2010) Estrogen regulation of X-box binding protein-1 and its role in estrogen induced growth of breast and endometrial cancer cells.Horm Mol Biol Clin Investig2(2):235–243.
60. Fan M, et al. (2006) Diverse gene expression and DNA methylation profiles correlate with differential adaptation of breast cancer cells to the antiestrogens tamoxifen and fulvestrant.Cancer Res66(24):11954–11966.
61. McLean CY, et al. (2010) GREAT improves functional interpretation of cis-regulatory regions.Nat Biotechnol28(5):495–501.
62. Kanehisa M, Goto S, Kawashima S, Okuno Y, Hattori M (2004) The KEGG resource for deciphering the genome.Nucleic Acids Res32(Database issue):D277–D280.
63. Bray SJ (2006) Notch signalling: A simple pathway becomes complex.Nat Rev Mol Cell Biol7(9):678–689.
64. Györffy B, et al. (2010) An online survival analysis tool to rapidly assess the effect of 22,277 genes on breast cancer prognosis using microarray data of 1,809 patients.
Breast Cancer Res Treat123(3):725–731.
65. Kiba T, et al. (2008) The reversal of recurrence hazard rate between ER positive and negative breast cancer patients with axillary lymph node dissection (pathological stage I-III) 3 years after surgery.BMC Cancer8:323.
66. Park S, et al. (2012) Characteristics and outcomes according to molecular subtypes of breast cancer as classified by a panel of four biomarkers using immunohistochemistry.
Breast21(1):50–57.
67. Park JT, Shih IeM, Wang T-L (2008) Identification of Pbx1, a potential oncogene, as a Notch3 target gene in ovarian cancer.Cancer Res68(21):8852–8860.
68. Goudet G, Delhalle S, Biemar F, Martial JA, Peers B (1999) Functional and cooperative interactions between the homeodomain PDX1, Pbx, and Prep1 factors on the somatostatin promoter.J Biol Chem274(7):4067–4073.
69. Wolfe MS (2006) The gamma-secretase complex: Membrane-embedded proteolytic ensemble.Biochemistry45(26):7931–7939.
70. Konishi J, et al. (2007) Gamma-secretase inhibitor prevents Notch3 activation and reduces proliferation in human lung cancers.Cancer Res67(17):8051–8057.
71. Watters JW, et al. (2009) De novo discovery of a gamma-secretase inhibitor response signature using a novel in vivo breast tumor model.Cancer Res69(23):8949–8957.
72. Sotiriou C, et al. (2006) Gene expression profiling in breast cancer: Understanding the molecular basis of histologic grade to improve prognosis.J Natl Cancer Inst98(4):
262–272.
73. Hoskins JM, Carey LA, McLeod HL (2009) CYP2D6 and tamoxifen: DNA matters in breast cancer.Nat Rev Cancer9(8):576–586.
74. Schiff R, et al. (2000) Oxidative stress and AP-1 activity in tamoxifen-resistant breast tumors in vivo.J Natl Cancer Inst92(23):1926–1934.
75. Shou J, et al. (2004) Mechanisms of tamoxifen resistance: Increased estrogen receptor- HER2/neu cross-talk in ER/HER2-positive breast cancer.J Natl Cancer Inst96(12):
926–935.
76. Hurtado A, et al. (2008) Regulation of ERBB2 by oestrogen receptor-PAX2 determines response to tamoxifen.Nature456(7222):663–666.
77. Ellis MJ, et al. (2012) Whole-genome analysis informs breast cancer response to aromatase inhibition.Nature486(7403):353–360.
78. Flanagan JM, et al. (2009) Genomics screen in transformed stem cells reveals RNASEH2A, PPAP2C, and ADARB1 as putative anticancer drug targets.Mol Cancer Ther8(1):249–260.
79. Stegmaier K, et al. (2004) Gene expression-based high-throughput screening(GE-HTS) and application to leukemia differentiation.Nat Genet36(3):257–263.
80. van‘t Veer LJ et al. (2002) Gene expression profiling predicts clinical outcome of breast cancer.Nature415(6871):530–536.
81. Sørlie T, et al. (2010) The importance of gene-centring microarray data.Lancet Oncol 11(8):719–720, author reply 720–721.
82. Akhtar-Zaidi B, et al. (2012) Epigenomic enhancer profiling defines a signature of colon cancer.Science336(6082):736–739.
83. Creighton CJ, et al. (2008) Development of resistance to targeted therapies transforms the clinically associated molecular profile subtype of breast tumor xenografts.Cancer Res68(18):7493–7501.
84. Coser KR, et al. (2009) Antiestrogen-resistant subclones of MCF-7 human breast cancer cells are derived from a common monoclonal drug-resistant progenitor.Proc Natl Acad Sci USA106(34):14536–14541.
85. Jelovac D, Macedo L, Goloubeva OG, Handratta V, Brodie AMH (2005) Additive antitumor effect of aromatase inhibitor letrozole and antiestrogen fulvestrant in a postmenopausal breast cancer model.Cancer Res65(12):5439–5444.
86. Howell A, et al. (2004) Comparison of fulvestrant versus tamoxifen for the treatment of advanced breast cancer in postmenopausal women previously untreated with endocrine therapy: A multinational, double-blind, randomized trial.J Clin Oncol 22(9):1605–1613.
87. Miller TW, et al. (2011) ERα-dependent E2F transcription can mediate resistance to estrogen deprivation in human breast cancer.Cancer Discov1(4):338–351.
88. Gozgit JM, et al. (2007) PLD1 is overexpressed in an ER-negative MCF-7 cell line variant and a subset of phospho-Akt-negative breast carcinomas.Br J Cancer97(6):
809–817.
89. Howell A, et al. (2002) Fulvestrant, formerly ICI 182,780, is as effective as anastrozole in postmenopausal women with advanced breast cancer progressing after prior endocrine treatment.J Clin Oncol20(16):3396–3403.
90. Muellner MK, et al. (2011) A chemical-genetic screen reveals a mechanism of resistance to PI3K inhibitors in cancer.Nat Chem Biol7(11):787–793.
91. Efferson CL, et al. (2010) Downregulation of Notch pathway by a gamma-secretase inhibitor attenuates AKT/mammalian target of rapamycin signaling and glucose uptake in an ERBB2 transgenic breast cancer model.Cancer Res70(6):2476–2484.
92. Rizzo P, et al. (2008) Cross-talk between notch and the estrogen receptor in breast cancer suggests novel therapeutic approaches.Cancer Res68(13):5226–5235.
93. Pan L, Glenn ST, Jones CA, Gross KW (2005) Activation of the rat renin promoter by HOXD10.PBX1b.PREP1, Ets-1, and the intracellular domain of notch.J Biol Chem 280(21):20860–20866.
94. Ji T, Lee M, Pruitt SC, Hangauer DG (2004) Privileged scaffolds for blocking protein- protein interactions: 1,4-disubstituted naphthalene antagonists of transcription factor complex HOX-PBX/DNA.Bioorg Med Chem Lett14(15):3875–3879.
95. Aulisa L, Forraz N, McGuckin C, Hartgerink JD (2009) Inhibition of cancer cell proliferation by designed peptide amphiphiles.Acta Biomater5(3):842–853.
96. Hebenstreit D, et al. (2011) EpiChIP: Gene-by-gene quantification of epigenetic modification levels.Nucleic Acids Res39(5):e27.
97. Blankenberg D, et al. (2010) Galaxy: A web-based genome analysis tool for ex- perimentalists.Curr Protoc Mol BiolChapter 19:Unit 19.10.1–19.10.21.
MEDICALSCIENCESPNASPLUS