Gene expression profiling of 30 cancer cell lines predicts resistance towards 11 anticancer drugs at clinically achieved concentrations
Balazs Gy€orffy1,2*, Paweł Surowiak1,3, Olaf Kiesslich4, Carsten Denkert1, Reinhold Sch€afer1,5, Manfred Dietel1and Hermann Lage1
1Institute of Pathology, Charite Campus Mitte, Schumannstr. 20/21, D-10117 Berlin, Germany
2Szentagothai Janos Knowledge Centre, Semmelweis University Budapest, Hungary
3Department of Histology and Embryology, University School of Medicine, ul. Chałubinskiego 6a, 50-356 Wrocław, Poland
4Oligene GmbH, Schumannstr. 20/21, D-10117, Berlin, Germany
5Laboratory of Functional Genomics, Charite Campus Mitte, Schumannstr. 20/21, D-10117 Berlin, Germany
Cancer patients with tumors of similar grading, staging and histo- genesis can have markedly different treatment responses to differ- ent chemotherapy agents. So far, individual markers have failed to correctly predict resistance against anticancer agents. We tested 30 cancer cell lines for sensitivity to 5-fluorouracil, cisplatin, cyclophosphamide, doxorubicin, etoposide, methotrexate, mitomy- cin C, mitoxantrone, paclitaxel, topotecan and vinblastine at drug concentrations that can be systemically achieved in patients. The resistance index was determined to designate the cell lines as sensi- tive or resistant, and then, the subset of resistantvs.sensitive cell lines for each drug was compared. Gene expression signatures for all cell lines were obtained by interrogating Affymetrix U133A arrays. Prediction Analysis of Microarrays was applied for fea- ture selection. An individual prediction profile for the resistance against each chemotherapy agent was constructed, containing 42–
297 genes. The overall accuracy of the predictions in a leave-one- out cross validation was 86%. A list of the top 67 multidrug resist- ance candidate genes that were associated with the resistance against at least 4 anticancer agents was identified. Moreover, the differential expressions of 46 selected genes were also measured by quantitative RT-PCR using a TaqMan micro fluidic card sys- tem. As a single gene can be correlated with resistance against sev- eral agents, associations with resistance were detected all together for 76 genes and resistance phenotypes, respectively. This study focuses on the resistance at the in vivo concentrations, making future clinical cancer response prediction feasible. The TaqMan- validated gene expression patterns provide new gene candidates for multidrug resistance. Supplementary material for this article can be found on theInternational Journal of Cancer website at http://www.interscience.wiley.com/jpages/0020-7136/suppmat.
' 2005 Wiley-Liss, Inc.
Key words: cancer chemoresistance; gene expression; microarrays;
multidrug resistance
The major cause of failure of successful cancer treatment is resistance to currently available antineoplastic agents. Resistance can occur to individual anticancer drugs or more broadly to multi- ple drugs with different chemical structures and different mecha- nisms of action. This latter form of drug resistance is commonly designated as multidrug resistance (MDR). Many different mecha- nisms of MDR have been identified. These mechanisms include reduced cellular drug accumulation mediated by enhanced drug extrusion activity by members of the family of adenosine triphos- phate-binding cassette (ABC)-transporters, e.g. MDR1/P-glyco- protein (P-gp), modulations of apoptotic pathways, alterations in cell cycle checkpoints, repair of damaged cellular targets, and var- ious more or less well-characterized mechanisms.1 In particular cancers, these mechanisms may act simultaneously and may influ- ence each other, so that clinical MDR is a complex multifactorial problem.
From the clinician’s point of view, the aim of drug resistance research is to improve treatment outcome by devising strategies that are able to circumvent primary drug resistance or to prevent the development of secondary antineoplastic drug resistance.
Moreover, the detailed knowledge about the drug resistance status of a given patient with cancer can provide the basis for an individ-
ual patient-tailored chemotherapy regiment in the future. To achieve this aim, an exact prediction of the resistance status of a tumor patient is necessary.
Although different MDR mechanisms have been associated with poor treatment outcome in particular cancers,2 the break- through in prediction of drug resistance for cancer treatment is missing. Neither the clinical use of drug resistance reversal agents, e.g.ABC-transporter inhibitors, nor an individual treatment proto- col led to significant benefits for the cancer patients. The reasons for these failures are complex. So far, different clinical trials using MDR reversing agents were performed without a pretherapeutic detection of the drug resistance status.3If a specific MDR factor is not active in the drug-resistant tumor, a specific inhibitor targeting this factor will not work. Another important problem arises from the fact, that the diagnosis of the MDR status is not standardized.
For example, the immunohistochemical detection of MDR1/P-gp depends on various parameters, such as different antibodies with different specificity and cross-reactions, difficulties in using for- malin-fixed tumor tissue and differences in fixation techniques, problems in the quantitation of the MDR1/P-gp expression levels and heterogeneous staining pattern throughout tumor sections.
Moreover, there is no diagnostic consensus on defining MDR1/P- gp positivity in case of preferentially cytoplasmic rather than membrane staining.4 Additionally, an approach that measures a single feature to predict response is generally not suitable to iden- tify alternative treatment options.
Since different studies demonstrated that gene expression pro- files of cancer cell lines5,6as well as primary neoplasms7,8could predict the response to a defined anticancer drug treatment regime, DNA array technology for mRNA expression profiling offers new approaches for solving the diagnostic problem. However, up to date, the majority of studies investigating cancer specimens by DNA microarrays have concentrated on the classification of tumor subtypes and patient prognosis rather than on drug response.9–11 Clinical specimens were investigated on drug resistance in esopha- geal tumor.12Another study13performed in colon cell lines inves- tigated the correlation of response to 5-fluorouracil and campto- thecin and their expression patterns. As these studies focused on a single cancer entity combined with a limited set of treatment, their prediction profile is not applicable for other cancer entities. A dif- ferent approach has been applied in a study investigating the resistance pattern of human cancer xenografts implanted into nude mice.14
Grant sponsor: Marie Curie fellowship from the European Union and the National Office for Research and Technology, Hungary; Grant number:
HPMD-CT-2000-00001; Grant sponsor: Oligene GmbH.
*Correspondence to: Institute of Pathology, Charite Campus Mitte, Schumannstr. 20/21, D-10117 Berlin. Fax:149-30-450-536-909.
E-mail: zsalab2@yahoo.com
Received 23 February 2005; Accepted after revision 30 June 2005 DOI 10.1002/ijc.21570
Published online 10 October 2005 in Wiley InterScience (www.interscience.
wiley.com).
Int. J. Cancer:118,1699–1712 (2006) ' 2005 Wiley-Liss, Inc.
Publication of the International Union Against Cancer
To obtain predictors for a variety of commonly used drugs for cancer treatment, we have analyzed expression profiles of 30 human cancer cell lines. Since it is generally accepted that most drug resistance mechanisms evolve similarly in tumor cells of dif- ferent histogenesis, e.g., P-gp overexpression in colon cancer, renal cancer and lung cancer and even in sarcomas, we examined cell lines of different origin. This helps to determine the most sig- nificant genetic alterations. Molecular signatures of the cell lines were correlated with the resistance status to 11 anticancer agents at clinically relevant concentrations.
Material and methods Cell lines and cell culture
In our study, we used 30 human cancer cell lines (see Fig. 2).
The cells were cultured in Leibovitz L-15 medium (Bio Whittaker, Walkersville, MD, USA) supplemented by 10% fetal calf serum (Gibco BRL, Grand Island NY, USA), 1 mM L-glutamine, 80 IE/l insulin, 2.5 mg/l transferrin, 1 g/l glucose, 1.1 g/l NaHCO3, 1%
minimal essential vitamins and 20,000 kIE/l trasylol in a humified atmosphere in 5% CO2at 37°C. Prior to resistance testing,Myco- plasmatests were performed using the Venor Mp kit, according to the manufacturer’s instructions (Minerva Biolabs GmbH, Berlin, Germany).
Resistance tests
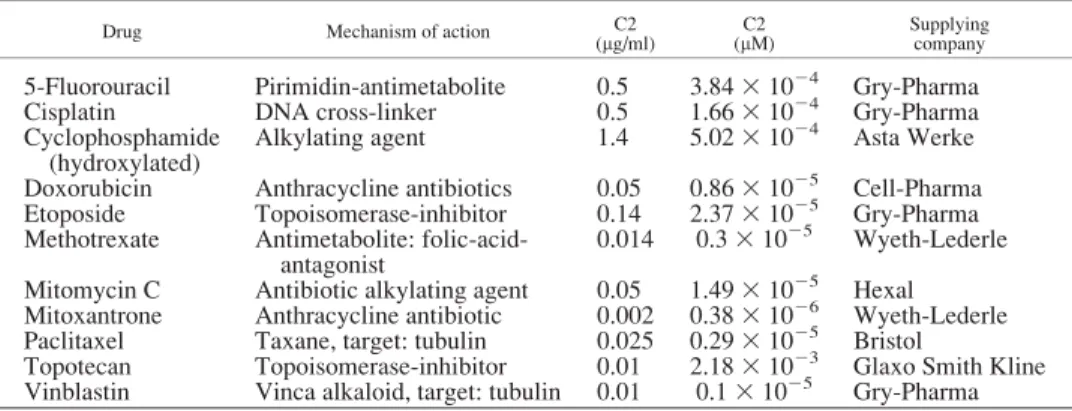
Drugs were used in their commercially available form (except cyclophosphamide, which was used in its activated form). Each drug was applied to the cells in 3 concentrations (C1, C2, C3).
C15 1021 3 C2 and C3 5 10 3 C2. Concentration C2 was deduced from levels assessed to be clinically achievable in tumor tissue,15as discussed previously16(Table I).
In each experiment, 500 cells/microtiter dish were seeded onto 96-well plates. After 2 days, precontrol cells were fixed and stained using sulforhodamine B (SRB).17At the same time, tripli- cate cultures were prepared with all 11 studied drugs at C1, C2 and C3 concentrations. After 4 days, incubation was terminated by replacing the medium with 10% trichloroacetic acid, followed by incubation at 4°C for 1 hr. Subsequently, the plates were washed 5 times with water and stained by adding 100 ll 0.4% SRB (Sigma, St. Louis, MO, USA) in 1% acetic acid for 10 min at room temperature. Washing the plates 5 times with 1% acetic acid elim- inated unbound dye. After air-drying and resolubilization of the protein-bound dye in 10 mM Tris-HCl (pH 8.0), absorbance was read at 562 nm in an Elisa-Reader (EL 340 Microplate Bio Kinetics Reader, BIO-TEK Instruments, Winooski, VT, USA).
The measurements were performed in triplicates in 3 independent experiments. For the calculation of the RI values, the averages of all 9 measurements were used.
The resistance index (RI) was estimated by the formula RI¼ ðnpost=npreÞ3½ðn2npreÞ=ðnpostnpreÞ3100 wherenpreis the medium absorbance value of precontrol at the C2 concentration,npostis the medium absorbance value of control and n2 is the medium absorbance value of stained cells tested with chosen concentration of studied drug (see Fig. 3). At the C2 con- centration of topotecan and mitoxantrone, we didn’t have enough resistant and sensitive cell lines to be able to perform a robust stat- istical calculation; therefore, we have used the C3 concentration for topotecan and the C1 concentration for mitoxantrone. Only cell lines that fulfilled the following quality criteria ofnpost>npreand deviation in cell growth within repetitions<15% were included in the evaluation. Cells exhibiting the lowest third RI results were designated as sensitive, the top third as resistant and the remaining cells were intermediate.
RNA isolation
RNA was isolated from 1 3 107cells in logarithmic growth phase, using the Qiagen Rneasy Mini Kit, following the manufac- turer’s protocol (Qiagen GmbH, Hilden, Germany). The total iso- lated RNA was quantified by UV-spectroscopy and its quality was checked by analysis on a LabChip (BioAnalyzer, AGILENT Technologies, Santa Clara, CA). Samples were stored at280°C until RNA hybridization.
RNA preparation
cDNA was synthesized from 5lg total RNA, starting with the annealing to 5 pmol/ll T7-(dT)24 primer (HPLC purified, MWG- Biotech, Ebersberg, Germany) at 70°C for 10 min. Reverse tran- scription, second-strand synthesis and cleanup of double-stranded cDNA were performed according to the Affymetrix protocols.
Synthesis of biotin-labeled cRNA was performed using the BioAr- ray High Yield RNA Transcription kit (Enzo Diagnostics, Farm- ingdale, NY). cRNA concentration was determined by UV-spec- troscopy and the distribution of cRNA fragment sizes was checked by analyzing the samples on a LabChip (BioAnalyzer).
Hybridization protocol
The fragmented cRNA was hybridized to the HGU133 array (Affymetrix, Santa Clara, CA) at 45°C in a hybridization oven for 16 hr. Subsequent washing and staining of the arrays were per- formed using the GeneChip fluidics station protocol EukGE-WS2.
Finally, probe arrays were scanned using the GeneChip System confocal scanner (Hewlett-Packard, Santa Clara, CA).
TaqMan quantitative gene expression measurement
To validate the results obtained by the Affymetrix HGU133 chips, we have performed TaqMan verification for expression of 46 selected genes in all 30 cell lines, using an Applied Biosystems 7900HT Micro Fluidic Card System. The measurements were per-
TABLE I –DRUGS USED TO ESTABLISH RESISTANCE PATTERNS OF CELL LINES AND THE CLINICALLY AVAILABLE DRUG CONCENTRATIONS IN THE TUMOURS (C2)
Drug Mechanism of action C2
(lg/ml) C2
(lM) Supplying
company
5-Fluorouracil Pirimidin-antimetabolite 0.5 3.8431024 Gry-Pharma
Cisplatin DNA cross-linker 0.5 1.6631024 Gry-Pharma
Cyclophosphamide (hydroxylated)
Alkylating agent 1.4 5.0231024 Asta Werke Doxorubicin Anthracycline antibiotics 0.05 0.8631025 Cell-Pharma Etoposide Topoisomerase-inhibitor 0.14 2.3731025 Gry-Pharma Methotrexate Antimetabolite: folic-acid-
antagonist
0.014 0.331025 Wyeth-Lederle Mitomycin C Antibiotic alkylating agent 0.05 1.4931025 Hexal Mitoxantrone Anthracycline antibiotic 0.002 0.3831026 Wyeth-Lederle Paclitaxel Taxane, target: tubulin 0.025 0.2931025 Bristol
Topotecan Topoisomerase-inhibitor 0.01 2.1831023 Glaxo Smith Kline Vinblastin Vinca alkaloid, target: tubulin 0.01 0.131025 Gry-Pharma
1700 GY€ORFFYET AL.
formed using an ABI PRISM17900HT Sequence Detection Sys- tem as described in the products User Guide (http://www.applied- biosystems.com, CA, USA). For data analysis, the SDS 2.2 soft- ware was used. The extracted delta Ct values (which represent the expression normalized to the ribosomal 18S expression) were grouped according to the resistance pattern of the cell lines. Then, the Student’st-test was performed to compare the expression val- ues in the resistant cell lines to the sensitive cell lines.
Statistical analysis of microarray data
Quality control analyses were performed according to the sug- gestions of The Tumor Analysis Best Practices Working Group.18 Scanned images with artifacts were excluded, and only arrays showing a percentage of present calls>25% and ratio of the 30–50 glyceraldehyde 3-phosphate dehydrogenease (GAPDH 30/50) <3 were considered. According to the above-mentioned recommenda- tions, we have applied following normalization methods: variance stabilization normalization (VSN),19MAS 5.0 [www.affymetrix.- com], and RMA.20 Further data analysis and interpretation has been carried out with all of these pre-processing methods to yield the best comparison and normalization properties across all meas- urements.
We have arranged the complete dataset consisting of 30 expres- sion profile measurements into 2 classes, according to the resist- ance properties of the cell lines. Intermediate cell lines were excluded. This selection procedure resulted in 11 datasets, which were treated as autonomous classification tasks. To obtain charac- teristic gene signatures with high predictive power, we have applied the following feature selection methods: multivariate sta- tistics, shrunken centroids (PAM)21and local shrinkage (SAM).22 Notably, the best and most robust predictive gene list was extracted with the use of PAM by reiterating the procedure on the training-dataset up to 100 times and by selecting the optimal threshold with the smallest cross-validation error.
The dataset was randomly divided into training- and test data- sets before the feature selection process was performed (Fig. 1a).
The predictive marker sets were optimized during the reiterative process only on the basis of the training-datasets and were applied to the test set classes thereafter. Since the test datasets are not
included in the derivation of the markers, the true error rates can be estimated.23The splitting algorithm has been used not only to create a new subset of features (genes) for every training-dataset, but also to investigate the frequency of occurrence of the genes, which were selected in most tests by each single feature selection process. The emerging gene ranking allows the estimation of the heterogeneity and reliability of the class prediction. The statistical significance of every gene-set is tested by randomizing the class assignment in the training dataset and the test data class prediction based on this assignment subsequently.24The best feature set,i.e., the amount of features with the most minimal error and sufficient high significance, can be obtained using this method.
The predictive accuracy of the gene sets was tested by k-fold- cross-validation-procedures and bootstrapping algorithm with sup- port vector machines (SVM).25The specificity and sensitivity of the classification based on given features was computed as described previously.26
Results RI assays
Prior to microarray analysis, we measured drug resistance of 30 cancer cell lines, as described in Material and Methods (Fig. 2).
We have included the representation of drugs for the major anti- cancer agent classes: alkylating agents (cyclophosphamide, mito- mycin C), antimetabolite (5-fluorouracil, methotrexate), antibiot- ics (doxorubicin, mitoxantrone), topoismorase inhibitors (etopo- side, topotecan), vinca alkaloid (vinblastine), taxane (paclitaxel) and the platinum derivative cisplatin. We have summarized the results of the resistance tests in Figure 2. As a representative example, the RI values of the MDA231 mammary carcinoma can- cer cell line at 3 different drug concentrations are depicted in detail (Fig. 3).
Identification of discriminatory genes
To identify discriminatory genes, we divided the gene expres- sion profiles obtained for all cell lines into 2 sets associated with the resistance or sensitivity towards each drug as defined by RI.
The complete microarray dataset is shown as supplementary infor- FIGURE1– Overview of the approach for establishing feature lists for drug sensitivity prediction (a) and the correlation between significance of prediction and number of features used for the prediction for Mitoxantron (b). The upper line represents the relative error obtained by random feature selection.
1701
PREDICTION SIGNATURE FOR ELEVEN ANTICANCER AGENTS
FIGURE 2– Resistance patterns of studied cell lines. Drugs clinically applied to the spe- cific type of cancer are boxed. ATCC names are shown, with the exceptions marked with reference. ca, cancer; HCC, hepatocellular car- cinoma; R, resistant; S, sensitive; M, inter- mediate;*, kindly provided by Prof. I. Petersen, Inst. Pathology, Charite, Berlin.
FIGURE3– Results of the resist- ance tests for the cell line MDA- 231. Each drug was applied in 3 concentrations (C1, C2, C3), where C1510213C2 and C35 10 3 C2. Concentration C2 is equivalent to drug levels achiev- able systemically in patients. The RI was estimated by the formula:
RI 5 (npost/npre) 3 [(n22npre)/
(npost2npre)3100], wherenpre is the medium absorbance value of precontrol, npost is the medium absorbance value of control,n2is the medium absorbance value of stained cells tested with the chosen concentration.
TABLEII–GENESASSOCIATEDWITHRESISTANCEAGAINSTATLEAST4ANTICANCERAGENTS.THE11COLUMNSONTHERIGHTINDICATEINWHICHRESISTANCEPATTERNSTHEGENEISINVOLVED ProbesetIDGenesymbolGenenameMolecularfunctionas listedingeneontologyNumber ofdrugs
Involvedinresistancepatternassociatedwith VinblastineTopotecanPaclitaxelMethotrexateMitoxantroneMitomycin CEtoposideDoxorubicinCyclophosphamideCisplatin5-Fluorouracil 202342_s_atTRIM2Tripartitemotif- containing2Ubiquitin-protein ligase/zincion binding
8XXXXXXXX 206632_s_atAPOBEC3BApolipoproteinB mRNAediting enzyme
–7XXXXXXX 202076_atBIRC2BaculoviralIAP repeat-containing2Ubiquitin-protein ligase/signal transducer/zinc ionbinding 6XXXXXX 209277_atTFPI2Tissuefactorpathway inhibitor2Serine-typeendopeptidase inhibitor/protease inhibitor
6XXXXXX 212771_atC10orf38Chromosome10open readingframe38–6XXXXXX 201034_atADD3Adducin3(gamma)Structuralconstituent ofcytoskeleton5XXXXX 201163_s_atIGFBP7Insulin-likegrowth factorbinding protein7
Insulin-likegrowth factorbinding5XXXXX 201858_s_atPRG1Proteoglycan1, secretorygranule–5XXXXX 202628_s_atSERPINE1Serineproteinase inhibitor,cladeE, member1 Serine-typeendopeptidase inhibitor/plasminogen activator
5XXXXX 202887_s_atDDIT4DNA-damage- inducibletranscript4–5XXXXX 203880_atCOX17COX17homologCopperionbinding/copper chaperone/proteinbinding5XXXXX 204614_atSERPINB2Serineproteinase inhibitor,cladeB, member2
Serine-typeendopeptidase inhibitor/plasminogen activator
5XXXXX 204682_atLTBP2LatentTGFbeta bindingprotein2Calciumionbinding/growth factorbinding5XXXXX 205083_atAOX1Aldehydeoxidase1Aldehydeoxidase/xanthine dehydrogenase5XXXXX 205130_atRAGERenaltumorantigen–5XXXXX 208647_atFDFT1Farnesyl-diphosphate farnesyltransferase1Magnesiumionbinding5XXXXX 209014_atMAGED1Melanomaantigen, familyD,1–5XXXXX 209278_s_atTFPI2Tissuefactorpathway inhibitor2Serine-typeendopeptidase inhibitor5XXXXX 211538_s_at–––5XXXXX 213258_atTFPITissuefactor pathwayinhibitorSerine-typeendopeptidase inhibitor5XXXXX 214247_s_atDKK3Dickkopfhomolog3 (Xenopuslaevis)–5XXXXX 221922_atGPSM2G-proteinsignaling modulator2GTPaseactivator5XXXXX 200771_atLAMC1Laminin,gamma1 (formerlyLAMB2)Structuralmolecule/protein binding4XXXX 201368_atZFP36L2Zincfingerprotein36, C3Htype-like2Transcriptionfactor4XXXX
TABLEII–GENESASSOCIATEDWITHRESISTANCEAGAINSTATLEAST4ANTICANCERAGENTS.THE11COLUMNSONTHERIGHTINDICATEINWHICHRESISTANCEPATTERNSTHEGENEISINVOLVED (CONTINUED) ProbesetIDGenesymbolGenenameMolecularfunctionas listedingeneontologyNumber ofdrugs
Involvedinresistancepatternassociatedwith VinblastineTopotecanPaclitaxelMethotrexateMitoxantroneMitomycin CEtoposideDoxorubicinCyclophosphamideCisplatin5-Fluorouracil 201387_s_atUCHL1Ubiquitincarboxyl-terminal esteraseL1Cysteine-type endopeptidase/ubiquitin thiolesterase
4XXXX 201432_atCATCatalaseCatalase/oxidoreductase4XXXX 201752_s_atADD3Adducin3(gamma)Structuralconstituentof cytoskeleton/calmodulin binding
4XXXX 201859_atPRG1Proteoglycan1, secretorygranule–4XXXX 202016_atMESTMesodermspecific transcripthomologCatalytic4XXXX 202364_atMXI1MAXinteractor1DNAbinding/transcription corepressor4XXXX 202454_s_atERBB3Erythroblastic leukemiaviral oncogenehomolog3
Receptor/epidermal growthfactor receptor/ATPbinding 4XXXX 202627_s_atSERPINE1Serineproteinaseinhibitor, cladeE,member1Serine-typeendopeptidase inhibitor/plasminogen activator
4XXXX 202705_atCCNB2CyclinB2–4XXXX 202712_s_atCKMT1Creatinekinase, mitochondrial1 (ubiquitous)
Creatinekinase/transferase4XXXX 203258_atDRAP1DR1-associatedprotein1Transcriptionfactor/ transcriptioncorepressor4XXXX 203625_x_atSKP2S-phasekinase-associated protein2(p45)–4XXXX 204014_atDUSP4Dualspecificity phosphatase4Proteintyrosine/threonine andMAPkinase phosphatase 4XXXX 204252_atCDK2Cyclin-dependent kinase2Proteinserine/threonine andcyclin-dependent proteinkinase
4XXXX 204351_atS100PS100calcium bindingproteinPCalciumionbinding/protein binding4XXXX 204475_atMMP1Matrixmetalloproteinase1Interstitialcollagenase/ calciumandzinc ionbinding
4XXXX 204602_atDKK1Dickkopfhomolog1 (Xenopuslaevis)Signaltransducer/growth factor4XXXX 204675_atSRD5A1Steroid-5a-reductase, alphapolypeptide13-Oxo-5a-steroid 4-dehydrogenase4XXXX 204975_atEMP2Epithelialmembrane protein2–4XXXX 205005_s_atNMT2N-Myristoyltransferase2GlycylpeptideN- tetradecanoyltransferase/ acyltransferase 4XXXX 205006_s_atNMT2N-Myristoyltransferase2GlycylpeptideN- tetradecanoyltransferase/ acyltransferase
4XXXX 205229_s_atNMT2CoagulationfactorC homolog,cochlin–4XXXX
TABLEII–GENESASSOCIATEDWITHRESISTANCEAGAINSTATLEAST4ANTICANCERAGENTS.THE11COLUMNSONTHERIGHTINDICATEINWHICHRESISTANCEPATTERNSTHEGENEISINVOLVED (CONTINUED) ProbesetIDGenesymbolGenenameMolecularfunctionas listedingeneontologyNumber ofdrugs
Involvedinresistancepatternassociatedwith VinblastineTopotecanPaclitaxelMethotrexateMitoxantroneMitomycin CEtoposideDoxorubicinCyclophosphamideCisplatin5-Fluorouracil 205882_x_atADD3Adducin3(gamma)Structuralconstituentof cytoskeleton/ calmodulinbinding
4XXXX 206085_s_atCTHCystathionase (cystathionine gamma-lyase)
Cystathioninegamma- lyase/lyase4XXXX 206302_s_atNUDT4Nudix-typemotif4Diphosphoinositol- polyphosphate diphosphatase
4XXXX 208025_s_atHMGA2Highmobility groupAT-hook2ATDNAbinding4XXXX 209377_s_atHMGN3Highmobility groupnucleosomal bindingdomain3
DNAbinding/thyroid hormonereceptor binding
4XXXX 209676_atTFPITissuefactorpathway inhibitorSerine-typeendopeptidase inhibitor4XXXX 209942_x_atMAGEA6Melanomaantigen, familyA,6–4XXXX 210105_s_atFYNFYNoncogenerelatedto SRC,FGR,YESProtein-tyrosinekinase4XXXX 210517_s_atAKAP12Akinase(PRKA) anchorprotein(gravin)12Proteinbinding/protein kinaseAbinding4XXXX 210664_s_atTFPITissuefactorpathway inhibitorSerine-typeendopeptidase inhibitor4XXXX 210950_s_atFDFT1Farnesyl-diphosphate farnesyltransferase1Magnesiumionbinding4XXXX 211042_x_atMCAMMelanomacell adhesionmoleculeProteinbinding4XXXX 212281_s_atMAC30HypotheticalproteinMAC30–4XXXX 212282_atMAC30HypotheticalproteinMAC30–4XXXX 212807_s_at–––4XXXX 214974_x_atCXCL5Chemokine(C-X-Cmotif) ligand5Chemokine4XXXX 216033_s_atFYNFYNoncogenerelatedto SRC,FGR,YESProtein-tyrosinekinase4XXXX 217127_atCTHCystathionase(cystathionine gamma-lyase)Cystathionine gamma-lyase/lyase4XXXX 217967_s_atC1orf24Chromosome1open readingframe24–4XXXX 218397_atFANCLFanconianemia, complementationgroupLLigase4XXXX 219622_atRAB20RAB20,member RASoncogenefamilyGTPbinding4XXXX
mation (raw Affymetrix.CEL files and normalized gene expression values in Supplemental Table 1. Supplementary material for this article can be found on theInternational Journal of Cancerwebsite at http://www.interscience.wiley.com/jpages/0020-7136/suppmat.).
Genes that were associated with the resistance after at least one normalization procedure were included in the list. Resistance to 5- fluorouracil was correlated with 237 genes, to cisplatin with 230 genes, to cyclophosphamide with 42 genes, to doxorubicin with 253 genes, to etoposide with 202 genes, to methotrexate with 198 genes, to mitomycin C with 190 genes, to mitoxantrone with 197 genes, to paclitaxel with 139 genes, to topotecan with 297 genes and to vinblastine with 217 genes, respectively. The complete list of genes and its relation to each agent is presented in the Supple- mental Table 2. The list of the common genes associated with the resistance toward at least 4 different agents is presented on Table II. Important multidrug-resistance-associated functional groups could be the TGF beta pathway (SERPINE1, LTBP2) and various zinc-ion binding proteins (BIRC2, TRIM2 and MMP1). Interest- ingly, 10 of the top genes were present with several probes (SER- PINE1, NMT2, TFPI2, CTH, FDFT1, FYN, MAC30, PRG1 twice and the ADD3 three times); this also proves the robustness of the
performed analysis. One of the top candidate genes is TFPI (tissue factor pathway inhibitor), which is present all together by 5 clones.
An example for the correlation between significance and the num- ber of features used for the prediction, including the relative error obtained by random feature selection, is presented in Figure 1b.
We have validated the prediction accuracy for the investigated cell lines, using a leave-one-out cross validation, the results are depicted in Figure 4. We had correct prediction in 220 cases (86%
of the classifiable RI tests) and false predictions in 36 cases (14%).
Hierarchical clustering
We have clustered the expression profiles of all cell lines, using the complete dataset to detect similarities across the cell lines. The clustering dendrogram shows that the cell lines derived from ova- ries and melanomas were categorized into close branches. How- ever, the cell lines derived from carcinomas of the breast, lung, colon and prostate as well as hepatocellular carcinomas were not clustered into single branches; thus, indicating that those tumors had heterogeneous expression profiles that reflected wider differ- ences in their histological and biological characteristics (Fig. 5a).
FIGURE 4– Prediction of drug resistance for the investigated cell lines. 100 represents maximal resistance and 0 maximal sensitiv- ity. Blue boxes represent correct prediction (n 5 220). Grey represents the measure- ments, where resistance/sensitivity could not be determined during the cell culture experi- ments (n558). Red and green boxes repre- sent false predictions (red, false sensitive;
green, false resistant;n536).
1706 GY€ORFFYET AL.
To visualize and confirm discriminatory expression changes, we have also clustered the selected gene lists for the resistant and sen- sitive samples. As a representative example, the clustering results of genes associated with cisplatin resistance are presented on Fig- ure 5b.
Gene ontology of selected features
We have grouped the selected discriminative genes according to the Kyoto Encyclopedia of Genes and Genomes (KEGG). The analysis was restricted by the availability of annotated genes rep- resented on the U133A GeneChip. The descriptions of the top multidrug resistance candidate genes are included in Table II and in the Supplemental Table 2. We have also mapped the selected features to chromosomes, but we have not observed hotspots, which could suggest chromosomal abnormalizations gained by the cancer cells (data not shown).
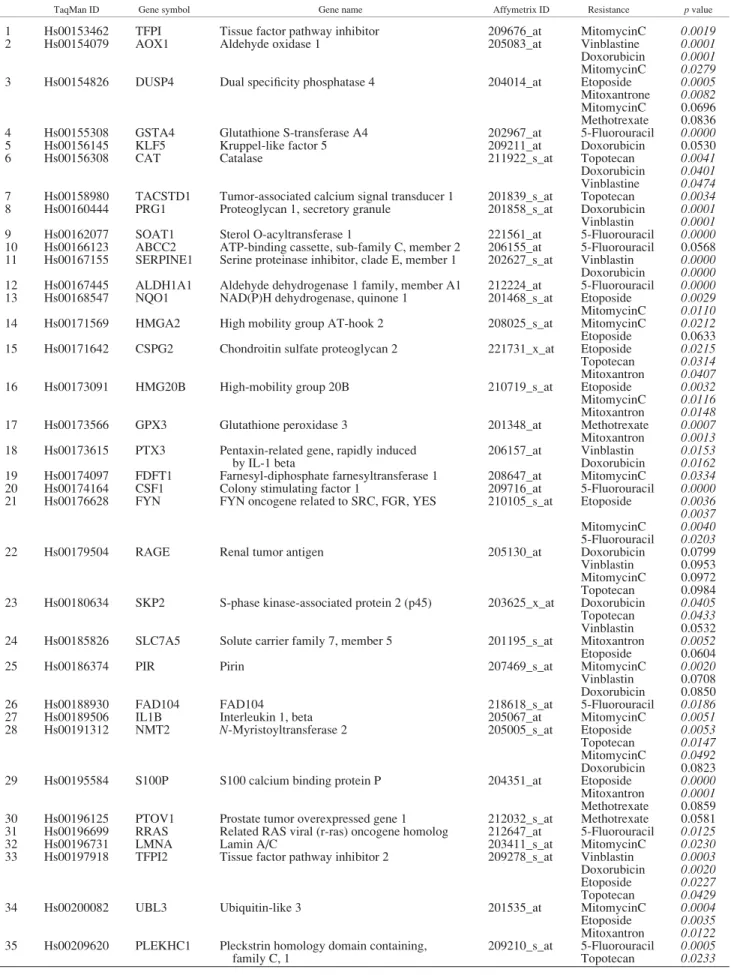
TaqMan validation
TaqMan real-time RT-PCR was performed to confirm the pre- dictive potential for a selected set of 46 genes. Selection criteria for genes were involvement with the resistance against several drugs and the availability of TaqMan probes. The complete results of the TaqMan measurements are presented in Supplemental Table 4. As several of the selected genes were involved in the resistance against more than 1 anticancer agent, altogether 76 pre-
dictive gene-agent pairs could be verified at a significance ofp<
0.05. In Table III, we have summarized the significant prediction properties for the selected genes for the corresponding agents. The expressions of proteoglycan 1, SOAT1, TFPI and CAT as well as the involvement in correlation in the doxorubicin, 5-fluorouracil, mitomycin C and topotecan resistance patterns are depicted as examples in Figure 6.
Discussion
We have compared gene expression profiles of pre-character- ized drug-sensitive and drug-resistant cancer cell lines of different tumor entities. Accepting that the basic mechanisms of drug resist- ance are independent of tumor cell histology, this approach con- tributes to broadly mirror the spectrum of genetic alterations asso- ciated with the ineffectiveness of cytostatic drugs. On this basis, we have identified specific gene expression signatures associated with the preexisting resistance at clinically relevant concentrations of 5-fluorouracil, cisplatin, cyclophosphamide, doxorubicin, eto- poside, methotrexate, mitomycin C, mitoxantrone, paclitaxel, top- otecan and vinblastine.
Further, the use of a set of various cell lines for the construction of our predictor profiles allows a tissue-independent application.
A similar approach has been used in a previous study investigating 9,000 genes in 39 cell lines.27In another study, gene expression FIGURE5– Hierarchical clustering. (a) All cell lines using all genes. (b) Genes associated with Cisplatin resistance. Cell lines withR_ are resistant. Upregulated genes are marked red, downregulated are marked with green. Cell lines with intermediate resistance are excluded.
1707
PREDICTION SIGNATURE FOR ELEVEN ANTICANCER AGENTS
TABLE III –TAQMAN MEASUREMENT FOR 46 GENES
TaqMan ID Gene symbol Gene name Affymetrix ID Resistance pvalue
1 Hs00153462 TFPI Tissue factor pathway inhibitor 209676_at MitomycinC 0.0019
2 Hs00154079 AOX1 Aldehyde oxidase 1 205083_at Vinblastine 0.0001
Doxorubicin 0.0001 MitomycinC 0.0279
3 Hs00154826 DUSP4 Dual specificity phosphatase 4 204014_at Etoposide 0.0005
Mitoxantrone 0.0082 MitomycinC 0.0696 Methotrexate 0.0836
4 Hs00155308 GSTA4 Glutathione S-transferase A4 202967_at 5-Fluorouracil 0.0000
5 Hs00156145 KLF5 Kruppel-like factor 5 209211_at Doxorubicin 0.0530
6 Hs00156308 CAT Catalase 211922_s_at Topotecan 0.0041
Doxorubicin 0.0401 Vinblastine 0.0474 7 Hs00158980 TACSTD1 Tumor-associated calcium signal transducer 1 201839_s_at Topotecan 0.0034 8 Hs00160444 PRG1 Proteoglycan 1, secretory granule 201858_s_at Doxorubicin 0.0001 Vinblastin 0.0001
9 Hs00162077 SOAT1 Sterol O-acyltransferase 1 221561_at 5-Fluorouracil 0.0000
10 Hs00166123 ABCC2 ATP-binding cassette, sub-family C, member 2 206155_at 5-Fluorouracil 0.0568 11 Hs00167155 SERPINE1 Serine proteinase inhibitor, clade E, member 1 202627_s_at Vinblastin 0.0000 Doxorubicin 0.0000 12 Hs00167445 ALDH1A1 Aldehyde dehydrogenase 1 family, member A1 212224_at 5-Fluorouracil 0.0000
13 Hs00168547 NQO1 NAD(P)H dehydrogenase, quinone 1 201468_s_at Etoposide 0.0029
MitomycinC 0.0110
14 Hs00171569 HMGA2 High mobility group AT-hook 2 208025_s_at MitomycinC 0.0212
Etoposide 0.0633 15 Hs00171642 CSPG2 Chondroitin sulfate proteoglycan 2 221731_x_at Etoposide 0.0215 Topotecan 0.0314 Mitoxantron 0.0407
16 Hs00173091 HMG20B High-mobility group 20B 210719_s_at Etoposide 0.0032
MitomycinC 0.0116 Mitoxantron 0.0148
17 Hs00173566 GPX3 Glutathione peroxidase 3 201348_at Methotrexate 0.0007
Mitoxantron 0.0013 18 Hs00173615 PTX3 Pentaxin-related gene, rapidly induced
by IL-1 beta
206157_at Vinblastin 0.0153 Doxorubicin 0.0162 19 Hs00174097 FDFT1 Farnesyl-diphosphate farnesyltransferase 1 208647_at MitomycinC 0.0334
20 Hs00174164 CSF1 Colony stimulating factor 1 209716_at 5-Fluorouracil 0.0000
21 Hs00176628 FYN FYN oncogene related to SRC, FGR, YES 210105_s_at Etoposide 0.0036 0.0037 MitomycinC 0.0040 5-Fluorouracil 0.0203
22 Hs00179504 RAGE Renal tumor antigen 205130_at Doxorubicin 0.0799
Vinblastin 0.0953 MitomycinC 0.0972 Topotecan 0.0984 23 Hs00180634 SKP2 S-phase kinase-associated protein 2 (p45) 203625_x_at Doxorubicin 0.0405 Topotecan 0.0433 Vinblastin 0.0532 24 Hs00185826 SLC7A5 Solute carrier family 7, member 5 201195_s_at Mitoxantron 0.0052 Etoposide 0.0604
25 Hs00186374 PIR Pirin 207469_s_at MitomycinC 0.0020
Vinblastin 0.0708 Doxorubicin 0.0850
26 Hs00188930 FAD104 FAD104 218618_s_at 5-Fluorouracil 0.0186
27 Hs00189506 IL1B Interleukin 1, beta 205067_at MitomycinC 0.0051
28 Hs00191312 NMT2 N-Myristoyltransferase 2 205005_s_at Etoposide 0.0053
Topotecan 0.0147 MitomycinC 0.0492 Doxorubicin 0.0823
29 Hs00195584 S100P S100 calcium binding protein P 204351_at Etoposide 0.0000
Mitoxantron 0.0001 Methotrexate 0.0859 30 Hs00196125 PTOV1 Prostate tumor overexpressed gene 1 212032_s_at Methotrexate 0.0581 31 Hs00196699 RRAS Related RAS viral (r-ras) oncogene homolog 212647_at 5-Fluorouracil 0.0125
32 Hs00196731 LMNA Lamin A/C 203411_s_at MitomycinC 0.0230
33 Hs00197918 TFPI2 Tissue factor pathway inhibitor 2 209278_s_at Vinblastin 0.0003 Doxorubicin 0.0020 Etoposide 0.0227 Topotecan 0.0429
34 Hs00200082 UBL3 Ubiquitin-like 3 201535_at MitomycinC 0.0004
Etoposide 0.0035 Mitoxantron 0.0122 35 Hs00209620 PLEKHC1 Pleckstrin homology domain containing,
family C, 1
209210_s_at 5-Fluorouracil 0.0005 Topotecan 0.0233
1708 GY€ORFFYET AL.
profiling has been used for identifying factors related to the resist- ance toward selected cytotoxic drugs in 60 cell lines.5,28 The major difference and improvement from the oncologist’s point of view in our study compared to those investigations is the applica- tion of anticancer drugs at concentrations clinically relevant in tumor tissues. In other studies, the actual drug concentration for defining a therapeutic response as opposed to the resistance was chosen to represent the GI50 value, which is equivalent to drug levels achieving 50% growth inhibition. As in clinical practice, a very low level of drug resistance,i.e.2-fold, can prevent a suc- cessful chemotherapeutic treatment of cancer patients, the GI50
drug concentration is usually artificial and less relevant. To include the effects of pharmacokinetics (e.g., bioavailability, dilu- tion volume, clearance, mean residence time etc.), we decided to measure the resistance at a pre-defined concentration, which is equivalent to the clinically achievable concentration as discussed previously.16 Furthermore, additionally to the selection of clini- cally achievable concentrations, chemotherapeutic antineoplastic agents that are commonly included in clinical therapy protocols as a stand-alone agent or in at least one combination protocol were chosen (Table I).
To overcome the risk of overfitting the prediction model to a limited data set, we splitted the available expression profiles of cell lines into a test set and a training set. We rotated the data sets and recalculated the list of significant genes for each compound 100 times, and selected genes with high repeated (reproducible) prevalence. The gene list in a leave-one-out cross validation allowed to predict resistance in more than 80% of the tests cor- rectly.
We have found a total of 1,481 genes associated with drug resistance. Out of these genes, 1,033 genes were associated with merely a single anticancer agent, 271 genes with 2 and 110 with 3 anticancer agents. This small overlap among the established gene lists supports the current concept that anticancer drug resistance is a highly complex phenomenon resulting of various interacting molecular mechanisms that can be switched on and off and temporarily being simultaneously active. We also identi- fied 67 multidrug resistance candidate genes associated with resistance toward 4 or more anticancer agents, suggesting that these are correlated with common mechanisms involved in drug response (Fig. 4). Particularly interesting candidate genes were probes present in at least 6 resistance patterns. The list includes the genes encoding tripartite motif-containing 2 (TRIM2), apoli-
poprotein B mRNA editing enzyme (APOBEC3B), baculoviral IAP repeat-containing 2 (BIRC2), tissue factor pathway inhibitor 2 (TFPI2) and chromosome 10 open reading frame 38 (C10orf38). Of these, only BIRC2 has already been associated with tumor resistance: it is upregulated in radioresistant oesopha- geal cancer cell lines.29TFPI is not only the major physiologic inhibitor of the extrinsic coagulation pathway, but its apoptotic, anitangiogenic and antitumor activity has been also described,30 TFPI2 is a suggested new target for the treatment of osteoarthri- tis.31 APOBEC3B is a potent inhibitor of simian immunodefi- ciency virus replication.32However, for a potential prediction of a drug-resistant phenotype in tumor cells by mRNA expression profiling, it is not important whether the alterations in the expression levels of the identified genes are an effect of func- tional involvement in drug resistance or merely the result of co- regulations or other cellular events.
The Affymetrix HGU133 chips contain the well-known resist- ance associated MDR1 (209993_at, 209994_at) and MRP1 (202804_at, 202805_at) genes. Interestingly, the average MDR1 expression levels were more than 4-fold increased when compared to the MRP1 expression levels (normalized; log 2 scale: MDR1, 6.3660.71; MRP1, 8.4760.46). We have measured the highest MDR1 expression in the hepatocellular carcinoma SNU449 cell line, which was found to be resistant against each tested drug. We have measured high MDR1 expression in CX-2, OAW42, Hep3B, A375 and Colo699—these cell lines are resistant against cyclo- phosphamide and methothrexate. High MRP1 expression was detected in SNU475, OVCAR3, SKOV-3 and SKBR cell lines, but its overexpression was not linked to the resistance against any cytotoxic drug. These data supports the role of the ABC transport- ers in drug resistance, but also emphasize the role of additional mechanisms involved in drug resistance.
Since no gene was associated with drug resistance against all of the investigated drugs, the study suggests that a set of univer- sal resistance genes cannot be identified. This finding is in line with results in a previous study investigating gene patterns asso- ciated with resistance against 4 anticancer drugs in acute lym- phoblastic leukemia.8Previously, attempts using single genes for assessing drug sensitivity have seldomly produced conclusive results.33,34Our results support the concept that different mecha- nisms are associated with resistance against different drugs,35 and therefore support the use of combination chemotherapy for cancer treatment.
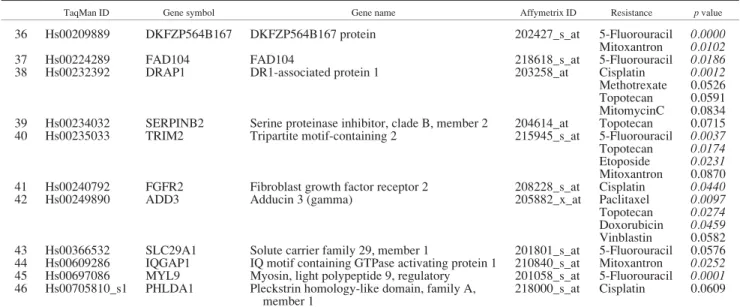
TABLE III –TAQMAN MEASUREMENT FOR 46 GENES (CONTINUED)
TaqMan ID Gene symbol Gene name Affymetrix ID Resistance pvalue
36 Hs00209889 DKFZP564B167 DKFZP564B167 protein 202427_s_at 5-Fluorouracil 0.0000
Mitoxantron 0.0102
37 Hs00224289 FAD104 FAD104 218618_s_at 5-Fluorouracil 0.0186
38 Hs00232392 DRAP1 DR1-associated protein 1 203258_at Cisplatin 0.0012
Methotrexate 0.0526 Topotecan 0.0591 MitomycinC 0.0834 39 Hs00234032 SERPINB2 Serine proteinase inhibitor, clade B, member 2 204614_at Topotecan 0.0715 40 Hs00235033 TRIM2 Tripartite motif-containing 2 215945_s_at 5-Fluorouracil 0.0037 Topotecan 0.0174 Etoposide 0.0231 Mitoxantron 0.0870 41 Hs00240792 FGFR2 Fibroblast growth factor receptor 2 208228_s_at Cisplatin 0.0440
42 Hs00249890 ADD3 Adducin 3 (gamma) 205882_x_at Paclitaxel 0.0097
Topotecan 0.0274 Doxorubicin 0.0459 Vinblastin 0.0582 43 Hs00366532 SLC29A1 Solute carrier family 29, member 1 201801_s_at 5-Fluorouracil 0.0576 44 Hs00609286 IQGAP1 IQ motif containing GTPase activating protein 1 210840_s_at Mitoxantron 0.0252 45 Hs00697086 MYL9 Myosin, light polypeptide 9, regulatory 201058_s_at 5-Fluorouracil 0.0001 46 Hs00705810_s1 PHLDA1 Pleckstrin homology-like domain, family A,
member 1
218000_s_at Cisplatin 0.0609
For those genes, which are correlated with several resistances, each significant association is presented. Significant resistantvs.sensitive pvalues (p<0.05,n576) are marked italic.
1709
PREDICTION SIGNATURE FOR ELEVEN ANTICANCER AGENTS
FIGURE6– TaqMan expression of proteoglycan 1 (a), SOAT1 (b), TFPI (c) and CAT (d) validates the involvement in the doxorubicin, 5-fluorouracil, mitomycin C and topotecan resistance patterns, respectively.R, resistant;S, sensitive cell lines; cell lines with intermediate resistance are excluded.
In a similar study, recently performed on the same microarray platform, Kang et al36identified gene expression patterns related to resistance against 5-fluorouracil, cisplatin and doxorubicin resist- ance, respectively, in 14 human gastric cancer cells. We have com- pared the published set of 250 differentially regulated genes with our prediction profiles. We found only 1 common gene associated with 5-fluorouracil (212614_at), and 2 common genes associated with cisplatin resistance (C6orf37 and DJ971N18.2). We have found a much higher overlap of up-regulated genes in the doxorubi- cin resistance associated genes (ANKT, BUB1B, CENPA, HCAP- G, HMGB2, HMMR, KIAA0101, KIF4A, LMNB1, MAD2L1, MGC5528, OIP5, PRC1, TOP2A and ZWINT). These results are in line with the findings of a recent study demonstrating that different gene signatures can achieve similar prediction success for the same classification problem.37
Interestingly, only 2 of the top 67 multidrug-resistance associ- ated genes were previously identified to be associated with resist- ance in drug resistant cell linesin vitro. Elevated expression of the Matrix Metalloproteinase 1 (MMP1) was found in breast carci- noma cells with intrinsic and acquired doxorubicin resistance.38In 5 breast cancer cell lines, the coexpression of EGFR or ErbB3 with ErbB2 was found to induce high phosphorylation of ErbB2 and render the cells more resistant to various anticancer drugs, including 5-fluorouracil and doxorubicin.39Additional evaluation of the selected genes in multidrug resistant cell lines will be needed to verify the casual involvement of these genes in drug resistance.
A key concern with the use of cDNA microarray analysis in relation to cancer therapy is that the evaluation of a larger number of genes may identify such a sizeable number of potential target genes that it would be unfeasible to try to confirm the involvement of each of these genes in the resistance. To reduce the experimen- tal variation, we have performed 3 different normalization meth- ods (VSN, MAS and RMA). Thus, the main remaining issue is the variation of the Affymetrix results for 1 sample—in other words the reproducibility of the measurement. In this study, 46 of the drug-resistance related genes were also measured by TaqMan real time RT-PCR. We have decided to measure a relative high num- ber of features compared to earlier studies to achieve robust vali- dation for the microarray data. During the selection, we have focused on genes that were preferentially present in more than 1
resistance pattern. However, because of the lack of established TaqMan probes, we were not able to select all of the relevant genes with highest predictive power. The differential expression on the TaqMan correlated strongly with the results obtained by the Affymetrix arrays even in correlation with different drugs for most analyzed genes (e.g.TFPI2 and mitomycin C resistance,p<0.01;
NMT2 and topotecan resistance,p<0.05; ADD3 and doxorubicin resistance,p < 0.05). However, the correlation for some genes was not significant (e.g. SERPINB2 and vinblastine resistance, RAGE and paclitaxel resistance, PHLDA1 and cisplatin resist- ance). Overall, the differences in RNA expression and their involvements in the predictive gene sets were confirmed by the TaqMan array analysis for most of the selected genes (Table III).
In summary, we have identified predictive sets of marker genes for simultaneous assessment of the sensitivity to eleven selected chemotherapeutical agents at clinically relevant concentrations.
Our results suggest that DNA microarray technology can help to classify cancer cell lines for drug resistance and sensitivity effec- tively. Since the study focused on the resistance at clinically rele- vant anticancer drug concentrations, cancer response prediction may be applicable in the future. The expression patterns validated by quantitative RT-TCR provide new gene candidates associated with multidrug resistance. To verify the predictors identified in well-establishedin vitromodels, they have to be scrutinized with heterogeneous clinical specimens from large cohorts of cancer patients. However, for identification of potential new factors func- tionally involved in drug resistance, the expression analyses are not directly useful. For identification of such factors, additional hypothesis-driven studies are necessary.
Acknowledgements
BGY was supported by a Marie Curie fellowship (HPMD-CT- 2000-00001) from the European Union and by the National Office for Research and Technology, Hungary. The array measurements were supported by the Oligene GmbH. The authors certify that they have not entered into any agreement that could interfere with their access to the data on the research, nor upon their ability to analyze the data independently, to prepare manuscripts, and to publish them.
References 1. Gottesman MM, Fojo T, Bates SE. Multidrug resistance in cancer:
role of ATP-dependent transporters. Nat Rev Cancer 2002;2:48–58.
2. Arceci RJ. Clinical significance ofP-glycoprotein in multidrug resist- ance malignancies. Blood 1993;81:2215–22.
3. Thomas H, Coley HM. Overcoming multidrug resistance in cancer:
an update on the clinical strategy of inhibitingP-glycoprotein. Cancer Control 2003;10:159–65.
4. Beck WT, Grogan TM, Willman CL, Cordon-Cardo C, Parham DM, Kuttesch JF, Andreeff M, Bates SE, Berard CW, Boyett JM, Brophy NA, Broxterman HJ,et al. Methods to detect P-glycoprotein-associ- ated multidrug resistance in patients’ tumors: consensus recommenda- tions. Cancer Res 1996;56:3010–20.
5. Scherf U, Ross DT, Waltham M, Smith LH, Lee JK, Tanabe L, Kohn KW, Reinhold WC, Myers TG, Andrews DT, Scudiero DA, Eisen MB, et al. A gene expression database for the molecular pharmacol- ogy of cancer. Nat Genet 2000;24:236–44.
6. Szakacs G, Annereau JP, Lababidi S, Shankavaram U, Arciello A, Bussey KJ, Reinhold W, Guo Y, Kruh GD, Reimers M, Weinstein JN, Gottesman MM. Predicting drug sensitivity and resistance: profiling ABC transporter genes in cancer cells. Cancer Cell 2004;6:129–37.
7. Hofmann WK, de Vos S, Elashoff D, Gschaidmeier H, Hoelzer D, Koeffler HP, Ottmann OG. Relation between resistance of Philadel- phia-chromosome-positive acute lymphoblastic leukaemia to the tyro- sine kinase inhibitor STI571 and gene-expression profiles: a gene- expression study. Lancet 2002;359:481–6.
8. Holleman A, Cheok MH, den Boer ML, Yang W, Veerman AJ, Kazemier KM, Pei D, Cheng C, Pui CH, Relling MV, Janka-Schaub GE, Pieters R,et al. Gene-expression patterns in drug-resistant acute lymphoblastic leukemia cells and response to treatment. N Engl J Med 2004;351:533–42.
9. van de Vijver MJ, He YD, van’t Veer LJ, Dai H, Hart AA, Voskuil DW, Schreiber GJ, Peterse JL, Roberts C, Marton MJ, Parrish M, Atsma D, et al. A gene-expression signature as a predictor of survival in breast cancer. N Engl J Med 2002;347:1999–2009.
10. van’t Veer LJ, Dai H, van De Vijver MJ, He YD, Hart AA, Mao M, Peterse HL, van der Kooy K, Marton MJ, Witteveen AT, Schreiber GJ, Kerkhoven RM, et al. Gene expression profiling predicts clinical outcome of breast cancer. Nature 2002;415:530–6.
11. Sorlie T, Perou CM, Tibshirani R, Aas T, Geisler S, Johnsen H, Hastie T, Eisen MB, van de Rijn M, Jeffrey SS, Thorsen T, Quist H,et al.
Gene expression patterns of breast carcinomas distinguish tumor sub- classes with clinical implications. Proc Natl Acad Sci USA 2001;98:10869–74.
12. Kihara C, Tsunoda T, Tanaka T, Yamana H, Furukawa Y, Ono K, Kitahara O, Zembutsu H, Yanagawa R, Hirata K, Takagi T, Naka- mura Y. Prediction of sensitivity of esophageal tumors to adjuvant chemotherapy by cDNA microarray analysis of gene-expression pro- files. Cancer Res 2001;61:6474–9.
13. Mariadason JM, Arango D, Shi Q, Wilson AJ, Corner GA, Nicholas C, Aranes MJ, Lesser M, Schwartz EL, Augenlicht LH. Gene expres- sion profiling-based prediction of response of colon carcinoma cells to 5-fluorouracil and camptothecin. Cancer Res 2003;63:8791–812.
14. Zembutsu H, Ohnishi Y, Tsunoda T, Furukawa Y, Katagiri T, Ueyama Y, Tamaoki N, Nomura T, Kitahara O, Yanagawa R, Hirata K, Nakamura Y. Genome-wide cDNA microarray screening to corre- late gene expression profiles with sensitivity of 85 human cancer xen- ografts to anticancer drugs. Cancer Res 2002;62:518–27.
15. Chabner B. The role of drugs in cancer treatment. In: Chabner B, ed.
Pharmacologic principles of cancer treatment. Philadelphia: W.B.
Saunders, 1982.3–14.
1711
PREDICTION SIGNATURE FOR ELEVEN ANTICANCER AGENTS