Original Article
Prognostic value of PDCD-1 and CTLA-4 in ovarian cancer patients
Chenjing Zhu1*, Xuelei Ma1*, Wenwu Ling2*, Yue Xiao3, Balázs Győrffy4,5
1State Key Laboratory of Biotherapy and Cancer Center, West China Hospital, Sichuan University, and Collaborative Innovation Center for Biotherapy, Chengdu, China; 2Department of Ultrasound, West China Hospital, Sichuan University, Chengdu, Sichuan, China; 3West China School of Medicine, Sichuan University, Chengdu, China; 4MTA TTK Lendület Cancer Biomarker Research Group, Budapest, Hungary; 52nd Department of Pediatrics, Semmelweis University, Budapest, Hungary. *Equal contributors.
Received January 23, 2016; Accepted May 5, 2016; Epub November 15, 2016; Published November 30, 2016 Abstract: Therapeutic effectiveness of treatments for ovarian cancer is not optimal. PDCD-1 and CTLA-4 offers the potential as a prognostic marker in addition to being a target for therapy. To assess the prognostic roles of PDCD-1 and CTLA-4 Gene in ovarian cancer, we utilized the Kaplan Meier plotter, a biomarker assessment tool with large quantities of data. The relationship between PDCD-1 and overall survival (OS) as well as CTLA-4 and OS were pre- sented using Hazard Ratio, 95% CI and logrank P value. Then gene expression level was compared using H-Test and U test. The results were as follows: PDCD-1 and CTLA-4 gene expressions among 1582 ovarian cancer patients were shown with median gene expression value as the cut-off. Expression of PDCD-1 and CTLA-4 did not differ with regard to stages and P53 gene mutation. But the expression of CTLA-4 was higher in endometrioid than in serous cancer patients. Different grades of both PDCD-1 and CTLA-4 had different mean values. Higher expression of the PDCD-1 was not significantly correlated with better OS with HR 0.88 (95% CI: 0.77-1.01, P=0.061) but higher CTLA-4 was associated with better survival with HR 0.84 (95% CI: 0.73-0.96, P=0.0099) on the transcriptome level. In conclu- sion, lower expression of CTLA-4, but not PDCD-1 predicts worse survival.
Keywords: PDCD-1, CTLA-4, ovarian cancer, prognosis
Introduction
Ovarian cancer (OC) is a kind ofmalignant tumor of the female reproductive system. It is the most common cause of death in women with gynecological malignancy which is responsible for the highest mortality among US women [1, 2]. Despite extensive researches in this area, the therapeutic effectiveness of treatments for ovarian cancer is not optimal [3]. But recently, a large number of biomarker candidates have been suggested for predicting clinical out- comes in ovarian cancer patients and have shown the potential in the treatment of OC [1, 4-9].
Among them, the roles of PDCD-1 (Programmed cell death 1, also known as PD-1 and CD279) and CTLA-4 (cytotoxic T-lymphocyte-associated protein 4, also known as CD152) are brought
forward in tumor progression and suppression.
The translational products of PDCD-1 and CTLA-4 gene are PDCD-1 and CTLA-4, respec- tively. PDCD-1 binds two ligands, PD-L1 (B7-H1) and PD-L2 (B7-DC) and can compete with B7.1, resulting in inhibition of T cell activation [10, 11]. Cytotoxic T-lymphocyte-associated antigen 4 (CTLA-4) is another immune inhibitory path- way protein that results in T-cell down regula- tion and can act as a co-inhibitory receptor with PDCD-1 [12].
Studies have suggested that some tumors have high levels of expression of PD-L1, possibly suppressing anti-tumor T cell responses [13].
Hamanishi J et al. [14] studied the expression of PD-L1 and PD-L2 on ovarian tumors and found a significantly worse overall survival (OS) in patients whose tumor expressed one or both of these ligands. It has been indicated that
PDCD-1/PD-L1 pathway (CD274) blockade aug- ments tumor inhibition by increasing effector T cell activity, while attenuating Treg cell suppres- sion [15]. The blockage and silencing of PDCD- 1, CTLA-4 or both PDCD-1 and CTLA-4 mole- cules could significantly reduce arginase I activ- ity and expression induced with tumor-associ- ated factor [16]. As a result, PD-L1 offers the potential as a prognostic marker in addition to being a target for therapy.
What’s more, blockade of PDCD-1, CTLA-4 or both slowed tumor growth and improved the survival rate of tumor-bearing mice. Monoclonal antibodies that bind such targets have been used to resist tumor. For example, FDA has approved αCTLA-4 antibody for treatment of melanoma [16].
However, the studies described above enrolled a relatively small number of patients and some of them appeared to be promising only in ani- mal models without being confirmed in human clinical trials. Larger and more specific studies are required to define the prognostic roles. In
this study, we estimated the prognostic roles of PDCD-1 and CTLA-4 Gene in ovarian cancer using a large-scale database. We utilized the Kaplan Meier plotter, a biomarker assessment tool, of which the large quantities of data are from the Gene Expression Omnibus (GEO) and the Cancer Genome Atlas (TCGA).
Methods
Construction of ovarian cancer microarray da- tabase
The way of the database’s (www.kmplot.com) construction was described in a previous report [37]. To summarize, we explored GEO (http://
www.pubmed.com/geo) and TCGA (http://can- cergenome.nih.gov) to identify ovarian datas- ets suitable for the analysis and extracted the data. Subtypes of ovarian cancer are avail- able of different stages, histology, grades and P53 gene mutation. Detailed demographic and treatment information of each patient is not shown. Datasets included in the online data- base are as follows: GSE14764, GSE15622, Table 1. A summary of the clinical characteristics of PDCD-1 and CTLA-4
PDCD-1 CTLA-4
N Mean 95%
Conf. (±) Std.
Error Std.
Dev. N Mean 95%
Conf. (±) Std.
Error Std.
Dev.
Stage
1 77 45.23 14.08 7.07 62.05 77 56.48 12.17 6.11 53.61
2 65 29.02 9.80 4.90 39.54 65 49.06 12.18 6.10 49.17
3 1004 60.54 6.11 3.11 98.65 1004 58.22 6.41 3.27 103.47 4 169 47.35 10.39 5.27 68.45 169 48.95 9.10 4.61 59.89 Entire sample 1315 56.39 4.96 2.53 91.62 1315 56.47 5.11 2.61 94.48 Subtype (1_serous2_endometrioid)
1 1143 44.72 4.49 2.29 77.44 1143 53.95 4.43 2.26 76.25 2 36 63.31 29.55 14.56 87.35 36 64.75 18.23 8.98 53.89 Entire sample 1179 45.28 4.44 2.27 77.79 1179 54.28 4.32 2.20 75.67 Grade
0 10 34.00 20.85 9.22 29.15 10 77.70 59.58 26.34 83.29 1 56 67.29 27.41 13.68 102.35 56 63.66 20.60 10.28 76.92 2 315 77.32 10.92 5.55 98.54 315 71.37 8.19 4.16 73.87
3 973 52.75 5.62 2.87 89.39 973 63.15 7.26 3.70 115.41
4 2 136.00 1651.81 130.00 183.85 2 23.00 228.71 18.00 25.46 Entire sample 1356 59.04 4.93 2.51 92.52 1356 65.13 5.62 2.86 105.46 P53 mutation (1_mutated, 0_wild type)
0 87 17.51 4.14 2.08 19.44 87 21.66 5.34 2.69 25.05
1 441 17.19 1.84 0.94 19.70 441 23.95 2.47 1.26 26.41
Entire sample 528 17.24 1.68 0.85 19.64 528 23.57 2.24 1.14 26.18
GSE18520, GSE19829, GSE23554, GSE261- 93, GSE26712, GSE30161, GSE3149, GSE- 9891, GSE27651 and TCGA. All the microarray are based on transcriptome.
Data collection
To present the association between the gene under investigation and survival, we retrieved the data using gene expression cutoff value as median over entire dataset. We also excluded the biased arrays by checking if two or more of the following parameters were out of the 95% range of all arrays: percentage of present calls, the raw Q, presence of bioB-/C-/D-spikes, GAPDH and ACTB 3’ to 5’ ratio, thus the array quality could be controlled. Because our data were from the online database, no informed consents would be needed.
Statistical analysis
We analyzed the relationship between PDCD-1 and overall survival (OS) as well as CTLA-4 and OS using Cox’s proportional hazards regression model. Hazard Ratio, 95% CI and logrank P were calculated. Then the analysis was restrict- ed to different subtypes by stage, histology, grade and P53 mutation and association of each category with OS was also presented with entire reported data online (see Table 2).
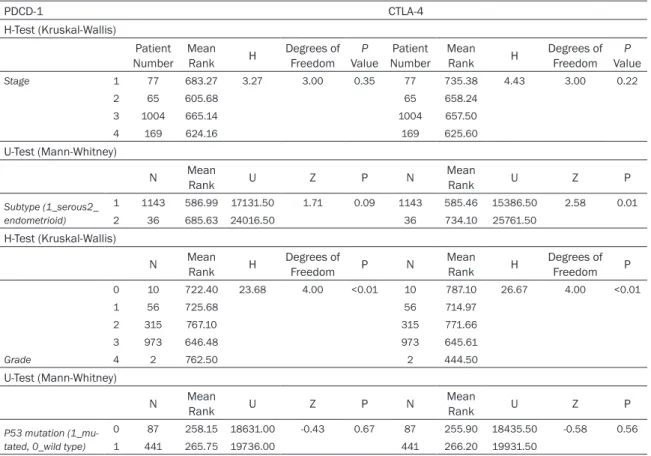
Gene expression level was compared using the H-Test (Kruskal-Wallis) and U test (Mann- Whitney) (see Table 3). All the above analyses
were conducted using the SPSS software (ver- sion 19.0 Chicago, IL, USA).
Results
The Kaplan Meier plotter databases include 1,648 ovarian cancer patients with a mean fol- low-up of 40 months. The Overall survival anal- ysis was run on 1,582 patients meeting our criteria. Altogether, 77, 65, 1005 and 169 patients were stage I, II, III, and IV; 1143 patients were serous cancer, whereas 36 were endometrioid cancer; the number of people in Grade 0, 1, 2, 3, 4 were 10, 56, 315, 973, 2;
441 patients had P53gene mutation, in con- trast to 87 wild types. Mean expression value, (±) 95% Confidence Interval, Standard Error and standard Deviation were analyzed. A sum- mary of the clinical characteristics of the data- base is presented in Table 1 and Figure 1.
Grade 0 and 4 patients were excluded because of relatively small numbers of patients enrolled in the database. Mean CTLA-4 expression value was higher in endometrioid, compared with serous cancer patients (mean value 53.95 vs.
64.75).
Low expressions of PDCD-1 and CTLA-4 were associated with poor outcomes
Using KMplot software, PDCD-1 and CTLA-4 gene expressions among 1582 ovarian cancer patients were shown with median gene expres- sion value as the cut-off. The number of patients Table 2. Prognostic roles of PDCD-1 and CTLA-4 in ovarian cancer patients and subgroup analysis
PDCD-1 CTLA-4
Low Expres-
sion (n) High Expres- sion (n) Hazard
Ratio 95% CI logrank P Low Expres-
sion (n) High Expres- sion (n) Hazard
Ratio 95% CI logrank P
Entire cohort 792 790 0.06 0.77-1.01 0.06 803 779 0.84 0.73-0.96 0.01
Stage
1 44 30 0.69 0.21-2.29 0.54 37 37 1.30 0.41-4.11 0.65
2 43 16 0.74 0.2-2.73 0.65 33 26 0.62 0.19-2.02 0.42
3 576 406 0.83 0.7-0.99 0.04 568 414 0.78 0.66-0.93 0.01
4 74 92 1.22 0.83-1.81 0.31 67 99 0.82 0.56-1.2 0.31
Subtype (1_serous2_endometrioid)
1 728 410 0.91 0.77-1.07 0.27 571 567 0.91 0.78-1.07 0.91
2 22 14 1.16 0.19-6.94 0.87 9 27 0.22 0.04-1.32 0.07
Grade
1 168 162 1.70 0.88-3.31 0.11 28 28 1.03 0.39-2.73 0.94
2 159 156 0.91 0.67-1.23 0.53 158 157 0/81 0.59-1.1 0.18
3 496 472 0.95 0.8-1.13 0.60 491 477 0.89 0.75-1.05 0.16
P53 mutation (1_mutated, 0_wild type)
0 45 41 1.37 0.76-2.49 0.29 45 41 0.94 0.52-1.68 0.83
1 224 215 1.08 0.84-1.39 0.56 222 217 0.90 0.7-1.16 0.43
with lower PDCD-1 expression was 792, and the number with higher was 790 (see Table 2).
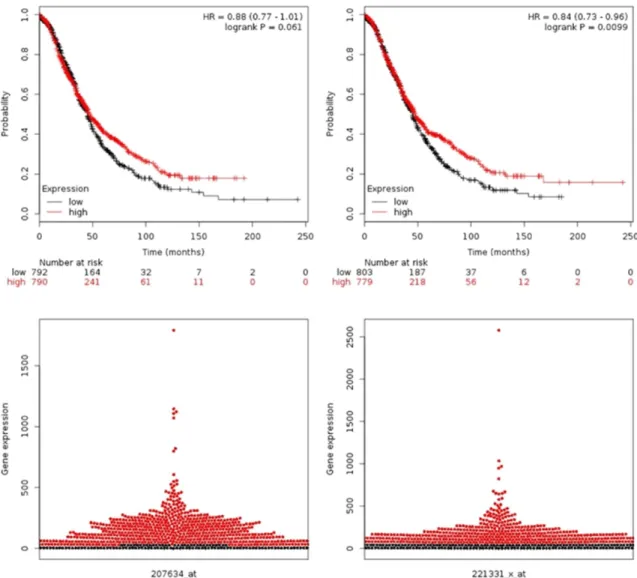
We observed that shorter OS in those patients with low gene expressions (see Figure 2). In detail, higher expression of the PDCD-1 was not significantly correlated with better OS with HR 0.88 (95% CI: 0.77-1.01) but higher CTLA-4 was associated with better survival with HR 0.84 (95% CI: 0.73-0.96) on the transcriptome level.
In addition, by utilizing an extended version of a database of public microarray datasets (http://
kmplot.com/analysis), which is meta-analysis based biomarker assessment software, we generated Kaplan-Meier curves (see Figure 2).
We also drew the bee swarm plot using the bee swarm package (www.cbs.dtu.dk/weklund/
beeswarm/). The bee swarm plot can visualize gene expression as non-overlapping points in a one-dimensional scatter plot which is useful in identifying outlier samples and genes with bimodal distribution.
Comparison of gene expression level
The non-parametric (see Table 3) tests, H-Test (Kruskal-Wallis) and U test (Mann-Whitney)
were used to compare gene expression level.
Expression of PDCD-1 and CTLA-4 did not differ with regard to stages and P53 gene mutation.
But the expression of CTLA-4 was higher in endometrioid than in serous cancer patients.
H-Test (Kruskal-Wallis) showed that different grades of both PDCD-1 and CTLA-4 had differ- ent mean values.
Discussion
In this study with a large number of patients, we found that lower CTLA-4 was associated with poorer survival (HR 0.84, 95% CI: 0.73- 0.96, P=0.0099), but the relationship between expression of PDCD-1 and survival (HR: 0.88, 95% CI: 0.77-1.01, P=0.061) was not statisti- cally significant. Although significant improve- ment has been achieved in the new chemother- apeutical agents in the therapy of ovarian can- cer and the 5-year survival rate has been increasing, the mortality of this malignant dis- ease remains unchanged [6], current treatment strategies are still far from optimum, and we can only improve OS by identifying more robust targets [17].
Table 3. Gene expression level comparison using H-Test (Kruskal-Wallis) and U test (Mann-Whitney)
PDCD-1 CTLA-4
H-Test (Kruskal-Wallis)
Patient Number Mean
Rank H Degrees of Freedom P
Value Patient Number Mean
Rank H Degrees of Freedom P
Value
Stage 1 77 683.27 3.27 3.00 0.35 77 735.38 4.43 3.00 0.22
2 65 605.68 65 658.24
3 1004 665.14 1004 657.50
4 169 624.16 169 625.60
U-Test (Mann-Whitney)
N Mean
Rank U Z P N Mean
Rank U Z P
Subtype (1_serous2_
endometrioid)
1 1143 586.99 17131.50 1.71 0.09 1143 585.46 15386.50 2.58 0.01
2 36 685.63 24016.50 36 734.10 25761.50
H-Test (Kruskal-Wallis)
N Mean
Rank H Degrees of
Freedom P N Mean
Rank H Degrees of Freedom P
Grade
0 10 722.40 23.68 4.00 <0.01 10 787.10 26.67 4.00 <0.01
1 56 725.68 56 714.97
2 315 767.10 315 771.66
3 973 646.48 973 645.61
4 2 762.50 2 444.50
U-Test (Mann-Whitney)
N Mean
Rank U Z P N Mean
Rank U Z P
P53 mutation (1_mu- tated, 0_wild type)
0 87 258.15 18631.00 -0.43 0.67 87 255.90 18435.50 -0.58 0.56
1 441 265.75 19736.00 441 266.20 19931.50
The functions of PDCD-1 and CTLA-4’s co- expression were shown in four aspects: PDCD- 1 and CTLA-4 were associated with obvious dysfunction of antigen-specific T cells, blocking PDCD-1 and CTLA-4 pathways reversed T cell dysfunction, adoptive transfer of CD8+CTLA- 4+PDCD-1+TILs that had previously been treat- ed in vitro with αPDCD-1 and αCTLA-4 anti- bodies eliminated tumors, and lastly, block- ade of PDCD-1/PD-L1 pathway in regulatory T cells attenuates their suppressive function [15]. Cause tumor cells are known to develop immune escape mechanisms to camouflage
themselves from the surveillance of our human bodies, either by down-regulating the activity of T-cells through activation of the inhibitory T-cell receptors CTLA-4 and PDCD-1 or promoting Treg cell activity, they will tip the balance between pro- and anti-immunoactivity towards inhibition of T-cells.
Pioneering studies established that both CD4+ and CD8+ T cells lacking CTLA-4 in vitro and in vivo presented high proliferation and an activated phenotype from the work of laborato- ries of Allison, Bluestone, and others [18-23].
Figure 1. PDCD-1 and CTLA-4 expression based on (A) stage, (B) subtype, (C) grade and (D) P53 mutation. Histo- gram plot error bar represents 95% CI.
Figure 2. Overall survival curves of PDCD-1 and CTLA-4 gene expressions andbee swarm plot. Red color represents high gene expression; black color represents low expression. PDCD-1 is shown on the left side; CTLA-4 is shown on the right side.
What’s more, a significant body of data sug- gests that inhibitors of immune checkpoints might have significant utility in treating cancer which has been borne out by the US FDA’s approvals of two different antibodies against PDCD-1 and CTLA-4, respectively [24]. Antibody- mediated blockade of PDCD-1 and CTLA-4 aug- mented T-cell immune responses, and the use of an antibody against CTLA-4 in combination with a cytokine-expressing cellular vaccine was capable of inducing recession of already-estab- lished poorly immunogenic tumors like B16 melanoma [25].
Based on the theories mentioned above, PDCD- 1 and CTLA-4 expressions should be positively associated with ovarian cancer patients. How- ever, according to our meta-analysis, the HR was 0.88 (95% CI: 0.77-1) for PDCD-1 and 0.85 (95% CI: 0.74-0.97) for CTLA-4, respectively.
Lower expressions of the two genes were not significantly correlated with longer relapse-free survival and vice versa. The paradox may be due to the highly sophisticated immunore- gulatory pathways involving PDCD-1, CTLA-4, and their ligands [26-29]. The complexity of each pathway and cross-talk between them and the interactions with other pathways make it not so simple in human body.
In a study performed by Li Jiang [30], positive PD-L1 expression showed a trend toward being independently correlated with longer OS (P=
0.080), perhaps due to different choice of cut- point values, and different tumors have differ- ent biologic behaviors with the systemic immu- nologic environment affecting the tumor growth to varying degrees.
In advanced gastric adenocarcinoma patients, it was found that higher up-regulated PD-L1 expression had much better prognosis than low expression patients (65.6% vs. 44.7%, P=
0.028). Patients with higher sPD-L1 expression had better overall survival, perhaps because of different strategies in selecting the study popu- lation and different kinds of test methods [31].
The association of PD-L1 expression with favor- able outcome has also been observed in lung cancer [32, 33], colon cancer [34], Merkel cell carcinoma [35], and melanoma [36].
What’s more, analysis of the transcriptome via microarray did not account for the multiple lay- ers of regulation present in the process of tran-
scription, translation, and protein function. All the results were based on transcriptome which may have different functions after processing in human body.
There are some limitations related to our work.
First, although this is the largest up-to-date research on the prognostic roles of PDCD-1 and CTLA-4, this study lacks long-enough follow-up data and therefore the impact of both PDCD-1 and CTLA-4 on prognosis could not be accu- rately evaluated. Second, we did not perform Q-PCR or microarray analysis to substantiate the main conclusions. Additional limitation is the intrinsic property of the database, as it does not show the complicated process pres- ent in translation or protein function. Hence, to optimally identify the role of PDCD-1 and CTLA- 4, careful delineation of the gene interactions in vivo and its relationship with the tumor microenvironment is crucial.
In conclusion, we found that lower expression of CTLA-4, but not PDCD-1 predicts worse survival. The development of molecular bio- markers will beneficially allow the selection of those patients who may benefit from novel therapeutic agents against standard therapeu- tic approaches. However, further large-scale, more comprehensive analyses need to be car- ried out. Our current findings still merit further investigation.
Disclosure of conflict of interest None.
Authors’ contribution
CJ.Z and XL.M designed the study and wrote the manuscript. Balázs Győrffy analyzed the data and prepared all the tables. WW.L and Y.X prepared all the figures. All authors reviewed the manuscript.
Address correspondence to: Xuelei Ma, State Key Laboratory of Biotherapy and Cancer Center, West China Hospital, Sichuan University, and Collabora- tive Innovation Center for Biotherapy, No. 17, Section 3, Renmin Road South, Chengdu 610041, Sichuan, China. Tel: +86 2885502796; Fax: +86 28855- 02796; E-mail: drmaxuelei@gmail.com; Balázs Gy- őrffy, MTA TTK Lendület Cancer Biomarker Research Group, Budapest, Hungary. Tel: +3630-514-2822;
E-mail: gyorffy.balazs@ttk.mta.hu
References
[1] Jelovac D, Armstrong DK. Recent progress in the diagnosis and treatment of ovarian cancer.
CA Cancer J Clin 2011; 61: 183-203.
[2] Basal E, Eghbali-Fatourechi GZ, Kalli KR, Hartmann LC, Goodman KM, Goode EL, Kamen BA, Low PS, Knutson KL. Functional fo- late receptor alpha is elevated in the blood of ovarian cancer patients. PLoS One 2009; 4:
e6292.
[3] Li J, Li L, Li Z, Gong G, Chen P, Liu H, Wang J, Liu Y, Wu X. The role of miR-205 in the VEGF- mediated promotion of human ovarian cancer cell invasion. Gynecol Oncol 2015; 137: 125- 133.
[4] Masoumi-Moghaddam S, Amini A, Wei AQ, Robertson G, Morris DL. Sprouty 2 protein, but not Sprouty 4, is an independent prognostic biomarker for human epithelial ovarian cancer.
Int J Cancer 2015; 137: 560-570.
[5] Khan G, Brooks SE, Mills KI, Guinn BA.
Infrequent Expression of the Cancer-Testis Antigen, PASD1, in Ovarian Cancer. Biomark Cancer 2015; 7: 31-38.
[6] Mirandola L, J Cannon M, Cobos E, Bernardini G, Jenkins MR, Kast WM, Chiriva-Internati M.
Cancer testis antigens: novel biomarkers and targetable proteins for ovarian cancer. Int Rev Immunol 2011; 30: 127-137.
[7] Khan G, Brooks SE, Mills KI, Guinn BA.
Infrequent Expression of the Cancer-Testis Antigen, PASD1, in Ovarian Cancer. Biomark Cancer 2015; 7: 31-38.
[8] Stope MB, Koensgen D, Burchardt M, Concin N, Zygmunt M, Mustea A. Jump in the fire - heat shock proteins and their impact on ovarian cancer therapy. Crit Rev Oncol Hematol 2016;
97: 152-6.
[9] Xu Y, Zhong R, He J, Ding R, Lin H, Deng Y, Zhou L, Li X, Jiang J, Bao Y, Luo X, Duan C.
Modification of cut-off values for HE4, CA125 and the ROMA algorithm for early-stage epithe- lial ovarian cancer detection: Results from 1021 cases in South China. Clin Biochem 2016; 49: 32-40.
[10] Butte MJ, Keir ME, Phamduy TB, Sharpe AH, Freeman GJ. Programmed death-1 ligand 1 in- teracts specifically with the B7-1 costimulatory molecule to inhibit T cell responses. Immunity 2007; 27: 111-122.
[11] Keir ME, Butte MJ, Freeman GJ, Sharpe AH.
PDCD-1 and its ligands in tolerance and immu- nity. Annu Rev Immunol 2008; 26: 677-704.
[12] Swanson MS, Sinha UK. Rationale for com- bined blockade of PDCD-1 and CTLA-4 in ad- vanced head and neck squamous cell cancer- review of current data. Oral Oncol 2015; 51:
12-15.
[13] Maine CJ, Aziz NH, Chatterjee J, Hayford C, Brewig N, Whilding L, George AJ, Ghaem- Maghami S. Programmed death ligand-1 over- expression correlates with malignancy and contributes to immune regulation in ovarian cancer. Cancer Immunol Immunother 2014;
63: 215-224.
[14] Hamanishi J, Mandai M, Iwasaki M, Okazaki T, Tanaka Y, Yamaguchi K, Higuchi T, Yagi H, Takakura K, Minato N, Honjo T, Fujii S.
Programmed cell death 1 ligand 1 and tumor- infiltrating CD8+ T lymphocytes are prognostic factors of human ovarian cancer. Proc Natl Acad Sci U S A 2007; 104: 3360-3365.
[15] Duraiswamy J, Kaluza KM, Freeman GJ, Coukos G. Dual blockade of PDCD-1 and CTLA- 4 combined with tumor vaccine effectively re- stores T-cell rejection function in tumors.
Cancer Res 2013; 73: 3591-3603.
[16] Liu Y, Yu Y, Yang S, Zeng B, Zhang Z, Jiao G, Zhang Y, Cai L, Yang R. Regulation of arginase I activity and expression by both PDCD-1 and CTLA-4 on the myeloid-derived suppressor cells. Cancer Immunol Immunother 2009; 58:
687-697.
[17] Penzvalto Z, Lánczky A, Lénárt J, Meggyesházi N, Krenács T, Szoboszlai N, Denkert C, Pete I, Győrffy B. MEK1 is associated with carboplatin resistance and is a prognostic biomarker in epithelial ovarian cancer. BMC Cancer 2014;
14: 837.
[18] Chambers CA, Sullivan TJ, Allison JP. Lym- phoproliferation in CTLA-4-deficient mice is mediated by costimulation-dependent activa- tion of CD4+ T cells. Immunity 1997; 7: 885- [19] Chambers CA, Sullivan TJ, Truong T, Allison JP. 895.
Secondary but not primary T cell responses are enhanced in CTLA-4-deficient CD8+ T cells.
Eur J Immunol 1998; 28: 3137-3143.
[20] Chambers CA, Kuhns MS, Allison JP. Cytotoxic T lymphocyte antigen-4 (CTLA-4) regulates pri- mary and secondary peptide-specific CD4(+) T cell responses. Proc Natl Acad Sci U S A 1999;
96: 8603-8608.
[21] Greenwald RJ, Oosterwegel MA, van der Woude D, Kubal A, Mandelbrot DA, Boussiotis VA, Sharpe AH. CTLA-4 regulates cell cycle pro- gression during a primary immune response.
Eur J Immunol 2002; 32: 366-373.
[22] Greenwald RJ, Boussiotis VA, Lorsbach RB, Abbas AK, Sharpe AH. CTLA-4 regulates induc- tion of anergy in vivo. Immunity 2001; 14: 145- [23] McCoy KD, Hermans IF, Fraser JH, Le GG, 155.
Ronchese F. Cytotoxic T lymphocyte-associated antigen 4 (CTLA-4) can regulate dendritic cell- induced activation and cytotoxicity of CD8(+) T cells independently of CD4(+) T cell help. J Exp Med 1999; 189: 1157-1162.
[24] Baksh K, Weber J. Immune checkpoint protein inhibition for cancer: preclinical justification for CTLA-4 and PDCD-1 blockade and new combi- nations. Semin Oncol 2015; 42: 363-377.
[25] Weber J. Immune checkpoint proteins: a new therapeutic paradigm for cancer--preclinical background: CTLA-4 and PDCD-1 blockade.
Semin Oncol 2010; 37: 430-439.
[26] Blackburn SD, Crawford A, Shin H, Polley A, Freeman GJ, Wherry EJ. Tissue-specific differ- ences in PDCD-1 and PD-L1 expression during chronic viral infection: implications for CD8 T-cell exhaustion. J Virol 2010; 84: 2078-2089.
[27] Jin HT, Anderson AC, Tan WG, West EE, Ha SJ, Araki K, Freeman GJ, Kuchroo VK, Ahmed R.
Cooperation of Tim-3 and PDCD-1 in CD8 T-cell exhaustion during chronic viral infection. Proc Natl Acad Sci U S A 2010; 107: 14733-14738.
[28] Sakuishi K, Apetoh L, Sullivan JM, Blazar BR, Kuchroo VK, Anderson AC. Targeting Tim-3 and PDCD-1 pathways to reverse T cell exhaustion and restore anti-tumor immunity. J Exp Med 2010; 207: 2187-2194.
[29] Woo SR, Turnis ME, Goldberg MV, Bankoti J, Selby M, Nirschl CJ, Bettini ML, Gravano DM, Vogel P, Liu CL, Tangsombatvisit S, Grosso JF, Netto G, Smeltzer MP, Chaux A, Utz PJ, Workman CJ, Pardoll DM, Korman AJ, Drake CG, Vignali DA. Immune inhibitory molecules LAG-3 and PDCD-1 synergistically regulate T-cell function to promote tumoral immune es- cape. Cancer Res 2012; 72: 917-927.
[30] Jiang L, Wang L, Li PF, Zhang XK, Chen JW, Qiu HJ, Wu XD, Zhang B. Positive expression of pro- grammed death ligand-1 correlates with supe- rior outcomes and might be a therapeutic tar- get in primary pulmonary lymphoepithelioma- like carcinoma. Onco Targets Ther 2015; 8:
1451-1457.
[31] Zheng Z, Bu Z, Liu X, Zhang L, Li Z, Wu A, Wu X, Cheng X, Xing X, Du H, Wang X, Hu Y, Ji J. Level of circulating PD-L1 expression in patients with advanced gastric cancer and its clinical impli- cations. Chin J Cancer Res 2014; 26: 104-111.
[32] Chen YB, Mu CY, Huang JA. Clinical significance of programmed death-1 ligand-1 expression in patients with non-small cell lung cancer: a 5-year-follow-up study. Tumori 2012; 98: 751- [33] Velcheti V. Programmed death ligand-1 expres-755.
sion in non-small cell lung cancer. Lab Invest 2014; 94: 107-116.
[34] Droeser RA, Hirt C, Viehl CT, Frey DM, Nebiker C, Huber X, Zlobec I, Eppenberger-Castori S, Tzankov A, Rosso R, Zuber M, Muraro MG, Amicarella F, Cremonesi E, Heberer M, Iezzi G, Lugli A, Terracciano L, Sconocchia G, Oertli D, Spagnoli GC, Tornillo L. Clinical impact of pro- grammed cell death ligand 1 expression in colorectal cancer. Eur J Cancer 2013; 49:
2233-2242.
[35] Lipson EJ, Vincent JG, Loyo M, Kagohara LT, Luber BS, Wang H, Xu H, Nayar SK, Wang TS, Sidransky D, Anders RA, Topalian SL, Taube JM. PD-L1 expression in the Merkel cell carci- noma microenvironment: association with in- flammation, Merkel cell polyomavirus and overall survival. Cancer Immunol Res 2013; 1:
54-63.
[36] Taube JM, Anders RA, Young GD, Xu H, Sharma R, McMiller TL, Chen S, Klein AP, Pardoll DM, Topalian SL, Chen L. Colocalization of inflam- matory response with B7-h1 expression in hu- man melanocytic lesions supports an adaptive resistance mechanism of immune escape. Sci Transl Med 2012; 4: 127ra37.
[37] Gyorffy B, Surowiak P, Budczies J, Lanczky A.
Online survival analysis software to assess the prognostic value of biomarkers using tran- scriptomic data in non-small-cell lung cancer.
PLoS One 2013; 8: e82241.