Mechanisms Associated with Type 2 Diabetes as a Risk Factor for Alzheimer-Related Pathology
Men Su1,2&Kambiz Naderi1&Nathalie Samson1&Ihsen Youssef3&Livia Fülöp4&Zsolt Bozso4&Serge Laroche1&
Benoit Delatour3&Sabrina Davis1
Received: 11 September 2018 / Accepted: 10 January 2019 / Published online: 25 January 2019
#Springer Science+Business Media, LLC, part of Springer Nature 2019
Abstract
Current evidence suggests dementia and pathology in Alzheimer’s Disease (AD) are both dependent and independent of amyloid processing and can be induced by multiple‘hits’on vital neuronal functions. Type 2 diabetes (T2D) poses the most important risk factor for developing AD after ageing and dysfunctional IR/PI3K/Akt signalling is a major contributor in both diseases. We developed a model of T2D, coupling subdiabetogenic doses of streptozotocin (STZ) with a human junk food (HJF) diet to more closely mimic the human condition. Over 35 weeks, this induced classic signs of T2D (hyperglycemia and insulin dysfunction) and a modest, but stable deficit in spatial recognition memory, with very little long-term modification of proteins in or associated with IR/PI3K/Akt signalling in CA1 of the hippocampus.
Intracerebroventricular infusion of soluble amyloid beta 42 (Aβ42) to mimic the early preclinical rise in Aβalone induced a more severe, but short-lasting deficits in memory and deregulation of proteins. Infusion of Aβon the T2D phenotype exacerbated and prolonged the memory deficits over approximately 4 months, and induced more severe aberrant regula- tion of proteins associated with autophagy, inflammation and glucose uptake from the periphery. A mild form of envi- ronmental enrichment transiently rescued memory deficits and could reverse the regulation of some, but not all protein changes. Together, these data identify mechanisms by which T2D could create a modest dysfunctional neuronal milieu via multiple and parallel inputs that permits the development of pathological events identified in AD and memory deficits when Aβlevels are transiently effective in the brain.
Keywords Type 2 diabetes . Alzheimer’s disease . Amyloid beta . PI3K-Akt signalling . Insulin . Human junk food . CA1 . Object recognition . Environment enrichment
Introduction
Until more recently, much of the research into how pathology in Alzheimer’s disease (AD) induces dementia has focussed on the amyloid plaque, to the relative neglect of non-amyloid specific pathologies associated with the disease. However, the past decade has witnessed a paradigm shift away from the hard core amyloid plaque as the major pathological mecha- nism inducing the disease and ensuing dementia to the role of soluble, toxic species of preaggregated amyloid and non- specific pathologies [1,2]. The main evidence supporting this is treatments in clinical trials that remove plaques do not result in improvement or slowing of the dementia [3], and imaging studies suggesting amyloid load is an age-related phenome- non that does not necessarily lead to dementia [4, 5]. Both epidemiological and experimental evidence have identified a number of dysfunctional/pathological events in AD, that are not specific to AD, that include dysfunction in energy Electronic supplementary materialThe online version of this article
(https://doi.org/10.1007/s12035-019-1475-8) contains supplementary material, which is available to authorized users.
* Sabrina Davis
Sabrina.davis@u-psud.fr
1 Département Cognition & Comportement, Institut de Neurosciences Paris-Saclay (Neuro-PSI) CNRS UMR 9197, Université Paris Sud, Bat. 446, 91405 Orsay, France
2 Present address: Division of Episomal Persistent DNA in Cancer and Chronic disease, German Cancer Research Centre (DKFZ), 69120 Heidelberg, Germany
3 Institut du Cerveau et de la Moelle épinière, INSERM, CNRS, Sorbonne Universites, ICM, 75013 Paris, France
4 Department of Medical Chemistry, University of Szeged, Dómtér 8., Szeged 6720, Hungary
regulation, supply of nutrients, oxidative/ER stress, inflamma- tion, mitogenic abnormalities, synaptic failure, autophagy and disruption of the blood brain barrier and neurovasculature [6–14].
A key question is whether these dysfunctions are directly linked with the classic AD pathology in terms of being a cause or consequence of amyloid pathology, or whether they are independent pathologies occurring in parallel with amyloid pathology. Whether causal or independent, it suggests that these dysfunctional events may constitute a multiple‘attack’
on the brain, and the question becomes how they are induced.
Many of these dysfunctional events are associated with known metabolic risk factors for developing AD that develop slowly over time.
Ageing is the major risk factor for developing AD, howev- er, following that type 2 diabetes (T2D), poses the greatest known risk; epidemiological studies show a large percentage of people with T2D go on to develop AD [15] and diabetic patients show similar cognitive deficits to those at early stage AD [16]. Adult T2D is characterised by peripheral hypergly- cemia, dysfunctional insulin signalling and chronic low-grade inflammation and begins to manifest the symptoms in mid life, a time that coincides with the early increase in soluble Aβ40/42 in the brains of human subjects predicted to develop AD [17]. However, as AD, T2D is a multifactorial disease and subject to risk factors, most notably obesity [18] that is highly linked with the development of hyperinsulinemia [19] and develops slowly over time.
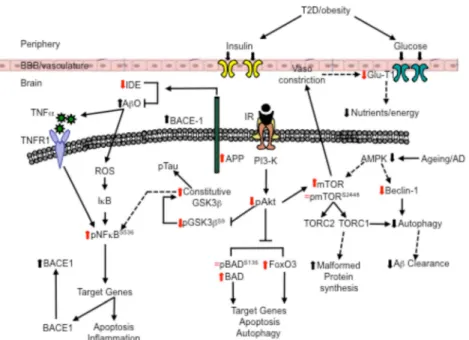
Both diseases share common pathologies albeit they have been identified in the periphery with T2D and in the brain with AD. These include an increase in inflammation, dysregulation of glucose and insulin signalling and these are mediated, at least in part, via IR/PI3K/Akt signalling [20,21]. Although it has been suggested that T2D pathologies can promote early neurodegenerative processes, the mechanisms by which this occurs are complex and poorly understood [see22]. One pos- sibility is that peripheral hyperinsulinemia and hyperglycemia associated with T2D impairs the uptake of insulin and glucose across the blood brain barrier (BBB) [23] to induce dysfunc- tional insulin signalling in the brain, and chronic low-grade inflammation may impact the BBB to allow inflammatory molecules to pass through.
To date, numerous studies have shown links between pa- thologies associated T2D and AD using different approaches.
For example, dysfunction regulation of the IR/PI3K/Akt sig- nalling pathway has been shown in postmortem brains of pa- tients with AD [24–26]; development of AD pathology ob- served in rodent models of T2D [27]; acceleration of AD pathology in transgenic AD mice fed high fat and/or high sucrose diets [28–31]; antidiabetic treatment in humans with AD, and murine models of the disease show some improve- ment in cognition and memory and afford a certain level of protection against inflammation, apoptosis and synaptic
failure in the brain [32,33]. Finally, studies have recapitulated dysfunction in glucose metabolism, IR/PI3K/Akt signalling and the induction of inflammation and regulation of Tau and and Aβprocessing in the brain following icv injection of the diabetogenic toxin, Streptozotocin (STZ) [see34,35]. Despite the number of studies and different approaches, they have produced mixed results that may be inherently linked with variables such as the type of model used, the duration of the experiments, type of diet, etc. Therefore, it is difficult to have a clear idea of how these dysfunctions link T2D to AD.
The aim of our experiments is therefore dual fold. Firstly, it is to determine whether a T2D profile might exacerbate dys- functional mechanisms in CA1 of the hippocampus induced by early increases in soluble amyloid associated with preclin- ical stages of AD. To this end, we focussed on proteins in and associated with IR/PI3K/Akt signalling that contribute to de- regulation of functions such as apoptosis, autophagy, inflam- mation, glucose uptake and the promotion of amyloid and tau processing [20,21,36]. Secondly. in an attempt to more close- ly mimic human T2D, we modified an established model of T2D that normally couples subdiabetogenic doses of Streptozotocin (STZ) with a calibrated high diet [37,38] by coupling STZ injections with a human junk food (HJF) diet. In addition, we conducted longitudinal studies to determine the evolution of dysfunction induced by different treatments.
Finally, as a functional readout, we repeatedly tested spatial recognition memory and subsequently the potential beneficial effect of environment enrichment (EE) has been shown to have general positive effects on hippocampal dependent mem- ory including spatial and recognition memory and some forms of neuronal plasticity and mitigates deficits in rodent models of pathology [39,40].
Material and Methods Animals
Male Sprague Dawley rats (n = 100), weighing approxi- mately 300 g, were purchased from Charles River Laboratories, France. The animals were housed in standard cages (2 rats/cage) and maintained in a temperature and humidity controlled colony room with 12/12-h light dark cycle with fresh water ad libitum and normal laboratory pellets (A04, SAFE, France) until the start the feeding pro- tocol. All efforts were made to minimise the animal num- bers and suffering throughout the experimental procedure.
Experiments were conducted according to the European Communities Council Directive of 24 November 1986 (86/609/EEC), EU Directive 2010/63/EU, and the French National Committee (87/848), and approval from the local ethics committee (n°59).
General Protocol and Experimental Groups
We conducted longitudinal studies over 9–10 months, where rats were first started on a feeding regime of human junk food (HJF) and then 7 weeks later, injected twice with subdiabetogenic doses of Streptozotocin (STZ), 1 week apart.
At week 20, some of the rats were implanted with osmotic minipumps containing soluble Aβ42 and the experiment was continued for another 15 weeks. Throughout the experimental period, regular glucose tolerance tests (GTTs) and spatial rec- ognition memory tests were conducted (see timeline, Fig.1).
In western blotting, we also used brains from naïve rats for comparison with the control group.
Feeding Protocol
After 2 weeks’of adaptation to laboratory conditions, rats were randomly divided into two basic feeding regimes; those main- tained on the calibrated laboratory diet (LD) at the recommend- ed dose to maintain normal health and growth; or human‘junk’
food (HJF; see Online Resource 1) that was high in calories, sugar and fat. Moreover, these foods contained chemical com- ponents used as stabilisers, emulsifiers, colourants, etc. A wide range of food products was offered to rats at the start of the experiment to determine their food preference and from a pool of about 20 foodstuff; 8–10 were given per day in excess, such that on a weekly basis, all rats ate the same foods in about the same quantity. This feeding regime was continued throughout the experimental period and body weight was recorded on a weekly basis. Consumption of major nutritional components in HJF was assessed each day over a 6-week period in the middle of the experiment.
Streptozotocin (STZ) Injections
STZ (Sigma- Aldrich) was dissolved in citric acid (pH 6.0), prepared as required and protected from light. Rats were fasted the night prior to given 2 sub-diabetogenic doses (30 mg/kg i.p.) 1 week apart approximately 7 weeks after the start of the feeding regime.
Amyloid-Beta (A
β) Preparation, Infusion and Surgical Procedures
The Aβ42 peptide was specifically synthesised to be main- tained in a soluble form, as reported elsewhere [41] and stored as lyophilised aliquots (0.1 mg) at−80° until required. Prior to use, the peptide was resuspended in HyPure Molecular biolo- gy double distilled sterile water (Thermo; France), sonicated, diluted to a nominal concentration of 100μM in aCSF (pH = 7.4, Alzet protocol), and filtered through a membrane filter (100 nm pore size, PVDF sterile, Millex, Millipore) to remove the insoluble aggregates. The final concentration was made in
aCSF to 50μM; the exact value was determined by a standard BCA assay.
For the TEM experiments, 10μl aliquots were placed on formvar carbon 400-mesh copper grids (Electron Microscopy Sciences, Washington, PA, USA) after 168 h of incubation at 37 °C. Grids were stained with 2% (w/v) uranyl acetate.
Specimens were studied with a Philips CM 10 transmission electron microscope (FEI Company, Hillsboro, Oregon, USA) operating at 100 kV. Images were taken by a Megaview II Soft Imaging System at a magnification of × 46000 and analysed with an AnalySis® 3.2 software package (Soft Imaging System GmbH, Münster, German).
Approximately 20 weeks after the start of the feeding re- gime, half of the rats in each group underwent surgery to im- plant osmotic minipumps (Alzet, model 2004, USA) to infuse Aβ42 intraventricularly (icv) over 7 days (0.5μl/h). Rats were deeply anaesthetised with Ketamine (1.5 ml/kg) and Domitor (0.5 ml/kg). They were placed in a stereotaxic frame, the skull exposed to allow a single hole to be drilled out to place a cannula in the lateral ventricle (Bregma 1.3 mm; midline 1.8 mm; depth 3.0 mm from the brain surface). The cannula was connected to osmotic minipump via flexible tubing and fixed to the scalp with dental cement. The pump was then inserted subcutaneously between the scapula and the scalp incision was closed with surgical staples and swabbed with topical antiseptic and rats had a 5-day course of antibiotics.
Glucose Tolerance Test (GTT)
At different time points during the experiment (see Fig. 1), glucose tolerance tests were conducted. After overnight fasting, blood from the tail vein (approximately 4μl each time) was sampled prior to (0 min) and 15, 30, 60 and 120 min following a bolus injection of glucose (i.p, 2 g/kg body weight, Sigma- Aldrich,). Blood glucose levels (mg/dL) were analysed using a glucometre (HemoCueR, Sweden).
Analyses were conducted on basal (0 min) glucose levels and the area under curve (AUC) in response to the glucose challenge in each rat using Analysis of Variance (ANOVA).
Blood Insulin Assay
At the end of the experiment after overnight fasting, whole blood was collected immediately following sacrifice. Plasma was separated by centrifugation (3500 rpm, 25 min, at 4 °C) and stored at−20 °C until analysis. Plasma insulin was mea- sured using a Rat/Mouse Insulin ELISA Kit (Cat # EZRMI- 13K, Millipore, Germany) according to the manufacturer’s protocol and analysed using spectrophotometry (Molecular Device, France) at an absorbance level of 450 nm. Sample insulin concentrations (ng/ml) were calculated based on stan- dard insulin curves and ANOVA was used to analyse group differences.
Recognition Memory Task
Recognition memory was conducted in a circular open field (diameter 90 cm, height 50 cm, painted black) in a room containing multiple 3-dimensional cues. Before training, rats were habituated to the open field (5 min/day, for 3 days).
Following habituation, rats were given a sample phase (3 ses- sions of 4 min with a 4-min interval between sessions) where they explored three different objects constructed out of Lego™. At the first testing time point, we tested spatial rec- ognition memory by changing the location of one of the ob- jects during the sample phase following a 3 or 24 h delay, or object recognition memory by replacing one of the familiar objects for a novel one 24 h later. The test phase comprised a single session of exploration (4 min). Time spent exploring the objects was recorded via a video tracking system (ANYMAZE, Stoelting Co., USA). ANOVA was used to an- alyse the total time spent exploring objects during the sample phase to determine whether differences in exploration would indicate deficits in motor coordination or stress that may con- tribute to cognitive performance. Percent time spent exploring the novel location vs a mean of the two familiar locations was calculated to determine 50% as chance level using the Wilcoxon test and comparison between specific groups using Student’sttest.
Environmental Enrichment
In a separate group of rats, we tested whether a mild form of environmental enrichment (EE), developed in the laboratory [42], would affect memory performance and protein regula- tion in a subset of rats in the STZ-HJF and control groups infused with Aβor not. Groups of 4–5 rats were placed in a large wooden box (length 100 cm, width 80 cm, height 60 cm) containing junk objects for 3 h a day over 14 days. Objects were changed and repositioned every day. Rats were tested on the spatial recognition memory task after infusion of Aβbut prior to EE, and then several times after EE. In these experi- ments, we also tested memory with a 72-h delay after the sample phase.
Brain Tissue Preparation for Biochemical Analyses and Western Blotting Protocol
Rats were sacrificed by decapitation and CA1 of the hip- pocampus was dissected for analyses of expression and phosphorylation of proteins using immunowestern-blot- ting. Dissected tissue was immediately frozen in liquid nitrogen and kept at −80 °C for later use. Proteins were extracted from the frozen tissue in lysis buffer [43]; and Complete Protease Inhibitor Cocktail and PhosSTOP (Roche, France). Homogenised samples were incubated on ice for 30 min and centrifuged at 15,000 rpm for 15 min at 4 °C; the supernatant was recovered and stored at −80 °C. Protein concentrations were calculated using Bio-Rad protein assay (Bio-Rad, Germany) and samples were diluted with lysis buffer to give equal protein con- centration of 1 μg/μl.
We used a standard western blotting protocol where 20 μl of samples was denatured in 5 x Laemmli sample buffer and boiled at 95 °C for 5 min before loading onto gradient acrylamide gels (6–12%). Proteins were separated using constant voltage (150 V) between 1.5 and 3 h and t h e n t r a n s f e r r e d o n t o a n i t r o c e l l u l o s e m e m b r a n e (Amersham, GE Healthcare, Germany) by electro-blotting at a constant voltage (100 V; 90 min). Membranes were blocked with 5% non-fat dry milk (Bio-Rad, France) in TBS-T (Euromedex, France) and incubated overnight in primary antibodies at 4 °C with gentle shaking (see prima- ry antibodies and dilution in Online Resource 2).
Membranes were washed 3 times (5 min) in TBS-T and incubated in a horseradish peroxidase-conjugated anti- mouse/ rabbit immunoglobulin IgG secondary antibody (dilution 1:2000–1:10,000 in 5% BSA, Amersham, GE Healthcare, France) for 1–1.5 h at room temperature.
Membranes were rinsed × 3 (5 min) in TBS-T and proteins were reacted with Chemiluminescence ECL solution (Amersham, GE healthcare, France), exposed to film (op- timal exposure time for each antibody was maintained) and developed by hand. Membranes were subsequently washed and stripped (Re-blot plus; Millipore, Germany) and re- Fig. 1 Time line of experimental procedure. Protocol starts with HJF diet
at week 0. Thereafter, different treatments across time the 35-week period are depicted. HJF, human junk food; STZ, streptozotocin; SR, spatial
recognition memory tests; GTT, glucose tolerance tests; Aβ+ indicates time following the end of infusion of Aβ
incubated with other antibodies using the same procedure as described above. Protein bands were quantified using Gene Tools software (SynGene, Cambridge, UK). Total proteins were normalised to β-Actin and phosphorylated proteins to corresponding total protein. These were then normalised to the controls per gel as percent change. The relative changes in expression and phosphorylation of pro- teins were analysed statistically with Student’sttest deter- mined whether changes were significantly different from controls, and t test and/or ANOVA to determine group differences. The control group comprised a pool of naïve controls and those killed at either week 21 or 34 as prelim- inary analyses showed there were no significant differ- ences between these groups.
Brain Tissue Preparation for Immunohistochemical Analyses of A
βRats were deeply anaesthetised with pentobarbital (200 mg/kg, i.p.) and perfused transcardially with a solu- tion containing 4% paraformaldehyde in 0.1 m phosphate buffer and brains were postfixed overnight in the same perfusion solution at 4 °C, immersed for 6 d in phosphate buffer containing 30% sucrose, and frozen in chilled 2- methylbutane (−30 °C). Free-floating serial sections were pretreated with hydrogen peroxide to neutralise endoge- nous peroxidase activity. Non-specific binding sites were blocked with 4% normal goat serum. Sections were then incubated with the OC anti-Aβ polyclonal antibody (Euromedex, 1:3000) at 4 °C overnight. OC antibody rec- ognises amyloid fibrillary deposits but also a subset of Aβ oligomers [44]. Incubation using secondary biotinyl- ated goat anti-rabbit antibody (Vectorlabs) was then per- formed at room temperature for 2 h. The secondary anti- body was finally detected by the peroxidase-avidin-biotin technique (ABC Elite Kit, Vector labs) with 3,3′-diamino- benzidine (DAB, Sigma-Aldrich) as chromogen. Sections were then collected on Superfrost glass slides, air-dried and finally dehydrated and cleared in grading alcohols and xylene and mounted in Eurokitt mounting medium.
Sections were scanned with a NanoZoomer 2.0-RS slide scanner (Hamamatsu Photonics, pixel size 0.25 μm2) to generate virtual slides. Following Aβimmunohistochem- istry and scanner digitization, 3 regions of interest (dorsal hippocampus, prefrontal cortex, corpus callosum) were manually outlined on microphotographs (3 sections/re- gion/rat). The optical density (OD) of each brain area was assessed using the MCID Elite image analysis soft- ware (Linton, Cambridge, UK). OD was normalised rela- tive to the staining of the corpus callosum, which served as baseline value to obtain relative optical densities (ROD) of the prefrontal and hippocampal regions.
Statistical analyses were conducted using the non- parametric Kruskall-Wallis and Mann Whitney tests.
Results
We conducted experiments over 35 weeks to determine whether coupling STZ injections with HJF would induce clas- sic T2D characteristics and whether infusion of Aβ42 would exacerbate a functional readout (hippocampal-dependent memory) and basal regulation of protein in and associated with IR/PI3K/Akt signalling in CA1 of the hippocampus (see timeline of treatments depicted in Fig.1).
T2D Characteristics: Food Intake and Weight Gain
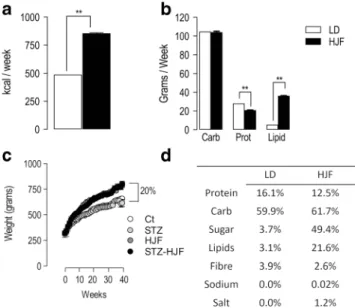
As the aim of our experiment was to mimic human food con- sumption rather than an extensive study on the effect of dif- ferent nutritional categories of food stuffs, we made cursory analyses of the food consumption over a 6-week period in the middle of the experiment in a subgroup of rats fed laboratory diet (control and STZ; n = 13) and cafeteria diet (HJF and STZ-HJF;n= 11). Rats fed HJF, consumed nearly twice the amount of calories per week (853 kcal) compared with those fed Laboratory Diet (LD, 488 kcal; p< 0.01 Wilcoxon test;
Fig.2a). In terms of the major nutritional food groups, rats fed HJF consumed about the same amount of carbohydrates as those fed LD (p > 0.05; Wilcoxon test); less overall protein content (p< 0.01; Wilcoxon test) but more lipids (p< 0.01;
Wilcoxon test, Fig. 2b). However, the amount of sugar contained in the HJF was approximately 49.4% whereas in LD it was 3.7%, and protein content in HJF was mainly de- rived from animal proteins whereas it was at least 66% vege- table proteins in LD. The other major differences in nutritional composition are shown in Fig.2d.
Weight was measured on a weekly basis; at the start of experiment, all rats had the same weight (F < 1), but across time, those fed HJF (HJF and STZ-HJF) gained significantly more weight than those groups fed LD (controls and STZ). By the end of the experiment, rats fed HJF gained approximately 25% more weight than those on the control diet (F(3,96) = 12.78;p< 0.0001; see Fig.2c).
T2D Characteristics: Plasma Glucose Levels
We conducted 4 glucose tolerance tests (GTT) at different time points throughout the experimental period (see timeline;
Fig.3a) and used ANOVA and Tukey post hoc analyses. Basal glucose levels in the first (week 12: F(3,82) = 2.79;p< 0.05) and second test (week 19: (F(2,57) = 5.34; P < 0.01) were modestly but significantly increased only with STZ-HJF treat- ment compared with controls. By the third (week 25:
F(3,31) = 9.71; p < 0.001) and fourth (week 33: F(3,31) =
8.84;p < 0.001) tests, basal glucose was greatly elevated in STZ-HJF treated rats compared with controls but also with STZ and HJF treatment (all post hoc valuesp< 0.05; Fig.3b).
At the same time points, we also assessed plasma glucose levels following a glucose challenge using a standard glucose tolerance test (GTT) and analysed the area under the curve (AUC). In all 4 tests, STZ-HJF treated rats showed a signifi- cantly greater AUC value compared with all other groups (week 12: F(3,81) = 21.63;p < 0.001; week 19: F(2,57) = 12.17;p< 0.001; week 25: F(3,29) = 7.33; p< 0.001; week 33: F(3,32) = 12.42;p< 0.001; all post hoc analyses;p< 0.05;
Fig.3c).
Repeated measures ANOVA and post hoc analyses on the subgroup of STZ-HJF treated rats tested at all time points showed a significant difference in basal glucose levels (F(3,18) =1.43;p < 0.01) and AUC (F(3,18) = 6.48; p <
0.01) between the first 2 and the last two tests (post hoc anal- yses,p< 0.05; Fig 3b, c) and this is reflected in Fig.3d, e showing glucose curves per group in mg/dL in the first and last test. In summary, only STZ-HJF treated rats showed ob- vious hyperglycemia as they had a consistent increase in basal fasting plasma glucose and impaired glucose tolerance in re- sponse to glucose challenge that evolved with time. Moreover, repeated measures ANOVA and post hoc analyses on the sub- group of STZ-HJF treated rats tested at all time points (F(3, 18) =1.43;p< 0.01) showed a significant difference in glucose levels between the first 2 tests and the last two tests (post hoc, p< 0.05).
T2D Characteristics: Basal Plasma Insulin Levels
At the end of the experiment, plasma insulin was measured using ELISA. ANOVA showed very high levels in rats fed HJF (n= 8) that is a common feature of obesity [19]; with a slight but non-significant increase in rats in the STZ group (n= 5) compared with controls (n= 7). In STZ- HJF treated rats insulin levels at week 21 (n = 5) were hugely increased above control levels and even that observed in rats in the HJF group. However, by the end of the experiment (week 35;n= 4), this early increase was dramatically decreased, such that there was no longer any difference between this group and controls (F(4,19) = 32.83;p< 0.001; Fig.4a).
To compare the relationship between glucose and insulin, we normalised plasma insulin and glucose levels, in the last test to their corresponding controls (Fig.4b). In rats in the HJF group, there was a huge and significant increase in insulin levels compared with relatively normal levels of glucose (t = 7.89; p < 0.001) suggesting either insulin resistance and/or hyperinsulinemia. At week 21, STZ-HJF treated rats showed a similar relationship between glucose and insulin as that
Fig. 2 Food intake and weight gain.aShows the relative caloric intake in rats fed LD (n= 13) or HJF (n= 11).bIndicates the consumption of major food groups, Carb, Prot, and Lipids.cWeight gain in the 4 major groups Ct and STZ alone (both fed LD), HJF alone and STZ-HJF (both fed HJF).
d Percentage of nutritional components in LD and HJF. STZ, Strepotozotocin, HJF, human junk food diet; LD, laboratory diet; Carb, carbohydrates; Prot, protein. **p< 0.01
Fig. 3 Plasma glucose regulation.aDepicts the time line and numbers of animals tested in each group.bShows evolution of fasted basal glucose levels (0-time point; mg/dL) across the 4 time points.cShows area under curve (AUC) of individual response curves to a glucose challenge.
Statistical analyses were conducted on AUC, figuresdandeshow the mean group differences of the response curves in first test (d) and the last test (e) in mg/dL. Data is represented as mean ± SEM; *p> 0.05; **p<
0.01; ***p< 0.001. NB the HJF group alone was not test at GTT2
observed with HJF, inasmuch as there was relatively no change in glucose levels and substantially high levels of insu- lin (t = 18.73;p< 0.001). In contrast, by week 35, STZ- HJF treated rats showed an increase in glucose with a relative de- crease in insulin compared with glucose levels (t = 2.36;p<
0.05) and with insulin levels at the earlier time point (t = 5.35;
p< 0.01), with no difference in the ratio of glucose to insulin (t = 0.69;p> 0.05). As only the STZ-HJF treatment induced the classic signs of a T2D phenotype, we subsequently fo- cussed on this group for behavioural experiments. Rats injected with STZ alone or were fed HJF diet alone did not undergo memory tested or were subjected to environmental enrichment.
Memory Deficits Induced by STZ-HJF Treatment
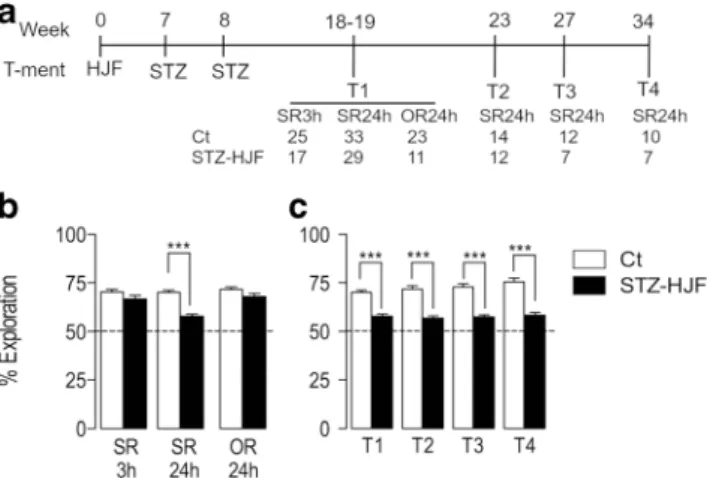
To test whether the STZ-HJF treatment impacted memory, we tested recognition memory 4 times throughout the experimen- tal period (see time line; Fig.5a). In the first test at approxi- mately week 18, we tested rats using spatial recognition mem- ory, where the location of one object was changed following a 3-(SR3h) or 24-(SR24h) hour delay, and object recognition, where one object was replaced with a novel one following a 24-(OR24h) hour delay. We found rats treated with STZ-HJF showed no deficit compared with control in spatial recognition with a 3-h delay (t = 1.72;p< 0.05). However, with a 24-h delay, there was a modest but significant deficit compared with controls (t = 7.3;p < 0.0001); albeit their performance was significantly greater than chance level (Wilcoxon test:
p< 0.0001 compared with 50%). In addition, there was no deficit in novel object recognition (OR) at 24 h (t = 1.83;
p< 0.05, Fig.5b); therefore, we continued only with spatial recognition with a 24-h delay. Here, we found the same mod- est deficit in the subsequent tests compared with controls (week 23; t = 6.82; p < 0.0001; week 27: t = 6.73; p <
0.0001; week 34: t = 6.3p< 0.0001) but performance was still significantly above chance (allp< 0.001, Wilcoxon test). In all 4 SR24h tests, during the sample phase, rats showed equal exploration of the 3 objects compared with the control group
(all tests,p> 0.05; data not shown), suggesting the STZ-HJF treatment had no discernible effect on locomotor activity, stress or the normal tendency for exploring objects.
Together, this suggests that STZ-HJF treatment impaired spa- tial recognition memory, but this was a modest deficit.
Moreover, the impairment remained remarkably stable across time (Fig.5c).
Infusion of A
βAlone, and in Conjunction with STZ-HJF Treatment on Spatial Recognition Memory
We tested rats on spatial recognition memory with a 24-h delay prior to infusion of Aβto establish a baseline level of performance, and at 3 time points after (see time line Fig.6a).
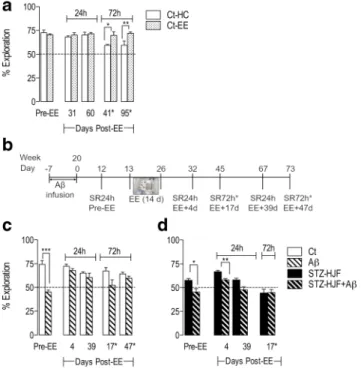
Quite simply, control rats infused with Aβshowed a deficit 16 days following infusion compared with non-infused coun- terparts (t = 10.92;p< 0.001), but recovered to control levels by day 44 post infusion (t = 1.68;p> 0.05) and this was main- tained at 96 days post infusion (t = 1.03;p> 0.05; Fig.6b).
As expected, 16 days following infusion of Aβrats with STZ-HJF treatment showed a deficit in performance as it dropped to chance level, compared with non-infused STZ- HJF treated rats (t = 4.57; p < 0.0001) and this deficit was maintained for the next two tests (44 and 96 days post-Aβ infusion) compared with non-infused STZ-HJF treated rats (day 44: t = 5.97;p< 0.001; day 96: STZ-HJF: t = 5.05;p<
0.001; Fig.6c). These data suggest infusion of soluble Aβ42 alone induced a temporary deficit in performance in a spatial recognition task; however, on a T2D background, the deficit is prolonged.
Fig. 4 Plasma insulin regulation.aPlasma insulin levels (ng/ml) at the end of the experiment in the 4 experimental groups.bRelationship between glucose (solid bars) at the last test and insulin (hatched bars) when killed. Data are normalised to respective control levels and are represented as % change. NB, STZ-HJF group is measured at two time points. Data are represented as mean ± SEM; ***p< 0.001. Ct (n= 7);
HJF (n= 8); STZn= 5); STZ-HJF-21 W (n= 5); STZ-HJF-35 W (n= 4)
Fig. 5 Effect of STZ-HJF treatment on different forms of recognition memory.a Depicts the time line of memory testing and numbers of animals at each test.bShows the per cent exploration of the novel loca- tion at 2 different time intervals and percentage exploration of a novel object with a 24-h delay.bShows % exploration of the novel location with a 24-h delay at different time points throughout the experiment. Data is represented as mean ± SEM; ***p< 0.001. SR3h, spatial recognition memory with a 3-h delay; SR24h, spatial recognition memory with a 24-h delay; OR24h, object recognition memory with a 24-h delay
Beneficial Effect of Environmental Enrichment on Recognition Memory Performance
We first tested whether EE had a beneficial effect on memory performance, using 2 delays between sample and test phases (24 and 72 h) at different time points following EE. We found enriched rats showed no beneficial effect compared with home-caged rats when the retention delay was 24 h (31 days post EE: t = 0.75;p > 0.05; 60 days post EE: t = 0.38,p >
0.05). When the delay was extended to 72 h, enriched rats maintained the same level of performance as they did with a 24-h delay; however, in home-caged rats, although their per- formance was significantly greater than chance level (Wilcoxon test,p< 0.01 at both time points), it was signifi- cantly poorer compared with enriched rats (t = 2.64;p< 0.05 and t = 2.68;p< 0.05 at both time points). These data suggest with a 24-h delay, all rats had reached asymptotic level of performance; however, when increasing the demand on mem- ory by increasing the retention delay, EE endowed a long lasting beneficial effect (Fig.7a).
We used the same protocol to test whether EE could benefit rats infused with Aβalone and those receiving STZ-HJF and STZ-HJF + Aβtreatment (time line, Fig.7b). The first test (24-h delay) was after Aβinfusion but prior to EE and served as a baseline effect for EE. Aβinfusion in both controls (t = 6.71;p < 0.001) and STZ-HJF treatment (t = 3.2; p < 0.05) induced poorer performance when compared with that of their non-infused counterparts as we have shown in the previous experiment (Fig.7c, d). The first two tests post EE were con- ducted with a 24-h delay and control rats infused with Aβ showed equivalent performance compared with non-infused
controls (EE+4 days: t = 1.56;p> 0.05; EE+39 days: t = 0.97;
p > 0.05; Fig.7c). EE+4 days is within the time window in which Aβimpairs performance, but EE+39 days is out with the time window, confirming the recovery is stable (Fig.6b).
However, when a 72-h delay was imposed in tests outside the Aβtime window; performance in Aβ-infused rats dropped 17 days post EE, although did not reach statistical significance compared with controls (t = 2.18; p = 0.07). Performance, however, recovered to control levels (t = 1.56;p > 0.05) by the last test (EE+47 days, Fig.7c). Together, the data suggests when the retention interval is increased, imposing a greater demand on memory, the deleterious effect of Aβis still ob- served at 17 days post EE, but has recovered by EE+47.
With the first test following EE (EE+4 days), both STZ- HJF treated rats (t = 9.56.0;p< 0.001; pairedttest) and those infused with Aβ(t = 2.8;p< 0.05) showed improved perfor- mance compared with that prior to EE; however, despite the improvement, STZ-HJF-treated rats infused with Aβhad sig- nificantly poorer performance than non-infused counter parts (t = 4.21; p < 0.01). By the second test (EE+39 days), the beneficial effect observed 4 days post EE in both groups had dropped back to pre-EE levels with no significant difference
Fig. 6 Effect of Aβalone/in conjunction with STZ-HJF treatment on spatial recognition memory with a 24-h delay.aShows the time line of testing and the number of animals per group.bHistograms represent percent exploration of the novel location at different time points in con- trols and rats infused with Aβalone.cHistograms represent % explora- tion of the novel location at different time points in STZ-HJF and STZ- HJF + Aβtreated rats. NB, non-infused groups are the same as those depicted in Fig.5. Data is represented as mean ± SEM; ***p< 0.001
Fig. 7 The effect of environmental enrichment (EE) on control and STZ- HJF treated rats infused with Aβ.aAn initial experiment determined the impact of EE (n= 5) in control rats compared with home-caged (n= 5) at different times following EE. Time-delay between the sample and test phase is either 24 or 72 h.bRepresents the time line of experimental testing for the effect of EE on STZ-HJF treated and control rats.c Memory capacity in control rat infused with Aβor not; prior to and at different time points after EE.dRepresent STZ-HJF treated rats infused with Aβor not at the same time points as control rats. Data is represented as mean ± SEM; *p< 0.05; **p< 0.01; ***p< 0.001. Ct (n= 4); Aβ(n= 5); STZ-HJF (n= 4); STZ-HJF+ Aβ(n= 5)
between the 2 time points (STZ-HJF: t = 0.15;p> 0.05; STZ- HJF + Aβ: t = 2.48;p< 0.05; pairedttests). With the first test with a 72-h delay (EE+17 days), both groups were at chance level (STZ-HJF: p > 0.05; STZ-HJF + Aβ: p > 0.05;
Wilcoxon test), suggesting the beneficial effect of EE was short lasting; therefore, these rats underwent no further testing (Fig.7d).
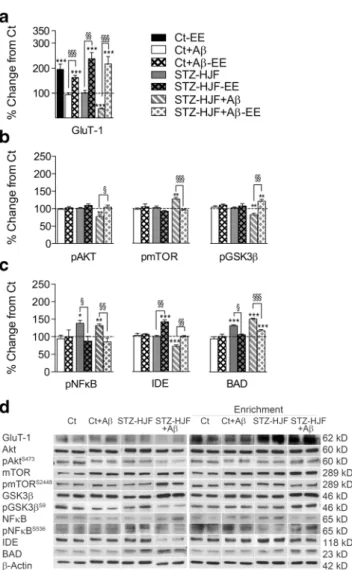
Protein Regulation by STZ-HJF Treatment Coupled with Infusion of A
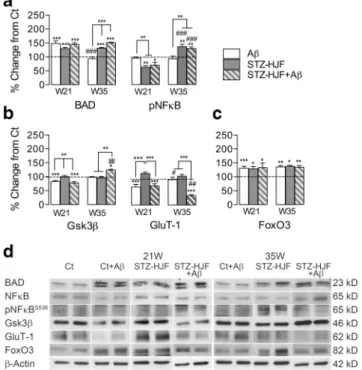
βWe found the combined STZ-HJF + Aβtreatment regulated all protein expression and phosphorylation with the exception of expression of Akt and NFκB compared with controls at either week 21 (3 days post infusion of Aβ) or week 35 (17 weeks post infusion of Aβ), and, although phosphoryla- tion of BAD was increased at 21 weeks, it was not sustained (Table1, columns F, G). In terms of the evolution of changes, we found 4 different patterns of regulation. (1) Those proteins regulated at 21 weeks and maintained, and in general, these constituted an increase mainly in expression of mTOR, BAD, FoxO3 and phosphorylation of mTOR (seepvalues indicated by asterisks in Table1); albeit pmTOR had significantly re- duced phosphorylation by week 35 compared with week 21 (t = 3.83;p< 0.01). However, comparison of phosphorylation of mTOR against expression of mTOR respective proteins at either time point was no different from that of controls (F(1,3) = 0.24;p> 0.05; Table1). (2) A second pattern was a change in levels at 21 weeks that was exacerbated by 35 weeks that included a decrease in expression of GluT-1 (t = 5.87;p<
0.01). (3) Thirdly, there was a change in one direction at 21 weeks that was reversed above control levels including an early decrease that reversed to increased expression of Gsk3β (t = 4.49; p < 0.01) and phosphorylation of NFκB (t = 6.42; p< 0.001) and conversely, the increase in pGsk3β reversed to a decrease (t = 4.21;p < 0.01). (4) Finally, there was a late developing increase in the expression of APP, and decrease in expression of IDE, Beclin-1 and pAkt in the ab- sence of change at week 21 (Table1).
Protein Regulation by STZ-HJF Treatment Alone
Only a subset of proteins were regulated by STZ-HJF treat- ment alone compared with those regulated by the group in- fused with Aβ(Table1, columns B, C); and in general, most of these proteins were regulated in the similar manner to the STZ-HJF + Aβgroup. These included an increase in expres- sion of BAD and FoxO3 at week 21 that was maintained up to 35 weeks. Similarly, regulation of pNFκB went from an early decrease to a late increase (t = 8.17;p< 0.001; Fig.8a,c). The only difference was in regulated expression of mTOR, which although was increased at week 35, as with the STZ-HJF + Aβ group, it was not increased at the early time point
(Table 1). Importantly, STZ treatment alone had negligible effects on protein regulation; it induced an increase in expres- sion of mTOR that was significantly elevated compared with control rats (t = 3.05; p < 0.01) and, although less than that induced by the combined treatment, it was not a significant difference (t = 0.92;p> 0.05). HJF alone also induced a sim- ilar increase in mTOR (t = 2.75;p < 0.05) FoxO3 (t = 4.18;
p< 0.001) that was equivalent to the levels induced by STZ- HJF and STZ-HJF + Aβtreatments (p values > 0.05). This suggests, in particular, HJF might be responsible for the changes in some of these proteins induced by STZ-HJF treat- ment (Online Resource 3).
Protein Regulation by A
βAlone
As with STZ-HJF treatment, Aβalone induced only a subset of changes in protein levels compared with STZ-HJF treated rats infused with Aβ. Of the proteins regulated by Aβ, the majority of them showed early regulation at 21 weeks (3 days post Aβinfusion) but were not sustained that would argue for the peptide being eliminated. These include an early decrease in expression of Gsk3βand GluT-1 and an increase in expression of BAD. This is in keeping with the early deficit in memory performance that recovers with time. Expression of FoxO3 was increased at 21 weeks and maintained, but similarly to STZ-HJF treatment. Finally, in a similar manner to STZ-HJF treatment, there was a delay in the increase in expression of mTOR at week 35 (Table 1 columns D, E).
This synthetic form of Aβ42 induces small round olig- omers with diameters of 3 to 30 nm analysed by transmis- sion electron microscopy (TEM; Fig.9a) and remains rel- atively stable for a long time [41]. We also found no evi- dence of fibrillar or classic aggregated Aβ in the dorsal hippocampus at the end of infusion of the peptide com- pared with control rats (U = 4; p > 0.05, Mann Whitney) or between control (n= 4) and STZ-HJF treated rats (n= 3;
H = 4.79; p > 0.05, Kruskall-Wallis) at the end of the ex- periment (Fig. 9b). At week 35, OC immunostaining showed weak but significant diffuse staining in all groups (Fig. 9c) that was absent from control negative sections (primary antibody omission, data not shown) that contrasted sharply with control positive sections (tissue from an old APPxPS1 transgenic mouse harbouring severe brain amyloidosis, data not shown). OC immuno staining therefore suggests that Aβwas in a prefibrillar form [44].
Although we did not biochemically analyse Aβ42 and therefore cannot whether infusion of the peptide was still present in the brain by the end of the experiment, the data suggest that at least it was non longer at an effective level to induce a deficit in memory and dysregulation of many proteins.
Table1Valuesofgroupmeansofopticaldensitypresentedasa%changefromcontrolrats ABCDEFGHIJK STZ-HJF-W21STZ-HJF-W35AβW21AβW35STZ-HJFAβW21STZ-HJFAβW35Ct-EE-W35Aβ-EE-W35STZ-HJFEE-W35STZ-HJF-Aβ-EE-W35 3dayspostAβ17weeks postAβ3dayspostAβ17weeks postAβ17weeks postAβ17weeks postAβ17weekspostAβ17weekspostAβ 9–10weeks postEE9–10weeks postEE9–10weekspostEE9–10weekspostEE n=5n=4n=6n=5n=5n=5n=4n=4n=5n=5 Akt104.8±2.9100.5±2.597.7±2.8105.9±2.0100.7±5.4108.9±4.6103.0±3.894.2±3.9104.4±4.599.5±4.5 pAkt105.8±7.3102.8±4.295.4±7.198.0±2.8100.2±5.5⇓77.6±4.7**♯99.2±7.4102.7±3.3109.0±4.4104.2±5.9§ mTOR100.1±7.6⇑141.4±3.5**♯98.7±12.0⇑143.4±9.0***♯⇑148.7±6.4***⇑159.2±9.3***103.4±0.8⇑144.2±7.4***§⇑133.9±3.7**⇑172.2±10.8*** pmTOR92.23±7.1102.1±3.591.2±7.197.0±4.1⇑165.9±24.2***⇑126.9±4.8**♯101.3±4.7104.0±8.391.8±2.395.3±2.0§ Beclin-1106.9±5.298.8±2.1106.5±4.494.3±6.2109.1±8.4⇓75.6±1.9***♯90.7±2.491.0±6.490.7±6.0⇓75.5±9.8** Gsk3β100.4±4.294.8±5.9⇓82.2±3.9***97.6±2.6⇓77.3±4.8***⇑124.0±2.7***♯99.7±2.597.2±4.993.9±5.9⇑127.1±4.9** pGsk3β108.3±2.2102.0±2.495.7±8.0104.3±3.9⇑149.5±15.3***⇓82.3±4.5**♯106.4±8.1110.1±8.1107.4±6.8⇑120.7±5.9***§ BAD⇑129.8±4.3***⇑131.8±2.4***⇑148.0±10.2***93.7±6.4♯⇑145.0±5.8***⇑150.9±2.2***103.4±2.2101.2±6.0§105.9±2.2§⇑117.2±3.3***§ pBAD101.4±2.495.8±3.493.4±9.1106.7±4.7⇑135.0±4.3***100.1±3.4♯107.2±4.499.3±6.396.0±3.699.0±2.0 FoxO3⇑128.7±8.0*⇑140.5±3.5**⇑131.9±8.4*⇑132.2±5.2**⇑132.6±16.4*⇑133.8±6.5**100.2±9.3⇑136.1±15.2*⇑144.0±8.8**⇓136.4±8.5** IDE99.1±2.299.8±2.8106.0±4.2102.8±6.598.3±6.7⇓72.2±4.17***♯104.0±2.5106.2±1.7⇑141.9±5.7***§98.9±3.8§ APP95.5±6.293.6±4.896.4±3.690.9±3.6109.6±0.9⇑135.5±2.4***♯95.5±2.299.0±1.2102.9±0.7⇑122.6±8.** NF|B108.5±8.299.7±4.5102.8±3.894.6±7.7106.5±3.990.2±5.3106.4.7±16.195.3±8.989.9±17.093.5±12.9 pNF|B⇓64.9±4.5**⇑139.1±7.3**♯97.6±3.394.9±9.2⇓72.5±8.4*⇑132.5±4.1**♯106.6±16.1100.7±18.488.8±12.6§86.6±9.5§ Glu-T1115.7±4.3105.5±5.9⇓67.9±7.3***93.2±7.9♯⇓72.0±5.3***⇑36.5±2.8***♯⇑195.3±21.1***§⇑162.7±9.0***§⇑237.4±24.5***§⇑217.1±29.0***§ *IndicatedwheretherevaluesaresignificantlychangedfromcontrolsusingStudent’sttest.***p<0.001,**p<0.01,*p<0.05.Arrowsindicatethedirectionofchange.#Indicateswhereproteinslevels measuredat35weeks(17weekspostAβinfusion)aresignificantlychangefromtheearliertimepointof21week(3dayspostAβinfusion).§AppliestoEEonlyandindicateswhereEEinducesa significantchangecomparedwithnonEEcounterparts
Impact of Environmental Enrichment on Expression and/or Phosphorylation of Proteins
Protein regulation was tested 9–10 weeks following the end of EE at week 35, as in all other experiments. We first asked what the impact EE alone was and found only Glu-T1 expression was increased in control enriched animals (t = 8.32; p <
0.001), but also in all other groups compared with non enriched counterparts (Table1, column H, Fig.10a); however, there was no significant difference between groups (F(1,3) = 0.29; p > 0.05). We then asked whether EE could reverse changes induced by STZ-HJF treatment coupled with infusion of Aβ. Specific to STZ-HJF + Aβtreated rats, EE rectified the decrease in pAkt (t = 3.34;p < 0.05) and the increase in pmTOR (t = 6.56;p < 0.001) to control levels and induced an increase in pGsk3βcompared with controls (t = 2.84;p<
0.01) and non-enriched counterparts (t = 4.93; p < 0.01,
Fig.10b). However, as both increase in expression of mTOR and Gsk3βwere not modified by EE (see Fig.11), the relative change in phosphorylation of these proteins suggests Akt has a negligible effect. EE also modified phosphorylation of pNFκB and expression of IDE and BAD induced by STZ- HJF treatment whether infused with Aβ or not (Table 1, Fig. 10c). It reversed the increase in pNFκB induced by STZ-HJF alone (t = 3.22;p < 0.05) and STZ-HJF + Aβ(t = 4.03;p< 0.01) to control levels.
Although STZ-HJF treatment alone did not modify expres- sion of IDE, EE induced a significant increase compared with controls (t = 7.23; p < 0.001) and non-enriched counterparts (t = 6.05;p< 0.001) and increased expression of IDE in STZ- HJF + Aβtreated rats compared with non-enriched counter- parts (t = 4.73; p < 0.01) that only reach control levels (Table1, columns G, K). Similarly, the increase in expression of BAD was significantly decreased in both groups compared with non-enriched counterparts (STZ-HJF: t = 8.1;p< 0.001;
STZ-HJF + Aβ: t = 8.06;p< 0.001); however, the decrease in STZ-HJF + Aβtreated rats was still elevated compared with controls (t = 4.46;p< 0.001; Fig.10c), suggesting that in both enriched and non-enriched rats, phosphorylation of BAD in both groups was still in an active state. Finally, STZ-HJF + Fig. 8 Regulation of proteins specific to STZ-HJF + Aβtreatment.
Group means±SEM are represented for Ct + Aβ(n= 5); STZ-HJF (n= 5); STZ-HJF + Aβ(n= 4) at W21 and Ct + Aβ(n= 5); STZ-HJF (n= 5);
STZ-HJF + Aβ(n= 5).aRepresents changes in basal proteins specific to STZ-HJF + Aβtreatment that develop by the late time point (35 weeks);
brepresents changes in basal proteins specific to STZ-HJF + Aβtreat- ment that evolve across time;csample western blots represent the group mean of each protein, including the control group (n= 16). NB as statis- tical analyses was based on the % change from control; the representative band is the same in Figs.11and12. Asterisks above histograms represent significant change from controls, and those above the bars represent sig- nificant differences between groups; *,p< 0.05; **,p< 0.01; ***,p<
0.001. # indicates difference between each group at the two different time points, #,p< 0.05; ##,p< 0.01; ###,p< 0.001
Fig. 9 Regulation of proteins induced by treatments independently.
Group means±SEM are described in the legend of Fig.8.aProtein regulation we attribute to STZ-HJF treatment alone.bProtein changes in which infusion of Aβat least contributes to changes induced by STZ- HJF + Aβ.cIncrease in Fox03 is regulated by all treatments indepen- dently.dSample western blots represent the group mean of each protein, including the control group (n= 16). Asterisks indicate significant chang- es from control rats, *,p< 0.05; **,p< 0.01; ***,p< 0.001. # indicates differences between each group at the two different time points, #,p<
0.05; ##,p< 0.01; ###,p< 0.001
Aβregulation of Gsk3β, APP and Beclin-1, and regulation of specific to STZ-HJF rats infused with Aβand regulation of FoxO3 and mTOR induced by all treatments were immune to EE (Table1, columns J, K; Fig.11).
Discussion
The aim of these experiments was to determine whether a T2D phenotype could exacerbate deregulation of proteins in CA1 in or associated with IR/PI3K/Akt signalling induced by infu- sion of soluble Aβalone. Our data show that when a soluble form of Aβ42 is infused in rats with a T2D profile, it induces long-lasting impairment in hippocampal-dependent memory and alteration of proteins in or associated with insulin/PI3K- Akt signalling in CA1. Treatment to induce T2D and infusion of Aβalone had differential impact on memory processing and regulation of proteins. Finally, a mild form of environ- mental enrichment had a temporary beneficial effect on mem- ory and could reverse some but not all changes in proteins.
Although a number of the results we found find are subtle, it likely reflects changes induced in the early stages of AD and suggests they present a good case for some of the mechanisms by which T2D could pose a risk factor for AD.
Development of a T2D Phenotype
To our knowledge, this is the first time subdiabetogenic doses of STZ have been couple with human junk food to induce a characteristics of T2D. Mostly, STZ injections are coupled
with calibrated high fat and/or high calorific diets as together they induce inflammation induced destruction ofβpancreatic cells, impaired insulin secretion and stable hyperglycemia [37] and has been reported in numerous studies models [38].
Although consumption of HJF compared with calibrated obe- sity inducing diets inheritantly adds more variance into the results, what is lacking in calibrated diets is the presence of artificial additives such as preservatives, emulifiers, and colourants. Alone, food additives are capable of altering the Fig. 10 Aβ42 peptide.aTEM image of Aβoligomers following 1 week
of incubation in aCSF at 37 °C. Small, round oligomers could be detected with diameter in the range of 3 to 30 nm. Scale bar 200 nm.bRelative optical density (mean ± SEM) of Aβimmunoreactivity in control (n= 4) and Aβ(n= 3) infused rats 7 days after infusion of Aβand at 35 weeks post infusion in control (n= 4) Aβ-infused rats (n= 3), STZ-HJF treat- ment (n= 3) and STZ-HJF + Aβtreatment (n= 3).cMicrophotographs of the dorsal hippocampus show diffuse staining after incubation with OC antibody. Scale bar 2 mm
Fig. 11 Beneficial effect of environmental enrichment (EE) on proteins regulated by different treatments. Group means±SEM are represented for enriched groups: Ct-EE (n= 4); Ct + Aβ-EE (n= 4); STZ-HJF-EE (n= 5); STZ-HJF + Aβ-EE (n= 5) at W21 and Ct + Aβ(n= 5); STZ-HJF (n= 5); STZ-HJF + Aβ(n = 5). Histograms for corresponding non enriched groups are those represented in Figs.8and9.aShows changes specific to EE as it induced change in control rats. However, it also induced changes in all other groups.bIndicates changes induced by EE in STZ-HJF + Aβtreated rats.cIndicates change in both STZ-HFJ groups whether infused with Aβor not.dSample western blots (NB, representative blots for controls and non enriched groups are the same as those in Figs.8and9). Asterisks indicate significant differences from control rats; *,p< 0.05; **,p< 0.01; ***,p> 0.001. § indicates where EE induced a significant difference compared with non-EE counter parts in each group; §,p< 0.05; §§,p< 0.01, §§§,p< 0.001