O R I G I N A L A R T I C L E
Molecular biomarker candidates of acute kidney injury in zero-hour renal transplant needle biopsies
Reka Korbe´ly,1,2* Julia Wilflingseder,1,3* Paul Perco,3,4Alexander Kainz,1,3Robert M. Langer,2 Bernd Mayer4and Rainer Oberbauer1,3
1 Department of Nephrology, KH Elisabethinen, Linz, Austria
2 Department of Transplantation and Surgery, Semmelweis University, Budapest, Hungary 3 Department of Nephrology, Medical University of Vienna, Vienna, Austria
4 Emergentec Biodevelopment GmbH, Vienna, Austria
Introduction
Kidney transplantation is the preferred treatment method for patients suffering from end-stage renal diseases.
Delayed graft function (DGF) is the main risk factor for shortened allograft survival and acute rejection is more frequent in allografts with DGF [1]. The incidence of DGF – defined as need for more than one dialysis within the first week after transplantation – is roughly 25% in transplant recipients from deceased donors [1]. Despite improvements in immunosuppressive therapy, this high rate remained unchanged in recent years.
Several possible risk factors have been identified for DGF such as donor age, the amount of panel reactive antibodies, prolonged cold ischemic time, low pretrans- plant mean arterial blood pressure (<100 mmHg) in the
recipient, or transplantation of kidneys from female donors to male recipients. Cold ischemic time is only a minor confounder for graft survival if it is <1 day [2].
Next to these clinical risk factors, it has been shown that deceased donor kidneys with subsequent postischemic DGF exhibit an activation of genes belonging to the immune response, cell communication, and apoptosis superfamilies [3].
In current clinical practice, DGF is typically diagnosed by serum creatinine concentration measurements. Unfor- tunately, serum creatinine is an unreliable indicator dur- ing acute changes in kidney function. The quest to improve early diagnosis of DGF is an area of intense research [4].
Various immunologic and nonimmunologic patho- mechanisms have been discussed in the literature to be
Keywords
acute kidney injury, biomarker, microdissection, qRT-PCR, renal transplantation.
Correspondence
Rainer Oberbauer MD, MSc, FASN,
Department of Nephrology, Medical University of Vienna, Wa¨hringer Gu¨rtel 18-20, 1090 Vienna, Austria. Tel.: +43 732 7676 4305;
fax: +43 732 7676 4306; e-mail: rainer.
oberbauer@meduniwien.ac.at
*Authors contributed equally.
Received: 4 June 2010
Revision requested: 28 June 2010 Accepted: 7 August 2010
Published online: 3 September 2010 doi:10.1111/j.1432-2277.2010.01162.x
Summary
The aim of this study was to assess gene expression levels of four biomarker candidates [lipocalin 2 (LCN2), the kidney injury molecule 1 (HAVCR1), netrin 1, and the cysteine-rich, angiogenic inducer, 61] in the tubulointerstitial and the glomerular compartment of zero-hour kidney biopsies in order to pre- dict developing delayed graft function (DGF). Thirty-four needle kidney biopsy samples of deceased donors were manually microdissected. Relative gene expression levels were determined by real-time RT-PCR. For the validation of the biomarker candidates, we calculated a mixed model comparing kidneys with DGF, primary function and control samples from the healthy parts of tumor nephrectomies. Significant biomarker candidates were analyzed together with donor age in multivariable regression models to determine the prognostic value. Expression levels of LCN2 and HAVCR1 in the tubulointerstitium were significantly upregulated in the DGF group (LCN2: fold change = 3.78, P= 0.031 and HAVCR1: fold change = 3.44, P= 0.010). Odds ratios of both genes could not reach significance in the multivariable model together with donor age. The area under the curve of the receiver operating characteristic ranges between 0.75 and 0.83. LCN2 and HAVCR1 gene expression levels in zero-hour biopsies show potential to act as early biomarkers for DGF.
responsible for cellular damage in renal allografts [3,5].
Microdissection of circumscribed nephron segments in kidney biopsies has been demonstrated to be an impor- tant tool in renal gene expression analysis due to the complex architecture of the kidney [6].
For this study, the expression of four candidate genes, which are associated with cellular damage, was studied in renal allografts developing DGF. We found four reported biomarkers, which are already associated with DGF. Kid- ney injury molecule 1 (KIM1, also known as HAVCR1) is a transmembrane type I epithelial cell protein with Ig-like and mucin domains in its ectodomain and is believed to play a role in tubulointerstitial damage. KIM-1 is nonde- tectable in normal kidneys but tubular KIM-1 expression was observed in human renal biopsies after ischemic or toxic acute tubulus necrosis. KIM-1 was upregulated in protocol biopsies with acute tubular injury and is cur- rently under investigation as a single molecular biomarker to predict acute kidney injury (AKI) at an early stage [7,8]. Neutrophil gelatinase-associated lipocalin (NGAL, also known as lipocalin 2 or LCN2) is currently the most promising novel biomarker. Human NGAL was originally identified as a 25-kD protein covalently bound to gelati- nase in neutrophils. It is normally expressed in very low levels in several human tissues, including those of the kid- ney, lungs, stomach, and colon. NGAL expression is markedly induced in injured epithelia. Several studies focused on NGAL as the novel biomarker for AKI. Micro- array analysis showed that NGAL is one of the earliest and most robustly induced gene and protein in the kid- ney after ischemic or nephrotoxic injury in animal models [9–11]. Both plasma and urine NGAL concentrations were shown to highly correlate with serum creatinine concentrations. Kidney biopsies in these patients with DGF showed intense accumulation of immuno-reactive NGAL in 50% of the cortical tubules [10–12]. Moreover, the secreted, cysteine-rich, heparin-binding protein CYR61 might serve as an early biomarker of renal injury.
CYR61 is rapidly induced in proximal straight tubuli fol- lowing renal ischemia and it is excreted in the urine [13].
CYR61 is a secreted, cysteine-rich, heparin-binding pro- tein encoded by a growth factor-inducible immediate- early gene [14]. CYR61 promotes the endothelial cells through interaction with integrin and augments growth factor-induced DNA synthesis in the same cell type. It is an extracellular matrix-associated signaling molecule that functions in cell migration, adhesion, and differentiation.
In human kidney, CYR61 expression is confined to podo- cytes in normal human adult and embryogenic glomeruli from the capillary loop stage. Downregulation of CYR61 was significantly greater in diseased kidneys with severe mesangial expansion. Netrin-1 is a laminin-like molecule and all the three isoforms of netrin (1, 3, 4) are expressed
in the normal kidney. Reeves et al. analyzed the urinary netrin-1 excretion after ischemia–reperfusion injury in mice. Urinary netrin-1 levels increased markedly within 3 h after ischemia–reperfusion injury, reached a peak level at 6 h and then decreased, returning to baseline within 72 h. Serum creatinine rose significantly just after 24 h of reperfusion. High levels of netrin 1 (NTN1) could be detected in urine of 13 acute renal failure patients, whereas in six healthy volunteer urine samples the protein level was under the detection threshold. Immunohistochemical localization showed that netrin-1 is highly expressed in tubular epithelial cells in transplanted human kidneys.
Therefore, the authors conclude that urinary netrin-1 is a promising early biomarker of renal injury [15].
The aim of our study was to compare the gene expres- sion levels of these four candidate genes in the mixed cell populations found in microdissected zero-hour needle biopsies within the tubulointerstitial and the glomerular part classified in DGF and primary function (PF).
Materials and methods Biomarker selection
The four biomarker candidates NGAL (also known as lipocalin 2 or LCN2), netrin 1 (NTN1), CYR61, and the KIM1 (also known as HAVCR1) were selected for the evaluation of gene expression levels in the tubulointersti- tial and glomerular part of the kidney.
In addition, the expression levels of podocin (NPHS2) and the solute carrier family 34 sodium phosphate mem- ber 1 (SLC34A1) were determined because of their high expression levels in the glomerular and tubular compart- ments respectively. NPHS2 expression is restricted to the podocytes in the glomerular part and acts as a linker between the plasma membrane and the cytoskeleton [16,17]. The main function of SLC34A1 is the phosphate reabsorption in the renal proximal tubuli in the brush border membrane [18].
Samples and clinical data
Zero-hour needle biopsies from renal transplant patients were used. Seventeen samples from patients experiencing DGF and 17 samples from patients with PF were obtained based on a sample size calculation to detect a difference of 2.58 cycles (fold change >6) with a power of 80% and a= 0.05. DGF was defined as need for more than one dialysis within the first week after kidney transplantation.
Samples from the 34 deceased heart beating donors were obtained from the Department of Transplantation and Surgery of Semmelweis University, Budapest. The study was approved by the local Institutional review board (Ethical Committee of the Medical University of Vienna #
EK-067/2005, to be found at http://ohrp.cit.nih.gov/search and the Semmelweis University, Budapest). During organ procurement, donor organ kidneys were perfused with a 4C histidine–tryptophan ketoglutarate preservation solu- tion. Sterile needle kidney biopsies were obtained from donor kidneys just before the transplantation using a 18- gauge needle. The core was immediately submerged into RNAlater (Ambion, Austin, TX, USA) prefilled 2 ml Eppendorf tubes and stored at 4C till the next day when it was cooled to)80C and stored until RNA extraction.
Donor data were collected retrospectively, whereas data of the transplant recipients were prospectively collected. The decision to initiate dialysis was at the discretion of the attending physicians, without involvement of study inves- tigators.
Nine samples from the unaffected areas of tumor nephrectomy specimens were used as control group as was previously demonstrated by Higgins et al. [19] (Ethical Committee of the KH Elisabethinen Linz # EK-325/2008).
Manual microdissection, RNA extraction and reverse transcription
To separate glomerular part from the tubulointerstitial part, we used manual microdissection. The biopsies were thawed on ice and then transferred to a Petri dish contain- ing ice-cold RNAlater 1:10 dilution. The biopsies were mi- crodissected using two needles under a reflecting light microscope (Bresser, #58-04000, Rhede, Germany) [6] to separate the glomerular part from the tubulointerstitial part. The number of glomeruli per biopsy was between 10 and 15. Separated glomeruli and the tubulointerstitial tissue were transferred into a 1.5-ml Eppendorf tube containing 1 ml TRIzol (Invitrogen, Carlsbad, CA, USA). Marking our RNA pellet, we used 0.5ll GlycoBlue (Applied Biosys- tem, Ambion) [20]. The RNA concentration was measured using a NanoDrop Spectrophotometer (ND 1000; PeqLab;
Biotechnology GmbH). Synthesizing single-stranded cDNA was according to the protocol of High Capacity RT Kit.
(Applied Biosystem, Foster City, CA, USA).
Preamplification and real-time polymerase chain reaction Because of the small amount of cDNA, a multiplex pre- amplification was necessary to increase the quantity of the desired specific cDNA targets for gene expression analysis. Pooling our target gene assays, 10 cycles of pre- amplification were performed combining 5ll from the cDNA with the PreAmp Master Mix (TaqMan PreAmp Master Mix Kit; Applied Biosystem) according to the pre- amplification protocol.
Real-time PCR was performed using the TaqManGene Expression Master Mix, TaqManGene expression assays
(LCN2: Hs00194353_m1, HAVCR1: Hs00273334_01, CYR61: Hs00155479_m1 and NTN1: Hs00924151_m1) and the ABI 7300 Real-Time PCR System. All instruments and reagents were purchased from Applied Biosystems.
Relative gene expression values were evaluated by the 2 DDCt method using PPIA [peptidylprolyl isomerase A (cyclophilin A), Hs99999904_m1] as housekeeping gene and Stratagene Universal human reference RNA (Strata- gene, La Jolla, CA, USA) as reference RNA. qRT-PCR con- ditions were set according to the manufacturer’s recommendations: 10 min at 95C, 40 cycles (15 s at 95C, 1 min at 60C) with fluorescence reading during annealing step.
Statistical analysis
For demographic data, median and interquartile ranges were computed and the Wilcoxon test was used for evalu- ation of significance between the groups under study. For discrete clinical parameters, either the chi-square or Fish- er’s exact test was used.
Statistical differences between expression levels of groups (PF versus DGF as well as control group versus transplanted patients) were computed as contrasts in a mixed model in which compartment, group assignment and interaction between these variables are independent variables. A diagonal structure was used for the covari- ance matrix. A P-value <0.05 was considered statistically significant.
Logistic regression analysis
Multivariable logistic regression analysis was performed to identify the best combination of clinical and molecular parameters allowing a prediction of DGF. The discrimi- native power of parsimonious models was evaluated using c-statistics area under the curve (AUC). A molecu- lar model including the discriminating genes and a c-statistics was calculated. Further validation of the model was performed by evaluating the reproducibility of the discrimination of patients of the same population. There- fore, a 34-fold cross-validation was computed. The AUC is defined by the Sommer’s D-statistics [AUC = (1 + Sommer’s D)/2]. In a final approach, a combination of clinical and molecular variables was used to obtain the best possible prediction, discrimination and model fitness statistics using the Hosmer–Lemeshow goodness-of-fit test. The analysis was conducted using sas for Windows 9.2 (The SAS Institute, Inc., Cary, NC, USA).
Supplemental data can be found at our laboratory web- page at http://www.meduniwien.ac.at/nephrogene/data/
dgf_marker/.
Results
Patients’ demographics
The demographic data of the deceased donors as well as the transplant recipients are provided in Table 1. A signif- icant difference in donor age (P= 0.005) and last creati- nine value (P= 0.011) was observed between samples in the DGF and the PF group.
Biomarker validation
Gene expression of NPHS2, expressed only in the glomer- ular compartment of the kidney, in the tubulointerstitium was in the mean 1024 times less (mean 10 cycles, stan- dard deviation three cycles) compared with the glomeru- lar compartment of the same sample. Against no or too less difference in gene expression of SLC34A1 between the two compartments could be detected. SLC34A1 is only expressed in proximal tubuli cells. Manual microdissec- tion was only efficient to purify the tubulointerstium from glomeruli. Therefore, data only of the tubulointer- stitium were used for the biomarker validation.
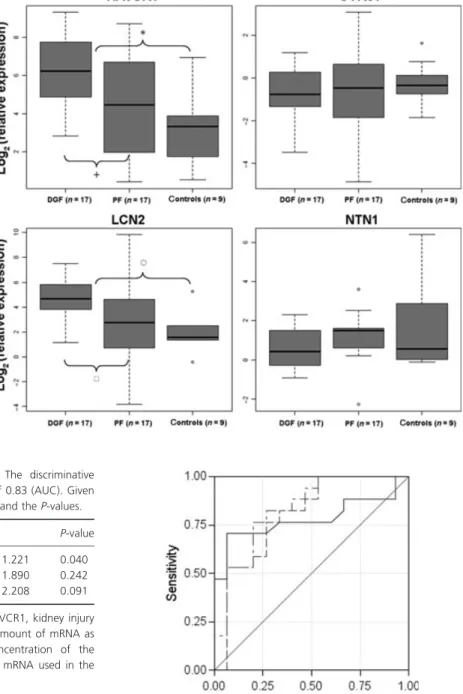
The two marker proteins NGAL and KIM1 were signif- icantly upregulated in the DGF group compared with the PF in the tubulointerstitium. NGAL was upregulated by a factor of 3.78 [P= 0.031; (h) Fig. 1] in the group of samples experiencing DGF. KIM1 also showed higher
expression values in the DGF group [fold change = 3.44, P= 0.010; (+) Fig. 1]. Expression levels of these two genes in the nine control samples (tumor nephrectomy samples) were significantly lower compared with the transplant biopsies [NGAL P< 0.001, (s) Fig. 1; KIM1 P< 0.001, (*) Fig. 1]. No significant differences between the groups under study could be detected for the other two marker candidates, namely CYR61 and NTN1. A graphical representation of expression values of the four biomarker candidates is given in Fig. 1.
Performance of biomarkers
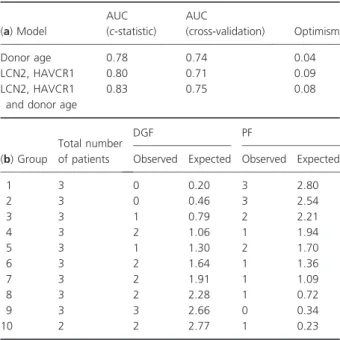
Combinations of the two significant biomarkers were selected for building logistic regression models. The results of the multivariable model including donor age and the molecular biomarkers are given in Table 2. The AUC of the receiver operating characteristic (ROC) derived by applying this regression model was found as 0.83 indicating a discrimination between DGF and PF based on these few predictors (Fig. 2).
The AUCs of ROC of the regression models including only the two molecular predictors on one hand or donor age alone on the other hand were 0.80 and 0.78, respec- tively.
The optimism of the models defined as difference between training and test sets was generally below 10%
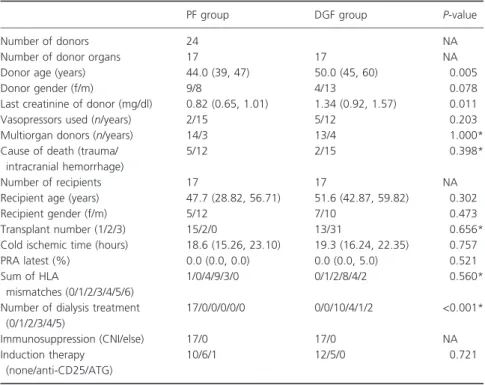
Table 1.Demographic data of trans- plant donors and recipients stratified by treatment assignment. Continuous data are provided as median (first quartile, third quartile), and categorical data are given as counts.
PF group DGF group P-value
Number of donors 24 NA
Number of donor organs 17 17 NA
Donor age (years) 44.0 (39, 47) 50.0 (45, 60) 0.005
Donor gender (f/m) 9/8 4/13 0.078
Last creatinine of donor (mg/dl) 0.82 (0.65, 1.01) 1.34 (0.92, 1.57) 0.011
Vasopressors used (n/years) 2/15 5/12 0.203
Multiorgan donors (n/years) 14/3 13/4 1.000*
Cause of death (trauma/
intracranial hemorrhage)
5/12 2/15 0.398*
Number of recipients 17 17 NA
Recipient age (years) 47.7 (28.82, 56.71) 51.6 (42.87, 59.82) 0.302
Recipient gender (f/m) 5/12 7/10 0.473
Transplant number (1/2/3) 15/2/0 13/31 0.656*
Cold ischemic time (hours) 18.6 (15.26, 23.10) 19.3 (16.24, 22.35) 0.757
PRA latest (%) 0.0 (0.0, 0.0) 0.0 (0.0, 5.0) 0.521
Sum of HLA
mismatches (0/1/2/3/4/5/6)
1/0/4/9/3/0 0/1/2/8/4/2 0.560*
Number of dialysis treatment (0/1/2/3/4/5)
17/0/0/0/0/0 0/0/10/4/1/2 <0.001*
Immunosuppression (CNI/else) 17/0 17/0 NA
Induction therapy (none/anti-CD25/ATG)
10/6/1 12/5/0 0.721
PF, primary function; DGF, delayed graft function; NA, not applicable.
*Fisher’s exact test.
(Table 3a). The Hosmer–Lemeshow goodness-of-fit test indicated good calibration of the models, i.e. the number of expected to observed events was not statistically differ- ent (P= 0.76; Table 3b).
Further combinations of clinical variables (penal reactive antibody, cold ischemic time, last donor creatinine, donor age) in the multivariable logistic regression model can be found in Tables S2 and S3 (Supporting Information).
Discussion
In the present study, we compared the gene expression levels of four potential AKI markers in 34 microdissected
needle biopsies from zero-hour renal biopsies which 17 developed DGF after transplantation.
Microdissection together with qRT-PCR is an elegant tool for the analysis of gene expression of circumscribed structures of the kidney [21]. Normalization with an endogenous control gene, such as cyclophilin A, is the
Figure 1Box–Whisker plots of the four biomarkers in the tubulointerstitium.
Boxplots show the median and the 1.5 interquartile range of the log2(relative expression) measured in the qRT-PCR experiment. A value of zero equates same expression level as in the reference RNA.
Table 2.Multivariable logistic regression model. The discriminative power of this model is indicated by ac-statistics of 0.83 (AUC). Given is the odds ratio (OR), the confidence interval (CI), and theP-values.
Predictors OR 95% CI P-value
Donor age (per year) 1.108 1.005 1.221 0.040
LCN2 (AU) 1.269 0.851 1.890 0.242
HAVCR1 (AU) 1.443 0.943 2.208 0.091
AUC, area under the curve; LCN2, lipocalin 2; HAVCR1, kidney injury molecule 1; AU, arbitrary units (log2-ratio of the amount of mRNA as found in the sample with respect to the concentration of the respective mRNA given by the universal reference mRNA used in the qRT-PCR experiments).
Figure 2 ROC curves: Discrimination for DGF after transplantation using donor age (solid line), expression features (dashed line), or the combination of both (dash-dotted line).
gold standard to allow precise comparison of biological samples after microdissection [22].
So far, no other study investigated the gene expression of LCN2, HAVCR1, CYR61, and NTN1 in the tubuloin- terstitium of the kidney. Univariable analysis showed a significant upregulation of LCN2 and HAVCR1 in biop- sies developing DGF in our dataset, whereas donor age was a major factor according to the multivariable regres- sion analysis. Donor age is one of the main confounding factors of DGF but not all grafts from old donors have necessarily poor graft function. Markers of biological age have been discussed by Koppelstaetteret al.[23] and may have the potential of providing a much better forecast model for renal transplant function.
Two limitations of the technique became apparent dur- ing the study. First, manual microdissection was not able to separate glomeruli from the tubulointerstitium ade- quately. The difference in gene expression levels of SLC34A1, the specific marker for the tubulointerstitium, between the two compartments was too low, indicating that the glomerular part was contaminated with tubuloin- terstitium. However, we could purify the tubulointersti- tium, which was used for further analysis. The gene expression level of the specific marker of the glomerular part (NPHS2) showed in the mean 10 cycles of difference
between the two compartments and the variation was less.
Second, a considerable range of expression was observed, represented by the 1.5 interquartile range of the log2rela- tive expression. This variation is probably a consequence of the nature of the heterogeneous patient population. To exclude that this variation is caused by technical variance, mRNA expression on consecutive sections from the same nephrectomy tissue sample was compared. The stringent correlation obtained demonstrated the reproducibility of the RNA isolation, preamplification and qRT-PCR (Figs S1 and S2).
The immediate translation of our findings into clinical practice would require a full genomics infrastructure at the transplantation center. As this is likely not available in most centers, further studies need to test the applica- bility of our findings using whole biopsies and evaluate the correlation with protein levels of the biomarkers determined in plasma or urine.
Taken together, this is the first study reporting gene expression levels of LCN2, HAVCR1, NTN1, and CYR61 in the tubulointerstitium of zero-hour kidney biopsies developing DGF. Significant upregulation of LCN2 and HAVCR1 could be detected in the DGF group by a mixed model. However, in the multivariable regression model, the odds ratios of the two biomarkers could not reach significance. The prognostic value of the two biomarkers together with donor age ranges between 75% and 83%.
Authorship
RK: wrote the manuscript and performed qRT-PCR. JW:
wrote the manuscript, performed qRT-PCR and statistical analysis and interpreted data. PP: reviewed the manu- script. AK: performed statistical analysis and collected clinical data. RL: collected biopsies. BM: reviewed the manuscript. RO: designed and supervised the project and critically reviewed the manuscript.
Funding
This study was supported by grants from the Austrian Science Fund (P-18325 to R.O.) and Austria Academy of Science (OELZELT EST370/04).
Disclosure
None of the authors has any current financial benefit or potential future financial gain.
Supporting Information
Additional Supporting Information may be found in the online version of this article:
Table 3.Discrimination of the models and optimism (a) derived from the re-sampling procedure (34-fold cross-validation). Calibration of the DGF prediction model by the Hosmer–Lemeshow goodness- of-fit test (b). The expected to observed number of cases in each of the deciles of patients was not statistically different suggesting good calibration (P= 0.76, chi-square test).
(a) Model
AUC (c-statistic)
AUC
(cross-validation) Optimism
Donor age 0.78 0.74 0.04
LCN2, HAVCR1 0.80 0.71 0.09
LCN2, HAVCR1 and donor age
0.83 0.75 0.08
(b) Group
Total number of patients
DGF PF
Observed Expected Observed Expected
1 3 0 0.20 3 2.80
2 3 0 0.46 3 2.54
3 3 1 0.79 2 2.21
4 3 2 1.06 1 1.94
5 3 1 1.30 2 1.70
6 3 2 1.64 1 1.36
7 3 2 1.91 1 1.09
8 3 2 2.28 1 0.72
9 3 3 2.66 0 0.34
10 2 2 2.77 1 0.23
AUC, area under the curve; LCN2, lipocalin 2; HAVCR1, kidney injury molecule 1; PF, primary function; DGF, delayed graft function.
Figure S1 Bias test of pre-amplification technique:
Dilution series from a microdissected nephrectomy sam- ple (T: Tubulointerstium, G: glomeruli part) were mea- sured with qRT-PCR for ACTB (b-actin), LCN2 (lipocalin 2) and PPIA (Cyclophilin A) after a 10-cycle pre-amplification.
Figure S2 Bias test for reverse transcription, pre-ampli- fication and real-time PCR of the reference RNA: Correla- tion of 14 different genes in the standard RNA (Stratagene human reference RNA) is almost one suggest- ing reference RNA is an excellent calibrator.
Table S1. Multivariable logistic regression model:
LCN2 and HAVCR1.
Table S2. Multivariable logistic regression model:
Donor age, cold ischemic time (CIT), panel reactive anti- bodies (PRA), donor last creatinine, LCN2 and HAVCR1.
Table S3. Multivariable logistic regression model:
Donor age, cold ischemic time (CIT), panel reactive anti- bodies (PRA) and donor last creatinine.
Please note: Wiley-Blackwell is not responsible for the content or functionality of any supporting materials sup- plied by the authors. Any queries (other than missing material) should be directed to the corresponding author for the article.
References
1. Ojo AO, Wolfe RA, Held PJ, Port FK, Schmouder RL.
Delayed graft function: risk factors and implications for renal allograft survival.Transplantation1997;63: 968.
2. Boom H, Mallat MJ, de Fijter JW, Zwinderman AH, Paul LC. Delayed graft function influences renal function, but not survival.Kidney Int2000;58: 859.
3. Hauser P, Schwarz C, Mitterbauer C,et al.Genome-wide gene-expression patterns of donor kidney biopsies distin- guish primary allograft function.Lab Invest2004;84: 353.
4. Devarajan P. Neutrophil gelatinase-associated lipocalin (NGAL): a new marker of kidney disease.Scand J Clin Lab Invest Suppl2008;241: 89.
5. Kainz A, Perco P, Mayer B,et al.Gene-expression profiles and age of donor kidney biopsies obtained before trans- plantation distinguish medium term graft function.Trans- plantation2007;83: 1048.
6. Kainz A, Mitterbauer C, Hauser P,et al.Alterations in gene expression in cadaveric vs. live donor kidneys suggest impaired tubular counterbalance of oxidative stress at implantation.Am J Transplant2004;4: 1595.
7. Zhang PL, Rothblum LI, Han WK, Blasick TM, Potdar S, Bonventre JV. Kidney injury molecule-1 expression in transplant biopsies is a sensitive measure of cell injury.
Kidney Int2008;73: 608.
8. Vaidya VS, Ramirez V, Ichimura T, Bobadilla NA, Bonv- entre JV. Urinary kidney injury molecule-1: a sensitive
quantitative biomarker for early detection of kidney tubu- lar injury.Am J Physiol Renal Physiol2006;290: F517.
9. Kuwabara T, Mori K, Mukoyama M,et al.Urinary neutro- phil gelatinase-associated lipocalin levels reflect damage to glomeruli, proximal tubules, and distal nephrons.Kidney Int2009;75: 285.
10. Mishra J, Dent C, Tarabishi R,et al.Neutrophil gelatinase- associated lipocalin (NGAL) as a biomarker for acute renal injury after cardiac surgery.Lancet2005;365: 1231.
11. Mishra J, Ma Q, Prada A,et al.Identification of neutro- phil gelatinase-associated lipocalin as a novel early urinary biomarker for ischemic renal injury.J Am Soc Nephrol 2003;14: 2534.
12. Mori K, Lee HT, Rapoport D,et al.Endocytic delivery of lipocalin-siderophore-iron complex rescues the kidney from ischemia-reperfusion injury.J Clin Invest2005;115:
610.
13. Muramatsu Y, Tsujie M, Kohda Y,et al.Early detection of cysteine rich protein 61 (CYR61, CCN1) in urine following renal ischemic reperfusion injury.Kidney Int2002;62: 1601.
14. Babic AM, Kireeva ML, Kolesnikova TV, Lau LF. CYR61, a product of a growth factor-inducible immediate early gene, promotes angiogenesis and tumor growth.Proc Natl Acad Sci USA1998;95: 6355.
15. Reeves WB, Kwon O, Ramesh G. Netrin-1 and kidney injury. II. Netrin-1 is an early biomarker of acute kidney injury.Am J Physiol Renal Physiol2008;294: F731.
16. Woroniecki RP, Kopp JB. Genetics of focal segmental glomerulosclerosis.Pediatr Nephrol2007;22: 638.
17. He L, Sun Y, Patrakka J,et al.Glomerulus-specific mRNA transcripts and proteins identified through kidney expressed sequence tag database analysis.Kidney Int2007;
71: 889.
18. Capuano P, Bacic D, Roos M,et al.Defective coupling of apical PTH receptors to phospholipase C prevents inter- nalization of the Na+-phosphate cotransporter NaPi-IIa in Nherf1-deficient mice.Am J Physiol Cell Physiol2007;292:
C927.
19. Higgins JP, Wang L, Kambham N,et al.Gene expression in the normal adult human kidney assessed by comple- mentary DNA microarray.Mol Biol Cell2004;15: 649.
20. Chomczynski P, Sacchi N. Single-step method of RNA iso- lation by acid guanidinium thiocyanate-phenol-chloroform extraction.Anal Biochem1987;162: 156.
21. Valdes F, Pasaro E, Diaz I,et al.Segmental heterogeneity in Bcl-2, Bcl-xL and Bax expression in rat tubular epithe- lium after ischemia-reperfusion.Nephrology (Carlton) 2008;13: 294.
22. Erickson HS, Albert PS, Gillespie JW,et al.Assessment of normalization strategies for quantitative RT-PCR using microdissected tissue samples.Lab Invest2007;87: 951.
23. Koppelstaetter C, Schratzberger G, Perco P,et al.Markers of cellular senescence in zero hour biopsies predict out- come in renal transplantation.Aging Cell2008;7: 491.