F LUID ASSESSMENT BY OBJECTIVE MEASURES IN END STAGE KIDNEY DISEASE
Ph.D. Thesis
Mihály Tapolyai
Doctoral School of Basic and Translational Medicine Semmelweis University
Consultant: Dr. László Rosivall, DSc., MD
Official reviewers:
Dr. Orsolya Cseprekál, MD, Ph.D.
Dr. Szilveszter Dolgos, MD, Ph.D.
Head of the Final Examination Committee:
Dr. György Reusz, MD, Ph.D.
Members of the Final Examination Committee:
Dr. Péter Tóth-Heyn, MD., Ph.D.
Dr. Tamás Szabó, MD., Ph.D.
Budapest, 2017
1
T
ABLE OF CONTENTS1. The list of Abbreviations 5
2. Introduction 7
2.1. Physiological Volume Sensors 7
2.1.1. Renal fluid flow sensors 7
2.1.2. Carotid volume sensors 8
2.1.3. Cardiac volume sensor 9
2.2. Clinical relevance 10
2.3. The pathological environment 10
2.4. Background 11
2.4.1. The Problem 11
2.4.2. Medical error: bias 12
2.4.3. Evidence for physical exam’s utility 13
2.5. The biomarker: B-type Natriuretic Peptide (BNP) 16
2.5.1. Biology of BNP 16
2.5.2. Clinical use of BNP 17
2.5.3. Validation of BNP in renal failure 17
2.6. The device 18
2.6.1. The mechanism of bioimpedance 18
2.6.2. Physics 19
2.6.3. Theoretical basis of BCM 19
2.6.4. Validation of bioimpedance-measured results 20
3. Objectives 22
2
4. Methods 23
4.1. Patient population of BNP studies 23
4.2. BNP study design 25
4.2.1. BNP studies’ population behavior 25
4.3. Patient population for BCM studies 26
4.4. BCM population patient behavior 27
4.5. The clinical utility of using a device for fluid space estimation… 28 4.5.1. Methods for the BCM studies for fluid overload, anti… 28
4.6. Whence doth the ultrafiltrate come? 29
4.6.1. Methods for fluid space determination in dialysis patients 30 4.7. Confirmatory study for changes in fluid spaces … 31 4.8. Putting the marker (BNP) and the device (BCM) together; synthesis 32
4.8.1. Study designs: BNP vs. BCM 32
5. Results 34
5.1. Results of the BNP studies’ population behavior and adherence 34
5.2. BCM Study population behavior results 34
5.2.1. Implications of BCM study population behavior results 38
5.3. BNP study results 38
5.4. Presentation of a representative case; BNP for the detection of volume… 41
5.4.1. Detection of volume-related bleed 42
5.5. Results of Bioimpedance study; BCM, antihypertensive medications… 45 5.5.1. BCM Measurements and the number of antihypertensive… 46 5.5.2. BCM Measurements and the use of diuretics 47
3
5.5.3. BCM Measurements and body mass index (BMI), fat and … 48
5.5.4. BCM Measurements and residual urine 50
5.6. Results of fluid space determination: the source of ultrafiltrate 50 5.7. Confirmatory study for fluid spaces after ultrafiltration 53 5.8. Results of the confirmatory study for fluid spaces due to diuretics’… 54
5.9. Results of the synthesis study 58
5.9.1. BNP results 59
5.9.2. BCM results 59
5.9.3. Correlation of BNP and BCM 59
6. Discussion 63
6.1. Discussion of outcomes research 63
6.2. Discussion of physical exam-guided fluid management 66 6.3. Discussion of objective measurement-directed ultrafiltration 66 6.4. Discussion of blood pressure and fluid status 68 6.4.1. Antihypertensive medications for blood pressure management… 69
6.4.2. Fluid management and blood pressure 70
6.5. Critical studies on BNP-directed therapy 71
6.6. Synthesis of fluid management by objective guides 72
7. Conclusions 74
8. Summary 75
8.1. Summary in Hungarian / Összegzés magyarul 76
9. Bibliography 77
10. Bibliography of the candidate's publications. 88
4
10.1. Other publications 90
11. Acknowledgements 93
5
1. T
HE LIST OF ABBREVIATIONSANP Atrial Natriuretic Peptide
BP Blood Pressure
BCM Body Composition Measurement a.k.a. bioimpedance BNP B-type Natriuretic Peptide
CHF Congestive Heart Failure CKD Chronic Kidney Disease CNP C-type Natriuretic Peptide CPT Current Procedural Terminology
DOPPS Dialysis Outcomes and Practice Pattern Study ECW Extracellular Water
ENaC Epithelial Na+ Channels ESRD End Stage Renal Disease IDWG Interdialytic Weight Gain
HD Hemodialysis
HDF Hemodiafiltration HJR Hepato Jugular Reflux ICW Intracellular Water IDWG Interdialytic Weight Gain
LVEDP Left Ventricular End Diastolic Pressure MI myocardial infarction
OH Overhydration
OH% Percent overhydration
6 PCWP Pulmonary Capillary Wedge Pressure RAS Renin-Angiotensin-Aldosterone System ROC Receiver Operating Characteristic UF Ultrafiltration
7
2. I
NTRODUCTIONMaintaining intravascular volume and blood pressure is essentially equivalent to maintaining life. Organisms that cannot maintain their fluid status within the narrow ranges of homeostatic balance are at their last moments of life; the mechanism of death in most mammalians is essentially equivalent to losing perfusion pressure to vital organs and the cessation of organized function as a whole even though individual cells, tissues and organs may persist for minutes, hours even days. Blood pressure is thus a critical vital sign that organisms try to preserve at all cost.
Maintaining blood pressure is a particularly difficult task with multiple factors that interplay but the two central components of blood pressure is maintaining vascular tone and maintaining intravascular volume. As with any biological system there must be a decision loop whose parts include sensing or status assessment, evaluation of the data and adjustment. These parts of the decision loop are analogous to computer coding while every part is a component of the maintenance of biological systems. Therefore, maintaining blood pressure and maintaining intravascular volume need to be sensed, assessed, evaluated and adjusted for maintaining a homeostatic state. Biological systems, however, are well-prepared to this task and there are several mechanisms to regulate fluid status.
While regulation of the fluid status has been studied and explored in the last century extensively and we seem to have some good grasp on how this may be achieved. The assessment part of the decision loop seems to have been a more difficult element of fluid status maintenance.
2.1. Physiological volume sensors 2.1.1. Renal fluid flow sensors
Essentially all tubular epithelial cells in the nephron are endowed with a single sensory cilia to sense the amount and direction of fluid flow (1). Unlike cilia in the bronchial epithelium or the oviduct these cilia do not beat but are designed to deflect and the inner microtubules through the signaling of intraflagellar transport proteins – such as polycystin-1 - process the information.
Abnormalities of the various component proteins of the ciliary system present as various clinical syndromes, most notably cystic diseases although the exact mechanisms of these developments are not fully understood. Flow-related deflections of these cilia activate various ion channels – for example calcium channels – and modulate ion currents. The intraflagellar transport proteins
8
also sense chemical compositions, calcium concentration or pH in addition to their primary function of detecting and measuring flow rate. The mechanical bending of a cilia is the first step in a cascade of autocrine chemical signaling. This cascade eventually affects sodium uptake which is an ATP-dependent process and thus the rate of luminal fluid flow is regulated in addition to the other endocrine and paracrine processes in the body. These are the chemically induced renin-angiotensin-aldosterone hormones that are stimulated when there is a low blood flow taking signals from receptors in the macula densa. The macula densa is capable of processing fluid volume-related succinate, adenylate cyclase 3, chloride concentration and finally effect the blood pressure by the RAS axis. The distal tubule and collecting tubules also has a role in sensing the volume status via the sensing of bicarbonate through various sensor proteins. The kidney thus has both a chemical and a mechanical means of assessing fluid status and fluid flow.
2.1.2. Carotid volume sensors
Another mechanism through which the human body is capable assessing its own fluid status is through the pressure sensors in the carotid body; the aortic baroreceptors and other vascular bodies that send afferent information on vascular stretch by volume status. A network of branching nerve fibers enmesh these vascular sites where they act as baroreceptors as well as some act as chemoreceptors. These vascular receptors are found in the lungs and subclavian arteries. The osmotic assessment in the carotid bodies have long been known (2) through the studies of Verney who injected hypertonic then hypotonic saline into the carotid sinus and found that diuresis followed if the saline was hypotonic or fluid retention ensued depending on the sodium concentration. Better yet, Peters (3) in 1937 recognized that the fullness of the vascular bed without changes in osmolality he could induce diuresis simply by producing graded hemorrhage or by transfusion; this through the release of antidiuretic hormone or vasopressin.
Schrier in fact, remarks (4) that “since these earlier studies the role of blood volume as a regulator of renal water excretion has been recognized in numerous other investigations.” It was also observed that changes in the peripheral pressure, thus redistributing fluid from the thorax to the lower body through tilt tables or negative lower body pressure will induce diuresis or water retention depending on whether the intrathoracic pressure increases or decreases (5).
Decreasing the intrathoracic stretch of these receptors for example by increasing the pressure in the lungs via positive pressure breathing on mechanical ventilation the urine flow will decrease and using negative pressure will actually increase urine flow (6) as the stretch receptors can in the lungs sense the pressure milieu. This same author, Goetz, found that the receptor for
9
measuring intravascular volume may be in the atrium that sends the signal to various hormonal pathways including to the renin-angiotensin axis as well as the vasopressin pathway. These vascular receptors mostly detect pressure and through a complex pathway send their signals to the medullary and hypothalamic areas to process and influence vascular tone, cardiac function and ultimately blood pressure, end-organ perfusion.
2.1.3. Cardiac volume sensor
Cardiac sensory receptors have long been known from the early studies noted above. The heart can readily sense intravascular volume as “inflation of a balloon in the left atrium of the conscious dog produces a composite response consisting of alterations in cardiovascular function, renal function, and circulating hormones” (7). Increasing the left atrial pressure by balloon inflation the ensuing hormonal changes included a decrease in the anti-diuretic hormone (ADH) as well as renin value. This resulted in increased urine flow. Interestingly, however, cardiac denervated dogs (8) had essentially the same response! This indicates that there must be another mechanism of volume assessment than the simple neural reflex arc. In fact there may be another, perhaps more important mediator of volume measurement – initiation of graded response to graded sensory input – through volume expansion and cardiac muscular stretching.
This mediator could be the hormone implicated by de Bold when he injected rats with myocardial extracts and observed a rapid diuretic response. This mediator was later found to be the circulating atrial natriuretic peptide (ANP). This is not only a signal molecule for the organism but in the clinical arena it also acts as a circulating biochemical marker that we will discuss later. The teleological purpose of this hormone is to adjust intravascular filling and cardiac stretch. An increased vascular volume can eventually be detrimental and this vascular expansion the body is capable to reset a normovolemic state by increasing diuresis, decreasing blood pressure and volume removal. ANP is a hormone recognized in the early 1980’s both as a hormone and as a clinical tool for diagnosing a congestive heart failure which is the equivalent of fluid excess.
These examples how the mammalian body is capable to assess its own fluid and volume status are only some examples and only serve to illustrate that fluid assessment is a serious matter in the Created World and that the constant assessment and re-assessment its status is critical in maintaining vital function and in fact life itself. This is not an exhaustive list nor do I want to target the discussion to detailing the physiology of fluid volume assessment. Rather, the ensuing discussion will focus on how clinicians can assess the fluid status in those whose vital functions
10
depend on both the preservation of adequate effective circulating volume and avoidance of excessive fluid overload.
2.2. Clinical relevance
One of the most vulnerable patient populations is that with renal dysfunction. As the renal function declines in its capacity to clear toxins and waste product, in its clearance function of creatinine and other substances additional renal functions decline as well. Such examples are the endocrine function to hydroxylate pro-vitamin D or to produce erythropoietin necessary to maintain a normal or adequate hematocrit. (9) As the kidney loses its physiological function chronic bone disease and anemia develop with the decline of the clearance. At the same time the kidneys develop a progressive loss of ability to remove excess fluid (10) which in turn may be the progenitor of further decline not only of the cardiac dysfunction seen in chronic kidney failure patients but also of the declining renal function. Loss of the ability to remove fluid is a critical point in the development of renal decline because this translates to the deterioration of cardiac function. (11)
2.3. The pathological environment
It has been well recognized that renal dysfunction is a risk factor for cardiac disease and cardio- vascular mortality (12). There may be many reasons for this decline such as the diminished clearance of cardio-toxic substances, decreased hematocrit thus an increase in left ventricular mass due to the anemic environment and perhaps the worsening of soft tissue calcification. This calcification may be compounded by the atherosclerotic progression that has many components such as uric acid whose clearance declines with the clearance of all else, or diminished phosphate clearance which exacerbates the calcium-phosphate precipitation or the vascular calcification. Further exacerbates the calcium deposition the diminished production of osteocalcin production by the osteoblasts which are inhibited by the complex cascade of increased PTH (parathyroid hormone) which is elevated by the rising phosphate level because of the diminished renal clearance thereof. Increased cardiovascular mortality is also associated with the abnormally high aldosterone levels which is in turn stimulated by the high potassium level. In turn, high potassium values are not only due the diminishing clearance of potassium itself but also a consequence of the acidosis due to the lower ability of the kidney to reclaim bicarbonate in the proximal tubule and excrete titratable acids in the distal tubules. There is a host of reasons why the declining renal function is a risk factor for ever increasing cardiovascular risk. The diminishing ability to excrete salt and water is also a factor as the
11
retention of water is a major determinant of blood pressure which is also another factor that can hasten the decline of renal failure and increase the cardiac damage. Hung et al. found in a combined animal and prospective observational study that “volume overload contributes to CKD progression and cardiovascular diseases” (11). They followed a group of patients with chronic kidney disease (CKD) for 2.1 years and measured their fluid status using a bioimpedance apparatus. They found that fluid overload gets worse with time and progression of CKD but also found fluid overload to be a risk factor.
Therefore, it is important to conclude that one the most vulnerable population in which fluid overload should be assessed and monitored is perhaps the population with diminished ability to adjust its own volume status, those with CKD. A sub-population of these patients, perhaps should be the CKD5-D dialysis population who may have no ability on their own to adjust their fluid status. As we have seen the first part of the decision loop is to assess the volume status and the population where it may be the most critical to do so is the CKD population. We will therefor investigate how best to assess fluid status in the end-stage renal disease (ESRD) population and we will offer two options for this.
2.4. Background:
2.4.1 The Problem
The clinical task of accurately ascertaining patients’ volume status seems quite easy. This may come as a self-evident part of medical practice that all physicians should be able to diagnose volume-overload in a large variety of patients. Nothing seems to be more evident than the simple fact that physicians can auscultate patients’ lungs and listen patients’ hearts and determine the volume status. After all, congestive heart failure is the classic and prime example of volume overload and diagnosing congestive heart failure seems to be a simple diagnostic challenge. Perhaps the most specific finding of these are related to the elevated neck veins that indicate an increased left ventricular pressure transmitted to the right side of the heart and thus presenting as a jugular venous distention (JVD) or transmitting from a congested liver and being detectible as hepato-jugular reflux (HJR) (13). These physical findings are often absent unless the patient is seriously in a decompensated life-threatening state. Waiting for this state of life- threatening situation is not an ideal situation to assess the fluid status of any patients. Their specificity is also tainted by other physical confounders such as a tricuspid regurgitation, a fast beating tachycardia or neck anomalies. In the dialysis population this problem is further exacerbated by the fact that many dialysis patients have had or do have internal jugular venous
12
devices as vascular accesses. Patients with a dialysis catheter in the jugular vein cannot be simply assessed based on their JVD or HJR because the catheter is in the way. If they have had dialysis or any other venous catheters in the past then there is a 50% chance of having a subclavian venous stenosis (14) but the jugular vein too has a very high rate of stenosis. (15) Physical exam is a necessary and integral part of the medical arts, without physical exam physicians cannot make their first impression to guide them for further investigation and testing.
Physical exam is the part of medical practice that will initiate a process after the medical history is obtained and the work-up process will be started. HK Walker and co-workers remark:
“Physical examination is the process of evaluating objective anatomic findings through the use of observation, palpation, percussion, and auscultation. The information obtained must be thoughtfully integrated with the patient's history and pathophysiology. Moreover, it is a unique situation in which both patient and physician understand that the interaction is intended to be diagnostic and therapeutic. The physical examination, thoughtfully performed, should yield 20% of the data necessary for patient diagnosis and management” (16).
However, this is the part of the medical evaluation that may be most problematic. While 20%
of the information may be obtained through the physical exam these 20% may be the critical parts that will determine the direction of the investigation and may in fact determine to some degree the outcome of investigation.
2.4.2. Medical error: bias
Physical exam can not only guide diagnostic considerations but determine and misguide the clinicians and perpetuate clinical bias and thus lead to catastrophic consequences. The medical literature is rife of this problem and we are cautioned not to overly rely on the “good old habits”
and practices that we were taught in the beginnings of our medical careers. Medical errors are often based on errors of various forms of bias, such as the so called availability error which represents a form of decision-making error where recent experience – missed or discovered – will guide further decision making. Error of representation is a form of error when a clinician makes an erroneous decision based on how well a clinical or physical presentation fits the classic presentation of an illness. If a patient has shortness of breath, cough and crackles on physical examination one thinks of congestive heart failure even though a picture of pneumonia
13
or pneumonitis caused by toxic fumes are just as plausible. Another form of medical error making is the anchoring error when a clinician clings steadfastly to her or his initial clinical impression and all available evidence is dismissed in favor of the first impression to which he is “anchored” and he thinks is the right diagnosis. “Attribution errors involve negative stereotypes that lead clinicians to ignore or minimize the possibility of serious disease. (17)”
Patients’ complaints may be dismissed as “just another drunk” or as those of a psychiatric patient and yet a serious illness may be overlooked. Finally, there are medical errors that emanate from the fact that the physician feels compassion or sympathy with the patient and thus certain painful or uncomfortable tests such as a pelvic exam or multiple venipunctures for blood cultures are waived when affective errors are committed. The basis of these medical errors are often the initial physical exam that will lead down an erroneous – or correct – path. (18) Physical exam thus ought to be regarded as just part of the decision making and subject to errors not only the detection errors but may contaminate further decision making.
2.4.3. Evidence for physical exam’s utility
Physical exam to assess volume status is an interesting undertaking. Studies that investigate fluid assessments in patients are typically in the clinical situation of congestive heart failure (CHF). Assessment of congestive heart failure is essentially the assessment of fluid status as all fluid accumulation with elevated cardiac filling pressures and pulmonary edema with inadequate fluid excretion essentially define CHF. Thus evaluating studies that assess fluids in congestive heart failure fall in the realm of fluid assessment (19). However, studies that compared physical exam to other means of assessing fluid overload or fluid status have all showed a sorry picture as the physical exam was not at all diagnostic. In a well renowned study that aimed at prospectively differentiating shortness of breath etiology from cardiac failure from other etiologies such as pulmonary etiology the diagnostic yield was rather low. This included both the sensitivities and the specificities of physical examination.
This was a prospective study of Breathing Not Properly Multinational Study (19) patients were serially examined in the emergency room as they were identified in the emergency rooms with the chief complaint of shortness of breath. A total of 1586 patients were enrolled in seven sites including five in the United States, one in France and one in Norway. In this study specific efforts were made to differentiate between fluid overload, CHF and its diagnosis based on physical findings and an alternative method using the biomarker B-type Natriuretic Peptide (BNP). While this was a validation study for the use of BNP to diagnose CHF the study had
14
other relevant findings and conclusions namely that physical exam alone was a poor discriminator between fluid overload from CHF and dyspnea not caused by fluid overload.
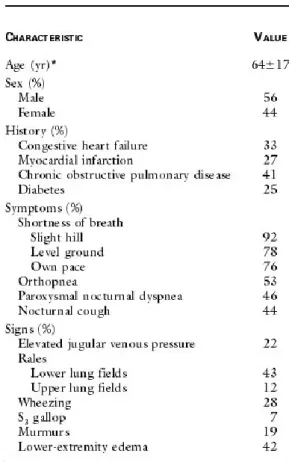
Forty nine percent of patients were confirmed CHF by physical exam alone. In clinical practice we use lung crackles as the most reliable sign of CHF yet when examined by an emergency room physician and the examination data were reviewed by 2 blinded (to the actual confirmed diagnosis) cardiologist, only 43% had such rales. The physical findings of CHF could not make the right cardiac diagnosis when two independent cardiologists assessed the available data on the patients. This is less than the fifty-fifty result of a coin toss! The classic third (S3) heart sound was not even present more than 7% of the patients (n: 1586).
Table 1. 1586 patients’ baseline data having shortness of breath. Patients were examined by two independent and blinded cardiologists to assess their status whether they had CHF or not.
Maisel AS et al. N Engl J Med 2002;347:161-167. (19)
15
Similarly, a study by Dao and colleagues (20) who examined the percent accuracy of making the right diagnosis of CHF based on physical findings, patient history or BNP value. Physical findings, again came out as a low predictor of the actual diagnosis, had a low sensitivity though better specificity. The diagnosis of fluid overload in the 250 patients whom they examined could not be determined very accurately; the presence of pulmonary crackles had a sensitivity of 56%, S3 third heart sound 20%, jugular venous distention 39% and edema 67%. In evaluating these patients the associated specificities were better ranging from 68% for the presence of edema and 99% for S3 heart sound.
While the disease process of CHF for fluid overload and its detection for assessing fluid status is a good model these two studies outlined above were not conducted on renal failure patients, in fact the Breathing Not Properly study excluded patients with kidney disease. In a subproject (21) of the ongoing Lung Water by Ultra-Sound Guided Treatment to Prevent Death and Cardiovascular Complications in High Risk ESRD Patients with Cardiomyopathy Trial (20) the reliability of physical findings were tested against lung ultrasound to differentiate between fluid overloaded dialysis patients and euvolemic patients. They tested peripheral edema and lung crackles by auscultation, alone or in combination were tested against lung comets on the ultrasound imaging. Over one thousand paired measurements were performed in 79 patients with poor results. The sensitivities of peripheral edema detecting fluid overload – as determined by lung ultrasound comets – ranged from 1-10% while lung crackles indicated instrument detected pulmonary fluid overload 9-27% depending whether the pulmonary edema was deemed mild, moderate or severe. When pulmonary crackles and peripheral edema were combined the sensitivities improved slightly to 13-31%. Specificities were again much better, ranging from 88% to 100%. It is thus clear that physical exam in the dialysis patient population was similarly unable to give appropriate assessment for fluid status.
16 2.5. The biomarker: B-type Natriuretic Peptide (BNP) 2.5.1. Biology of BNP
As the name implies, this is a polypeptide whose physiological function is natriuresis, that is, sodium excretion. This 32 amino-acid polypeptide is synthesized by the heart ventricles in response to volume-related stretch. First it is synthesized as pre-pro-BNP which is then further processed to pro-BNP as a glycoprotein which then is further processed by the cardio-myocytes to a 76 amino acid N-terminal-pro-BNP (NT-pro-BNP) and the biologically active 32 amino acid molecule BNP (22); its half-life is 18 minutes and molecular weight 3464. BNP is closely related to the atrial natriuretic peptide (ANP) as well as a similar structure CNP. BNP is similar not only in structure to ANP but also in physiology. BNP as well as ANP have similar actions in the kidney, in the collecting ducts and on specific natriuretic peptide receptors. ANP causes renal vascular vasodilation and increased urine flow within 2 minutes after its appearance in circulation in experimental laboratory animals (23), likely through the epithelial Na+ channel (ENaC). ANP and BNP also cause peripheral vasodilation as well as they block the sympathetic nervous system and block the renin-angiotensin-aldosterone axis (24) essentially antagonizing aldosterone by inhibiting renin secretion. These cardiac hormones cause peripheral vasodilation through membrane-receptors (there are three types) and inhibit cardiac fibrosis and maladaptive hypertrophy (25). Ramnarian and Mehra (26) have reported “a case in which a large atrial myxoma induced overproduction of natriuretic peptides, causing clinically relevant hyponatremia, hypotension and polyuria”.
These cardiac hormones are degraded through the neutral endopeptidase (NEP). NEP is expressed in a wide variety of tissues and is particularly abundantly expressed in the kidney which may explain its higher blood levels in renal failure. NEP is an enzyme responsible to degrade a host of other enzymes and it is frequently found on the surfaces of various lymphocytic leukemias. While both ANP and BNP can be measured clinically, ANP is often measured in experimental conditions only and its measuring kits are not as readily available for those in clinical practice as that for BNP or NT-pro-BNP. In clinical practice BNP is typically measured by commercially available kits such as a whole blood essay; Biosite Diagnostics Inc., using the Beckman Coulter Access 2 instrument.
17 2.5.2. Clinical use of BNP
The use of BNP as a marker of congestive heart failure has really been established in the clinical arena by the previously cited (19) Breathing Not Properly study. This study was able to select patients who had CHF versus those who had dyspnea due to another etiology. The study established that the cut-off value for BNP to diagnose CHF is above 100 pg/mL with a sensitivity of 90% and a specificity of 76%. The BNP study found that there was no other single or combined predictor of CHF more accurate than BNP. The value of BNP associated with New York Heart Association classification. Another study(27) found this blood value of 100 pg/mL to have a 100% sensitivity and 90% specificity with a 100% negative predictive value for
“cardiac events” which were “fatal or non-fatal myocardial infarction (MI) in high risk vascular surgical patients”. Thus using this marker for both a volume status diagnostic test in CHF as well as an outcome predictor has been investigated and validated.
While there have been multiple validation studies mostly with cardiac catheterization, one European study (28) was able to demonstrate a remarkably strong correlation between end diastolic pressure (LVEDP) (nonlinear regression analysis r = 0.94, p < 0.001, n = 60) as well as pulmonary capillary wedge pressure (PCWP) (r = 0.73, p < 0.001, n = 30). Another study (29) demonstrated this BNP correlation with right sided ventricular volume overload – due to ventricular septal defect – using right heart catheterization and again found the correlation between BNP (as well as ANP) and right ventricular end diastolic pressure to correlate strongly (r = 0.76, p <0.001, n = 44). Importantly, however, it is not so much the (left or right ventricular) ejection fraction (r = 0.58) that determines BNP levels as the right ventricular volume, or its overload (r = 0.88, p <0.001, n = 41)(30) when measured by cardiac magnetic resonance imaging.
2.5.3. Validation of BNP in renal failure
Validation of BNP utility in renal failure patients on chronic hemodialysis have also been done by many, including Antlanger (31) who correlated BNP values to bioimpedance values and found that NT-pro-BNP and the expansion of the Extracellular Water (ECW) space correlated strongly in a multivariate regression analysis (r = 0.438, p < 0.001, n = 288). Validation of BNP in ESRD patients has been done earlier by a Korean group (32) who ever so cautiously concluded that “BNP level seems to have a limited potential for assessment of overhydration in HD patients” even though they correlated BNP values to inferior vena cava diameter and body surface area ratios by 2-D Echocardiography as well as bioimpedance values. They found that
18
the area under the receiver operating curve (ROC) for overhydration by IVC Diameter was 0.819 and when this was measured by bioimpedance then the ECF/TBW ratio was 0.781 for pre-HD BNP level (n = 49 on HD and n = 723 controls). They also tested these measures of fluid overload against ANP and cGMP as well and found similar correlations though to a lesser degree with cGMP.
2.6. The device
Another method to assess fluid excess or perhaps deficit is through a device that is now becoming part of clinical practice. The use of this device is not entirely wide-spread for many reasons. The principal reason for this is perhaps is lack of experience but also because of finances. Clinical experience, for example in the United States is entirely lacking with bioimpedance. American clinicians do not and have not used bioimpedance results to adjust fluid removal or even fluid optimization in direct patient care. The device certainly has been around for a long time and we have known its clinical utility but bioimpedance measurements have not been translated to clinical practice, perhaps clinical research only. Most of the clinical research with bioimpedance has been done outside of the United States thus papers that reported their findings did not reach the American clinical practitioners as clinically applicable method to assess a patient’s fluid status. These papers thus appeared but with less international impact than if the clinical research had been carried out in an American research or clinical environment. Furthermore, payment of performing bioimpedance measurement has not been set either. Because most Asian and European payers pay their clinicians by diagnosis related groups (DRG’s) or most clinicians are on a salary introduction of a novel technology is not rewarded financially. In the American market there is no payment for the measurement in the fee-for-service insurance. The scenario is similar to the reimbursement of ambulatory blood pressure monitoring which only pays around $55 per procedure, the use of ABPM is not as wide-spread as its utility would dictate; at this time bioimpedance has no reimbursement schedule even though it already has a Current Procedural Terminology (CPT) code 0358T.
2.6.1. The mechanism of bioimpedance
The description below is not intended to explain the physics of bioimpedance measurements even though the basic understanding of how this device works is very important and perhaps has clinically relevant aspects. The thorough explanation and description of the physical workings of bioimpedance measurements is beyond the scope of this treatise. Furthermore, the discussion and clinical practice related to bioimpedance studies will refer to the device
19
manufactured by the Fresenius Gmbh Corporation in Bad Homburg, Germany as all of those clinical studies intended to be discussed here were done and performed by using this Fresenius device termed Body Composition Monitor, abbreviated as BCM. When using bioimpedance in the generic form we shall use the proprietary term BCM even though we really should use
“bioimpedance” to discuss the procedure.
2.6.2. Physics
The physics of BCM is based on the conductivity of various body compartments at different rates and resistance values. The BCM generates alternating electric currents at a low voltage from 5 kHz through 1000 kHz at 50 different frequencies. High-frequency current can pass through most tissues and the total body water, while low-frequency, low energy current cannot
“penetrate cell membranes and thus flows exclusively through the extracellular water”(33). The current is passed through the patient using conductive electrodes placed on the foot and the ipsi- lateral hand. The electrodes – similar to EKG electrodes – are to be placed at the level of the medial and lateral malleoli of the ankle, and the other foot electrode at the mid-metatarsal bones of the foot. The upper extremity electrodes are placed between the ulnar head and dorsal radial tubercle and the other at the level of the mid-metacarpals. This way there are two electrodes at the ankle and at the wrist. BCM “determines the electrical resistances of the total body water and the extracellular water” and it “enables clear separation between extracellular and intracellular water by the extremely wide range of measurement frequencies” (33).
2.6.3. Theoretical basis of BCM
The basics of body composition measurements the theory of Hanai (34) in which the fluid filled cylinders will conduct electricity differently, especially if they are of different composition.
BCM measurements rely on the basic resistivity of tissues and the derivatives of these measurements. Resistivity is an intrinsic property of every material unlike resistance.
Resistance increases and is inversely related to cross sectional area. Lean tissues contain about 70% water and the rest is protein and minerals. Fat tissue is no more than 20% water – the rest if lipids – and when excess fluid or overhydration is measured it is a compartment of 100%
water.(35) Therefore, in lean tissue it is the intracellular fluid that is predominant while in the adipose tissue it is the extracellular fluid (36). This is the body composition model as opposed to the pure volume model which only takes intracellular water and extracellular water in account. This way excess fluid is calculated by the various tissue hydration status not only the ratio of intracellular water (ICW) and extracellular water (ECW).
20 2.6.4. Validation of bioimpedance-measured results
The classic methods for measuring total body water space (37) is based on isotope distribution estimation in the extracellular and intracellular water spaces with sodium bromide and potassium isotopes, respectively, deuterium or isotopes of oxygen (38), sucrose or even inulin- based volume measurements (39). These methods that we regard as the gold standard measurements of fluid compartments or that of various tissues such as the volume of fat tissue content are not conducive to daily practice. Fat tissue measurement for example is based on Dual Energy X-ray Adsorption (DEXA) (40) methods but fluid space measurements are based on hemoglobin concentration differences before and after ultrafiltration (41); in the latter study using inulin as well as urea as a marker. These studies mostly done in the 1950’s are the classical methods to validate a new technology assessing fluid spaces but they are not practical for quotidian clinical use. It is also telling that some or many of the science relating to these measurements are published in papers dealing with engineering. Their replacement with a new technology such as the use of bioimpedance is a welcome change. On one hand the technology will preserve the ability to measure fluid spaces and on the other hand the cumbersome method of injecting isotopes, tracers or markers is supplanted.
There have been other methods of assessing fluid overload in clinical practices such as the study we already mentioned by Lee (32) who correlated findings of elevated BNP as a biomarker and the ultrasonographic (2D Echo) measurement of the inferior vena cava (IVC) diameter as well as BCM results. When volume-overload was measured by IVC he found the correlation to be so strong that the area under the ROC curve was 0.766. While his study was primarily a study to correlate BNP with other measurements he found a good correspondence among IVC diameter measurement, BNP and BCM results (ECW/TBW ratios). This study by Lee was carried out among 49 dialysis patients and 723 controls. Such validation is important because it proved the accuracy of the bioimpedance technology not only in physiological circumstances but also in disease states, most notably in the dialysis population.
There had been other methods of validation or observed correspondence between the results of BCM measurements such as vascular pedicle width on chest X-ray and BCM results (42). Some have found a correlation (43) between BCM-directed ultrafiltration results and the decrease of blood pressure together with the successful decrease of antihypertensive medications; a validation on clinical grounds. Validation for the use of the bioimpedance method in hemodialysis patients (44) was performed using the BCM measurement results of 1,540
21
disease-free adults and “back calculating” the body weight, resistance values, age, and height in the hemodialysis population of 483 dialysis patients. The prediction model was thus gained from the healthy individuals and the model was tested to be valid and similarly reliable in the hemodialysis population. The study concluded that “Multiple regression analysis showed a significant relationship among body weight, R, age, and height in 739 men (r2 = 0.82, p <
0.0001) and among body weight, R, and height in 724 women (r2 = 0.68, p <0.0001)” where R denoted resistance.
22
3. O
BJECTIVESWe have thus seen that health care providers practicing their art of medicine to assess the physiologically important fluid status, physical exam fails to give guidance. Physical exam is an inadequate method of assessing fluid overload as well as fluid deficit. In addition to this failure to detect fluid overload physical exam is unable to quantitate fluid excess. The degree of abnormality can be estimated with an even lower degree of accuracy. Hence, a method more reliable, more sensitive and more capable to measure the degree of deviation from normal is needed in clinical practice. This dissertation will thus propose two methods to do just that, one using a biomarker and one using an instrumental examination that should satisfy the requirements alluded to in the above discussion.
The dissertation will examine the following interrelated problems and questions:
• What is the clinical importance of measuring fluid excess in the dialysis population?
• What is the clinical utility of using the volume-related biomarker, BNP? What is the clinical relevance of elevated BNP in patients on dialysis?
• What is the clinical utility of using a device such as bioimpedance in assessing fluid status in dialysis patients?
• How does the use of BNP relate to other methods of volume estimation, such as the bioimpedance measurements?
23
4.
M
ETHODS4.1. Patient population of BNP studies:
This study (45) was “approved by the institutional review board of the Louisiana State University Health Sciences Center in Shreveport. This is a prospective observational feasibility pilot study of 19 consecutively admitted veteran patients who were acutely hospitalized in the Veterans’ Administration Hospital in Shreveport, LA, and were determined during their hospitalization to need dialysis. The purpose of this study was to evaluate the clinical utility of making clinical decisions for ultrafiltration based on patients’ BNP values. Eleven patients were prevalent ESRD dialysis patients and 8 were incident dialysis patients. Two of the 19 patients had temporary femoral dialysis catheters, while others had a tunneled dialysis catheter or an arteriovenous fistula or graft. They were evaluated by us as nephrology consultants. These patients were admitted for various indications to the general medical or surgical wards such as pneumonias, cardiac arrhythmias, bone fracture, CHF, chest pain, alcohol withdrawal, gastrointestinal bleeds, and other indications. Their indications for hospital admission varied and their symptoms were often unrelated to the concurrent presence of volume overload.” The characterization of this population best described by Table 2, below.
These are essentially all African American male military veterans from the Viet Nam era though there were a few patients from World War II. who served in various military theaters. Their socio-economic status was determined by their historical status as living in the “Deep” South and their schooling which was rarely ever higher than high school degree and their body mass index (BMI) was close to 30 kg/m2 indicating that they were obese.
24
Table 2: Demographic, clinical and laboratory characteristics of the BNP study population CHF: Congestive Heart Failure (after reference #(45)
DEMOGRAPHICS n=19
Age [years] 68 ± 11
Gender [male/ female] 19/0
Body Mass Index [kg/m2] 29.6 ± 9.6
Diabetes Mellitus [%] 14/5 (73/27)
Incident/ Prevalent ESRD [%] 8/11 (42/58) CHF diagnosed on admission 8/11 (42/58) Chest pain on admission [%] 3/16 (15/85) Ejection Fraction [%] n=16 43.8 ± 15.5 Dialysis access:
Fistula/Graft/Tunneled
Catheter/Temporary Catheter [%]
9/1/7/2 (47/5/37/11)
Blood Urea Nitrogen [mg/dL] 60.9 ± 38
Creatinine ]mg/dL] 7.06 ± 4.50
Albumin [g/dL] 3.1 ± 0.6
C-Reactive Protein [mg/L] 7.06 4.5
Hematocrit [%] 35 ± 9.2
Intact Parathyroid Hormone [pg/mL] 361 ± 363
Calcium [mg/dL] 8.5 ± 0.8
Erythropoetin dose [units/ week] 14,839 ± 1,479 Length of hospital stay [days] 17.2 ± 15.7
25 4.2. BNP-Study design
This (45) was a prospective observational feasibility pilot study of 19 consecutively admitted veteran patients who were acutely hospitalized in the Veterans’ Administration.
“After conventional hemodialysis was started in the hospital, UF was commenced based on the admission BNP value. The UF was targeted to achieve a BNP goal of 500 pg⁄mL. UF was limited to 5 L per session. A descending UF profiling was used in every patient’s treatment, and sodium profiling was avoided considering that these were volume-overloaded patients. UF was halted if the patient’s systolic BP dropped suddenly or below 100 mm Hg. Dialysis was delivered thrice weekly with UF, and isolated UF was delivered thrice weekly between dialysis days, achieving a 6-times-a-week treatment schedule. Hemodialysis was delivered using a Fresenius 2008K (Fresenius AG, Bad Homburg, Germany) volumetrically controlled hemodialysis machine with Fresenius Optiflux 160 dialyzers. BNP values were measured before dialysis; immediate post-dialysis values were not measured. The decision to continue UF was based on the next-day predialysis BNP value. The patients’ indication for UF was evaluated based on the morning BNP value. Since the target BNP was 500 pg⁄mL, patients were deemed volume-overloaded if the BNP was >500 pg⁄mL.
The decision to discharge these patients were made by the primary medical or surgical team after considering the patients’ medical, financial, and social realities, which were admittedly less than ideal. We used the nonparametric Wilcoxon matched pairs test for BNP, body weight, and BP and the Student t test for the other continuous data to calculate significance.” Although we designed this as a pilot study we did not change the level of significance, that is, we left the p value at 0.05.
4.2.1. BNP-studies’ population behavior
Parenthetically, we characterized this population in another, cross sectional study (46) when we evaluated their degree of adherence to the prescribed dialysis schedule. This population was the basis of three studies with BNP. These patients (n = 97) were in the exact same city - Shreveport, LA; USA – living under the exact same condition, perhaps being disadvantaged over the veteran population in that their health care finance was not taken care of and they only received Medicare coverage (US elderly patients’ retirement fund financed though the Federal Government) and maybe public assistance. Otherwise this patient population was taken from the same social, genetic and geographic pool. These two cohorts, the veterans and the
26
community dialysis patients are representative samples of the same population. These patients in this study of compliance had an average achieved Kt/V of 1.4 ± 0.28, a dialysis vintage 5.7
±4.7 years. The focus of our study was to assess their behavior with respect to adherence to medical advice. We compared them to the findings of non-adherence indicators established by the Dialysis Outcomes and Practice Patterns Study (DOPPS Study).(47) We found that “Most (95.8%) patients were of African American ancestry and had a longer vintage on dialysis.”
4.3. Patient population for BCM studies
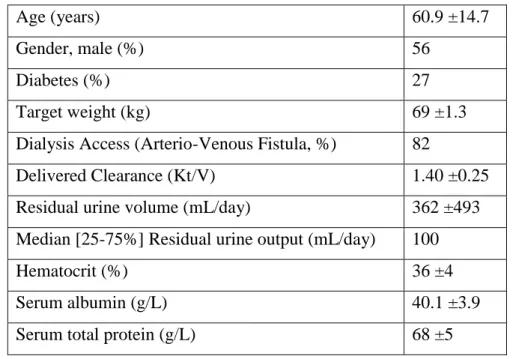
The patient population of seven studies (48) we performed using the bioimpedance apparatus was decidedly different from that of the BNP studies previously described. This was an East European population of all White people in Budapest, Hungary at Semmelweis University in a single chronic dialysis facility operated by a for-profit chain provider (Fresenius Medical Care) as a contractor for the universal health care system paid by a single, state payer. Patients were treated at this facility from a single territory of no more than 50 miles radius and were all provided free transportation to and from the dialysis facility. The facility treated an average of about 120 patients with end stage renal disease with thrice weekly hemodialfiltration. The patients’ target hemodiafiltration achieved Kt/V was targeted to be above 1.3 and the replacement fluid for the treatment to be greater than 21 liters. All hemodiafiltration treatments were performed using on-line generated replacement fluid and all dialysis membranes were of polysulfone manufactured by the same provider. The indices of our patient population is described by one of our publication where we were able to their behavior regarding their interdialytic fluid gain. Table 3 describes some of their dialysis-related characteristics.
27
Patient characteristics of BCM study population
Table 3. Patient population (n = 100) characteristics after data in reference number " (48)
Age (years) 60.9 ±14.7
Gender, male (%) 56
Diabetes (%) 27
Target weight (kg) 69 ±1.3
Dialysis Access (Arterio-Venous Fistula, %) 82
Delivered Clearance (Kt/V) 1.40 ±0.25
Residual urine volume (mL/day) 362 ±493
Median [25-75%] Residual urine output (mL/day) 100
Hematocrit (%) 36 ±4
Serum albumin (g/L) 40.1 ±3.9
Serum total protein (g/L) 68 ±5
4.4. BCM-population patient behavior
Just as we characterized our patient population for the BNP studies by their behavior relating to their dialytic, renal replacement therapy we also attempted to characterize the patient population that was the basis of our bioimpedance studies. This population of Hungarian patients could be described in many aspects and many respect, however, one behavior that we can examine is also listed in the Dialysis Outcomes and Practice Pattern Study (DOPPS) as an outcome determinant behavior and that is the interdialytic weight gain (IDWG). As we have already seen in the Saran (47) article the non-adherence measures are phosphate level, IDWG, cutting dialysis session by >10 minutes and skipping >1 dialysis sessions a month. Their study concludes that “Nonadherence was associated with increased mortality risk (skipping treatment, excessive IDWG, and high phosphate) and with hospitalization risk (skipping, high phosphate)”. The relative risk (RR) of death compared to the adherent patient was 1.12 for increased IDWG, 1.30 for skipping HD and 1.11 for shortening treatment time and phosphate had a RR of death of 1.17. Hyperkalemia, just as in other studies has the lowest RR, 1.04. The greatest risk factor for abnormally high IDWG is dialysis facility size (>125 patients).
28
Interestingly enough the DOPPS study found that the Japanese patients were the most non- adherent with IDWG (34.5%) compared to the American (16.8%) or European (11.0%) patients.
4.5. The clinical utility of using a device for fluid space estimation: bioimpedance
4.5.1. Methods of BCM studies for fluid overload, antihypertensive medications and obesity This (49) was a cross sectional study of prevalent hemodialysis patients of the same data base as mentioned above involving 79 patients. “Patients with edema, or ulceration, or those who declined participation were excluded from the study. We collected their monthly laboratory data and their demographic data (Table 3) from the medical records. We prospectively measured their predialysis fluid volumes and degree of OH by a portable whole body, ankle-to-wrist bioimpedance monitor (BCM—Body Composition Monitor; Software version 3.2; Fresenius Medical Care Ag., Bad Homburg, Germany). The instrument calibration was checked and verified monthly as prescribed by the manufacturer. The patients were asked to lay flat just prior to their hemodialysis session in their reclining dialysis chair. Disposable electrode strips provided by the manufacturer were placed on the dorsal surfaces of the hand and foot, at the wrist and distal metacarpal bones over the knuckles, and at the mid-ankle and distal metatarsal bones, respectively. The patients’ age, gender, height, weight, and blood pressure were fed into the BCM and then assuring that no contacts were made between the patient and conductive surfaces and far from any potential instruments with an electric field—such as dialysis machines, electrocardiogram (EKG) monitors, and television sets—in a room separate from the place where their dialysis session was to be delivered, the measurements were recorded. BCM measurements were performed in a separate room, purely for our convenience; to perform accurate BCM measurements, it is not necessary to use a separate room. The BCM instrument returns measurements on OH in liters (L), total body water (TBW) in liters, extracellular water (ECW) in liters, urea distribution volume (V) in liters, intracellular water (ICW) in liters, lean tissue mass (LTM) in kg/%, and body mass index (BMI) in kg/m2. Overhydration is a part of the extracellular volume, measured by a model developed by Hanai; the OH is calculated on measurement values, using a model of two conductive fluids (33, 34). Body fat is calculated by the BCM instrument based on the internal algorithms set by the manufacturer. Prior to initiating a clinical study with the use of BCM hydration, blood pressure and antihypertensive medications were only managed based on clinical impression and the clinical signs and symptoms of volume excess or deficit. Laboratory testing was performed in the clinical laboratory of Semmelweis University School of Medicine (Budapest, Hungary) accredited
29
laboratory meeting all clinical and scientific standards and calibrations required by the State.
These laboratory tests were collected midweek for the dialysis patients’ monthly laboratory monitoring. The blood pressure measurements included in the study were collected at the beginning of the dialysis session. Calculations were performed by mathematicians at the Louisiana State University Shreveport, Louisiana. Correspondence of clinical data was performed using GraphPad Prism (GraphPad Software, Inc.) software using linear regression analysis, Student’s t test as appropriate. Multivariate regression analysis was also performed using SPSS (IBM Corporation, Somers, NY).”
4.6. Whence doth the ultrafiltrate come?
Considering that we are discussing the accurate measure or at least the estimation of fluid status of dialysis patients the question where the ultrafiltrate comes is the next logical step. Do we know when we remove fluid from patients where this fluid is removed from, which fluid compartment is affected by ultrafiltration the most? In order to investigate this question and to assess what we are really doing to patients we devised a cross sectional study of the same patient population described before.
30
4.6.1. Methods of fluid space determination in dialysis patients
We randomly selected 40 prevalent stable dialysis patients (50) on chronic HD for at least 3 months preceding the BCM measurements in order to assess which fluid space was affected by ultrafiltration. All patients signed an informed consent for the study. All patient were selected from the same dialysis unit we already described before, “patients with known heart disease, absent limbs, acute renal failure, those with a pacemaker or with a skin disease, as well as hemodynamically unstable patients were excluded from the study.” “All measurements took place in connection with the same mid-week dialysis session. After patients consented to the study, their height was recorded and they were carefully weighed and their when undressed to their underwear. Body mass index (BMI) was calculated as weight (kilograms)/(height in meters)2.They were asked to lay flat in an examination room at the dialysis unit.” …”We measured the various fluid spaces using a portable, whole-body ankle-to-wrist bioimpedance apparatus” the previously described (49). The multichannel, total body BCM instrument using 50 different frequencies “returns values of measurements on overhydration (OH) in liters (L), total body water (TBW) in liters, extracellular water in liters, urea distribution volume (V) in liters, intracellular water (ICW) in liters, lean tissue mass in kilograms”. OH is a calculated value, it is part of the ECV which is greater than the anticipated value based on the previously described validation studies. “Blood pressure recordings were obtained by the dialysis unit staff in a sitting position with the arm supported, 5 minutes after being seated in the dialysis unit, using aneroid sphygmomanometers by the auscultatory technique. All BPs readings were obtained in duplicate, and the average of these two readings was recorded. After the first BCM measurement, patients walked to their dialysis chairs and started their HD sessions.
Ultrafiltration was carried out using the interdialytic weight gain based on their previous post- dialysis body weight corrected to the value to remove the amount shown as OH. The maximum UF value was set to be 12 mL/kg/h. The dialysis unit’s Fresenius 5008 dialysis machines (Fresenius AG) were programmed, as part of the unit’s protocol, to deliver a decrescendo linear UF profile, removing the maximum amount of fluid in the beginning and least at the end. No sodium profiling was performed, the dialysate sodium concentration was set at 138 mmol/L, the dialysate temperature at 36 °C. Immediately after the completion of the dialysis session, patients were asked to return to the examination room where the BCM measurement was repeated within 15 minutes of the end of dialysis”. “Data were then tabulated using Microsoft Excel (Microsoft Office 2010, Redmond, WA, USA) and reported as mean ± standard deviation. Statistical analysis was performed with InStat Prism® (GraphPad Software, Inc., La
31
Jolla, CA, USA) and Statistical Package for the Social Sciences 19 (IBM Corporation, Armonck, NY, USA). We utilized Wilcoxon matched pairs signed-rank to test the significance of differences between predialysis and postdialysis values. Association between BMI and EC volume expansion was examined using correlation coefficients.” Considering that we used the very same patient population as described before the description of this cohort (n = 40) will only be expanded or specified by the extra information that the pre-dialysis body weight was 71.0 ±15.5 kg and the population serum albumin level was 3.85 ±0.43 mg/dL.
4.7. Confirmatory study for changes in fluid spaces due to diuretics in hypertensive patients In a cohort of 60 hypertensive patients referred to hypertension specialty clinic we examined (51) what diuretics can do to fluid spaces using the same bioimpedance technology previously described (49, 50). This was a retrospective study of “60 consecutive patients in the hypertension clinic… referred for undergoing bioimpedance fluid space measurements in order to elucidate an underlying fluid excess contributing to difficult-to-control hypertension. All patients had been screened for underlying metabolic, hormonal, and renal abnormalities as the etiology of their hypertension, and, by exclusion, were found to have essential hypertension. In this particular cohort, normal renal function was defined as serum creatinine <1.4 mg/dL and no underlying renal pathology by a comprehensive laboratory and imaging evaluation. They were all stable on their chronic medical therapy (no interval antihypertensive medication changes >3 months). BP was measured in accordance with the 2013 European Society of Hypertension/ European Society of Cardiology Clinical Practice Guidelines1 in a sitting position at rest by a nurse using an oscillometric automated BP meter (Omron M4-I; Omron Healthcare B.V., Hoofddrop, The Netherlands). Patients’ bioimpedance indices were measured using a regularly calibrated BCM multifrequency bioimpedance apparatus… in a manner previously described”. “Statistical comparisons between variables were calculated with t test for continuous variables and with nonparametric testing (chi-square) for categorical variables.
Linear regression analysis was performed with dependent variables of age, sex, presence of diabetes mellitus, number of antihypertensive medications, BMI, presence of (thiazide-type) diuretics, percentage of OH of ECV, fat mass (percentage of body weight), and creatinine clearance (according to Cockroft-Gault) to examine predictors of ICV:ECV ratio.”
“The study population included 60 patients, aged 62.1±13.2 years, with 63.3% men and 30%
diabetic (Table 9). Serum creatinine for the cohort was 1.08 ±0.24 mg/dL, with a calculated creatinine clearance according to the Cockcroft-Gault equation of 82.3 ±32.5 mL/min. Fourteen
32
(23.3%) of the patients had calculated creatinine clearance <60 mL/min, with a mean of 52.3
±5 mL/min. Serum potassium was well preserved at 4.3 ±0.4 mEq/L.”
4.8 Putting the marker (BNP) and the device (BCM) together; synthesis
Now that we have examined how the biomarker BNP fares in clinical practice when assessing fluid status and we have seen how the bioimpedance apparatus is used to establish patients’
overhydrated status both in the dialysis population and in the non-dialysis, hypertensive population the question arises how these methods may relate to each other. The question is whether assessing the fluid status of a patient with BNP or BCM result the same assessment and whether establishing a patient’s fluid status by one method can be concluded by the other.
We have also seen that physical examination falls short of the correct assessment and when the physical exam is compared either to BCM or to BNP the results can be quite surprising and contrary to the established wisdom of correct assessment by the physical exam.
4.8.1. Study design: BNP vs. BCM
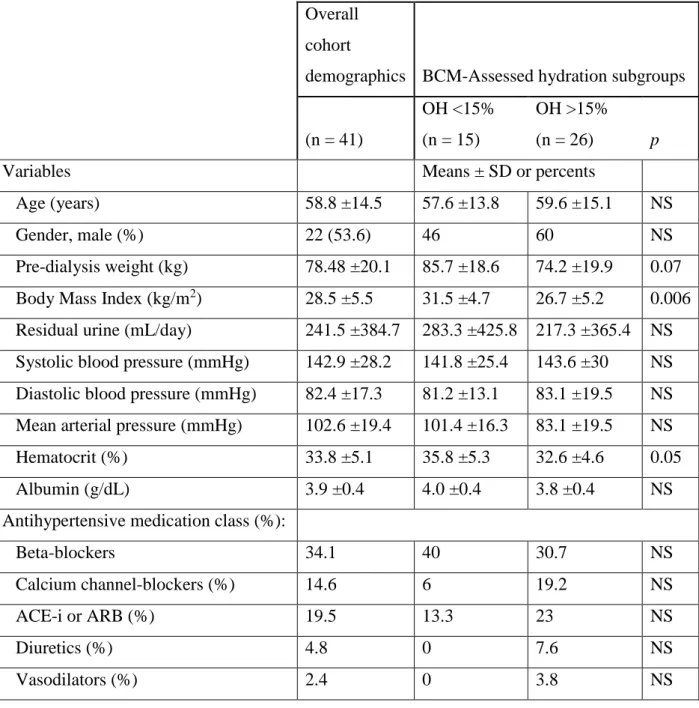
Thus, we designed a study (52) to establish the above concordance between the two measurements by this observational cohort study that evaluated the correspondence between bioimpedance-measured overhydration percentage (OH%) and BNP. We measured predialysis OH% by bioimpedance apparatus and BNP by microparticle enzyme-linked immunoassay in 41 prevalent stable hemodialysis patients, 19 (46%) women, aged 58.9 ±14.5 years.” The cohort, where we took our sample for this study was from the same previously described and discussed. The cohort’s characteristics are listed in table 4. The BCM measurements were taken the exact same manner as previously described using electrodes at the mid-metatarsals and between the medial and lateral malleoli on the foot and also between the radial and ulnar tuberosities in the wrist and mid-metacarpals. Patients were lying on an examination table away from conducting materials before their dialysis sessions. “Venous blood samples for BNP were taken after the bioimpedance measurements but prior to the dialysis session; they were processed by the state-certified laboratory without delay using a microparticle enzyme-linked immunoassay (Abbot, Abbot Park, IL, USA).”
33
Demographics for the BNP vs. BCM study population
Table 4. (after Table 1. in reference #(52) Demographics and groupings for volume estimation in dialysis patients: The concordance of Brain-Type Natriuretic Peptide measurements and bioimpedance values. Data are expressed as percents (%) for categorical variables and means
±SD for continuous variables. The division of the entire cohort based on BCM OH% is depicted in the third and fourth columns. P-values are denoted when significant or borderline. BCM = Body Composition Monitor; NS = not significant; OH = overhydration; SD = standard deviation. ACE-i = Angiotensin Converting Enzyme inhibitor; ARB = Angiotensin Receptor Blocker
Overall cohort
demographics BCM-Assessed hydration subgroups
(n = 41)
OH <15%
(n = 15)
OH >15%
(n = 26) p
Variables Means ± SD or percents
Age (years) 58.8 ±14.5 57.6 ±13.8 59.6 ±15.1 NS
Gender, male (%) 22 (53.6) 46 60 NS
Pre-dialysis weight (kg) 78.48 ±20.1 85.7 ±18.6 74.2 ±19.9 0.07 Body Mass Index (kg/m2) 28.5 ±5.5 31.5 ±4.7 26.7 ±5.2 0.006 Residual urine (mL/day) 241.5 ±384.7 283.3 ±425.8 217.3 ±365.4 NS Systolic blood pressure (mmHg) 142.9 ±28.2 141.8 ±25.4 143.6 ±30 NS Diastolic blood pressure (mmHg) 82.4 ±17.3 81.2 ±13.1 83.1 ±19.5 NS Mean arterial pressure (mmHg) 102.6 ±19.4 101.4 ±16.3 83.1 ±19.5 NS
Hematocrit (%) 33.8 ±5.1 35.8 ±5.3 32.6 ±4.6 0.05
Albumin (g/dL) 3.9 ±0.4 4.0 ±0.4 3.8 ±0.4 NS
Antihypertensive medication class (%):
Beta-blockers 34.1 40 30.7 NS
Calcium channel-blockers (%) 14.6 6 19.2 NS
ACE-i or ARB (%) 19.5 13.3 23 NS
Diuretics (%) 4.8 0 7.6 NS
Vasodilators (%) 2.4 0 3.8 NS
34
5.
R
ESULTS5.1 Results of the BNP studies’ population behavior and adherence study
Most patients were non-adherent as assessed by 2 of 4 measures of dialysis adherence: 29.2%
of patients did not attend at least 1 dialysis session per month, and 86.4% shortened their dialysis session by 10 minutes or more at least 1 per month (46).
These parameters were identified as major risk factors for adverse outcome in the DOPPS study.
While we found this patient population rather non-adherent there was an interesting pattern of their non-adherence. Patients would be more adherent in aspects they could help, diet, that is and less adherent that was out of their control: cutting the dialysis session short and missing dialysis sessions. This was a poor cohort who would regularly miss dialysis sessions or short treatment time but this they did because they could only get county transportation (free bus ride through the county’s social services) and when the bus came they get off dialysis at once so as not to miss their ride. If they missed the ride from home to the dialysis they would miss dialysis.
At the same time, when compared to the general American DOPPS population their interdialytic weight gain and their phosphate control was better. To “watch their diet” no extra resources were necessary and they did show that they made an effort even though the difference between the DOPPS cohort and the Louisiana cohort did not reach statistical significance due to the number (97) of Louisiana patients (46).
5.2. BCM-study population behavior results
We investigated (48) the interdialytic fluid excess in our patient population in a retrospective study of a sample size of 100 patients which was effectively all of our patients considering that we had about 16 peritoneal dialysis patients and some were either hospitalized or away the facility. This and all studies presented herein conformed to the ethical principles for medical research involving human subjects in the Declaration of Helsinki (as revised in Tokyo 2004) and was formally reviewed and approved by the Hungarian Ministry of Health, Independent Review Board. In this particular study we sought to find out “whether ambient temperature and relative air humidity had any effect on IDWG in our ESRD patients. Our study hypothesis was that excessive variation of outside temperature and/or humidity may have explained some of the session-to-session variations in weight gains observed between sessions of renal replacement therapy”. This was a retrospective, cross sectional study, a chart review of existing data. We chose 3 different days to assess the climatic effect on IDWG; Weekend_1 was humid
35
(93 % humidity) and warm (24 °C); Weekend_2 was dry (38 % humidity) and hot (33 °C), and Weekend_3 was dry (30 % humidity) and warm (24 °C). These temperature and humidity values refer to the highest values on both of the week-end days preceding the first dialysis of the week. All patients received hemodiafiltration using a dialysate with a sodium content of 138 mEqu/L at 36 °C temperature.
The results of the study showed little effect or influence of the weather on patient’s IDWG. The results are summarized by the plot graph in Figure 1 below.


![Table 5. [Reference #(48)] Interdialytic weight gains under specific climatic conditions](https://thumb-eu.123doks.com/thumbv2/9dokorg/1366279.111618/38.892.136.763.894.1086/table-reference-interdialytic-weight-gains-specific-climatic-conditions.webp)


![Figure 4. Hospital days vs. body weights and BNP Hospital days, body weights [kg] and BNP values of a representative patient case with hypervolemic bleeding](https://thumb-eu.123doks.com/thumbv2/9dokorg/1366279.111618/44.892.109.788.363.913/figure-hospital-weights-hospital-weights-representative-hypervolemic-bleeding.webp)
