Examination of the complement system activation in ischemic heart disease patients
Ph.D. Thesis
Zsófia Horváth, MD
Semmelweis University Doctoral School of Basic Medicine
Supervisor: Róbert Gábor Kiss, MD, DSc.
Official reviewers: Tamás Habon, MD, Ph.D.
Balázs Sax, MD, Ph.D.
Head of the Final Examination Committee:
István Karádi, MD, DSc.
Members of the Final Examination Committee:
Gabriella Masszi, MD, Ph.D.
Dávid Becker, MD, Ph.D.
Budapest 2016
1 1. INTRODUCTION
Atherosclerotic coronary heart disease (CHD) is the leading cause of morbidity and mortality in the Western world.
Previous data obtained from animal models or clinical studies emphasized the importance of the complement system in the pathogenesis of CHD.
The complement system is a biochemical cascade system, which consist more than 30 proteins circulating in the blood.
Most of these proteins are inactive proenzymes until cleaved by proteases. The complement system can be activated via three different mechanisms, namely by the classical, the alternative or the lectin pathway. The classical pathway is typically initiated by IgM or IgG - antibody/antigen immune complexes. In contrast; the alternative pathway is activated in an antibody-independent manner, mostly by “foreign surfaces”
through the spontaneous hydrolysis of C3 to C3b. The lectin pathway is triggered by the binding of MBL (mannose binding lectin) or ficolins to special carbohydrate structures on the surface of microorganisms or apoptotic cells. The initiation of each pathway eventually results in the formation of terminal C5b-9 complex (TCC) - the MAC (membrane attack complex) - responsible mostly for cell lysis and for the activation of macrophages.
2
Complement activation has essential role in the development of atherosclerosis, the formation and rupture of the atherosclerotic plaques. However, most of the studies examined the complement C3 protein, while others were studied less frequently. Furthermore, data are lacking concerning complement system activation in stable angina pectoris (SAP) and during invasive coronary procedures performed in SAP (diagnostic coronary angiography and percutaneous coronary intervention).
Patients with typical angina pectoris and inducible myocardial ischemia, but with macroscopically healthy coronaries (NC group) have become commonly known in the literature as “Cardiac Syndrome X” (CSX). It’s important to note that in this patient population, even after adjusting for traditional cardiac risk factors, significantly increased risks of future major adverse cardiac events and all-cause mortality was found compared to a normal population without ischemic heart disease. Data regarding complement activation in this patient population are lacking.
2. OBJECTIVES
The main aim of the series of investigations was to assess the complement system activation in stable ischemic heart disease
3
patients and to determine the effect of invasive coronary procedures in these patients population.
Our goals were the following:
1.) To clarify the extent and clinical significance of complement activation in patients with angiographically proven coronary artery disease (CHD).
In this part of our study, we examined the complement activation in CHD patients and we compared them to SAP with negative coronary angiogram and to the cohort of healthy volunteers. Furthermore, we studied the predictive role of the complement activation products.
2.) To clarify the extent of complement activation after invasive coronary procedure.
Since several data indicate inflammatory response after invasive coronary procedure, we examined in the second part of the study the complement activation after both diagnostic coronary angiography (CORON) and percutaneous coronary intervention (PCI). As control, we elucidated the complement activation after primary PCI performed in ST-elevation acute coronary syndrome patients (STEMI-PCI).
4
3.) To clarify the role of lectin pathway activation and ficolins in stable angina patients with macroscopically healthy coronaries.
In the first part of our study, the level of SC5b-9 (TCC) was increased in patients with macroscopically healthy coronary arteries (NC) compared to those with angiographically proven coronary atherosclerosis. Since no parallel activation of the classical, or the alternative complement pathway was observed, our findings indicated the potential involvement of the lectin pathway in the NC patient population. Based on these results, our aim was to clarify the role of lectin pathway activation and ficolins in the NC patient cohort.
3. METHODS
3.1. Patient population
We recruited 76 patients with the clinical diagnosis of stable angina undergoing invasive diagnostic coronary angiography at our institute (SAP, n=76). All patient had ishemia provocation tests with inducable ischemia. The enrolled patients were divided into three groups:
5
- SA-PCI group (n=24): SAP patients with significant (>70
% of diameter) coronary stenosis. In each patients successful PCI was performed (with implantation of bare metal stents/
drug eluted stent/ POBA) in order to recanalize the stenotic coronary artery.
- PC group (n=27): SAP patients undergoing elective coronary angiograpy without PCI. In this patient group, coronary angiography revealed either tree-vessel disease or non-significant coronary artery disease.
- NC group (n=25): SAP patients with macroscopically normal coronary arteries.
Two groups served as controls:
- STEMI-PCI (n=23): Acute (<12 hours) STEMI based on the presence of permanent chest pain (>30 min) and ST- segment elevation on ECG. In all cases, the culprit coronary artery was successfully recanalized.
- HC group (n=115): Healthy individuals.
3.2. Laboratory methods
For the determination of complement activation products, 14 ml of venous blood was drawn from the cubital vein into EDTA-anticoagulated and serum-separating tubes before
6
coronary angiography. After coronary angiography, blood samples were taken 6 and 24 hours later. Peripheral blood samples were drawn from healthy subjects similarly. Plasma and serum were separated by centrifugation at 3000 rpm for 10 minutes at room temperature. The samples were frozen immediately to -80 ºC in aliquots and were thawed only before the measurement of complement activation products.
The plasma levels of C1rC1sC1inh, C3bBbP, SC5b-9, and the serum levels of ficolin-2, ficolin-3, the ficolin-3/MASP-2 complex and MAP-1 were determined by standardized, home-made enzyme-linked immunosorbent assays (ELISA), as previously described.
3.3. Statistical analysis
The statistical analysis was performed with GraphPad Prism v4.0 (GraphPad Software Inc, San Diego, CA, www.graphpad.com) and SPSS v13.0 (SPSS Inc., Chicago, IL) software. Since most data exhibited non-Gaussian distribution, we used non-parametric test throughout.
Differences between the subgroups were evaluated by the Mann - Whitney, or Kruskal - Wallis tests or by the Wilcoxon signed-rank test, or Friedman test for repeated measures, followed by the Dunn post hoc test. Categorical variables were compared with Fisher’s exact test. Univariate
7
association was re-evaluated by multiple logistic regression.
All tests were two-tailed and the significance level was put at a value of p < 0.05.
4. RESULTS
4.1. Plasma levels of complement activation products in CHD patients
First, we compared the plasma levels of the complement activation products of all SAP patients (n=76) to healthy controls. The plasma concentrations of C1rC1sC1-INH (M(median) and [IQR(interquartile range)]: 13.31 AU/ml [ 9.18-18.0 AU/ml] vs. HC: M: 7.71 AU/ml [3.9-9.68 AU/ml];
p<0.0001), as well as of SC5b-9 (2.43 AU/ml [1.78-4.7 AU/ml] vs. HC: 1.79 AU/ml [0.85-2.76 AU/ml]; p<0.0001) were significantly higher in stable angina patients compared to healthy controls. The plasma level of C3bBbP did not differ in HC compared to SAP (SAP: 6.27 AU/ml [4.06-9.37 AU/ml]
vs. HC: 7.65 AU/ml [5.6-17.68 AU/ml]).
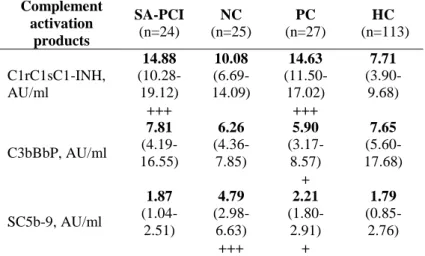
Second, we compared the plasma complement activation products of each SAP subgroup to HC group, separately (Table 1). Importantly, the concentration of C1rC1sC1inh was significantly (p<0.0001) higher in CHD (SAPCI, PC) as compared to HC (Table 1). By contrast, no significant
8
difference was observed between the NC group and the HC group. When analyzing the concentration of C3bBbP, no significant difference was observed between the SA-PCI, PC, and NC groups, and the healthy population (Table 1).
Interestingly, the SC5b-9 plasma levels were significantly higher in the NC group (p<0.0001), and – to a lesser extent – in the PC group (p= 0.032), compared to the healthy population (Table 1).
Table 1: Plasma levels of complement activation products in stable angina pectoris patients and in healthy controls
Complement activation
products
SA-PCI (n=24)
NC (n=25)
PC (n=27)
HC (n=113)
C1rC1sC1-INH, AU/ml
14.88 (10.28- 19.12) +++
10.08 (6.69- 14.09)
14.63 (11.50- 17.02) +++
7.71 (3.90- 9.68)
C3bBbP, AU/ml
7.81 (4.19- 16.55)
6.26 (4.36- 7.85)
5.90 (3.17- 8.57) +
7.65 (5.60- 17.68)
SC5b-9, AU/ml
1.87 (1.04- 2.51)
4.79 (2.98- 6.63) +++
2.21 (1.80- 2.91) +
1.79 (0.85- 2.76)
Abbreviations: PCI: CHD patients who underwent PCI, NC: SAP patients with negative coronary angiography, PC: CHD patients with positive coronary angiography who did not undergo PCI
+p<0.05, ++p<0.0001 compared to the healthy control group
9
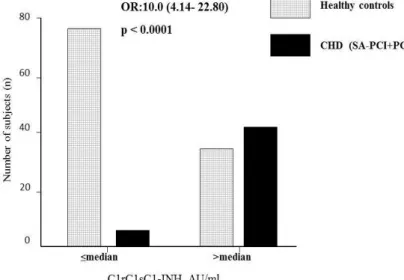
4.2. C1rC1sC1inh as a biomarker of coronary atherosclerosis
The whole study population was divided into two groups ("high" and "low") based on the median value (median (M):
9.1 AU/ml) of plasma C1rC1sC1-INH. The "high" group was defined as individuals with C1rC1sC1-INH plasma levels over the median, whereas the "low" group was defined as individuals with C1rC1sC1-INH plasma levels ≤ median (Figure 1). When analyzing CHD patients with angiographically proven coronary atherosclerosis (SA-PCI and PC groups collectively), significantly more patients belonged to the "high" group compared to HC (Figure 1). Owing significant differences (in age, sex, BMI, triglycerides, cholesterol and creatinine levels) between patients with coronary atherosclerosis and healthy controls, we performed a multiple logistic regression analysis. The differences in C1rC1sC1-INH level remained significant even after adjustment for the above parameters (p<0.026, OR: 65.3, Cl:
1.628-2616.284). Out of all the other variables, only age correlated significantly with the presence of coronary atherosclerosis.
10
Figure 1. Comparison of the subjects with high (>median), or low (≤median) C1rC1sC1-INH plasma concentration.
P value for Fisher’s exact test is indicated.
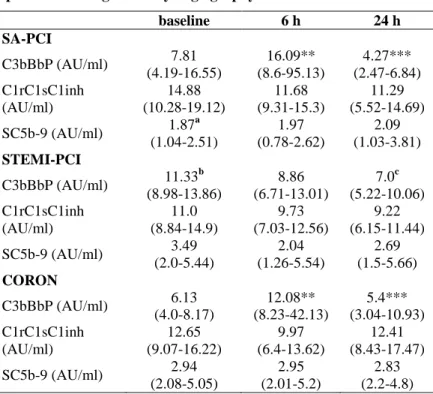
4.3. Complement activation after PCI/ coronary angiography in SAP group
The plasma levels of several complement activation products were tested longitudinally, 6 hours and 24 hours after coronary angiography/ PCI and were compared to baseline values (Table 2). We found that in the SA-PCI group, C3bBbP plasma concentration increased significantly 6 hours after the PCI (p<0.01), whereas a significant decrease was observed at 24 hours (6 hours vs. 24 hours: p<0.0001). Similar kinetics
11
was observed in the CORON group (baseline vs. 6 hours:
p<0.0001, 6 hours vs. 24 hours: p< 0.01) (Table 3). Figure 2.
shows the changes of plasma C3bBbP levels after coronary angiography/ or PCI in all SA groups (SA-PCI, CORON) (baseline vs. 6 hours: p<0.001, 6 hours vs. 24 hours: p<
0.001).
The whole stable angina patient population was divided into tertiles, creating three groups based on plasma C3bBbP levels at 6 hours (T1: <9,29 AU/ml, T2: 9,29-28,04 AU/ml, T3: >28,04 AU/ml). Analysing SAP patient’s characteristic in the highest tertile (T3), we detected that they had significantly higher levels of CK (135.71 ± 62.46 U/ml vs.
68.0 ± 87.67 U/ml, p=0.014) and creatinine levels (102.07±
41.01 µmol/l vs. 64.67 ± 32.07 µmol/l, p=0.011) at 24 hours, furthermore, they received significantly more contrast material volume (157.36 ± 126.46 ml vs. 115.54 ± 120.89 ml, p=0.033), compared to the patients in the lowest tertile (T1).
Reflecting this phenomenon the plasma level of C3bBbP at 6 hours showed significant correlation with CK and creatinin levels at 24 hours (r=0.41, r=0.4, p<0.05 respectively) and the applied contrast material volume (r=0.3, p<0.05).
By contrast, plasma levels of C1rC1sC1inh and the terminal complex (SC5b-9) did not change significantly at 6 and at 24 hours in stable angina patient groups (Table 2).
12
Table 2. Changes in plasma levels of the complement activation products during coronary angiography/ or PCI.
baseline 6 h 24 h
SA-PCI
C3bBbP (AU/ml) 7.81 (4.19-16.55)
16.09**
(8.6-95.13)
4.27***
(2.47-6.84) C1rC1sC1inh
(AU/ml)
14.88 (10.28-19.12)
11.68 (9.31-15.3)
11.29 (5.52-14.69) SC5b-9 (AU/ml) 1.87a
(1.04-2.51)
1.97 (0.78-2.62)
2.09 (1.03-3.81) STEMI-PCI
C3bBbP (AU/ml) 11.33b (8.98-13.86)
8.86 (6.71-13.01)
7.0c (5.22-10.06) C1rC1sC1inh
(AU/ml)
11.0 (8.84-14.9)
9.73 (7.03-12.56)
9.22 (6.15-11.44) SC5b-9 (AU/ml) 3.49
(2.0-5.44)
2.04 (1.26-5.54)
2.69 (1.5-5.66) CORON
C3bBbP (AU/ml) 6.13 (4.0-8.17)
12.08**
(8.23-42.13)
5.4***
(3.04-10.93) C1rC1sC1inh
(AU/ml)
12.65 (9.07-16.22)
9.97 (6.4-13.62)
12.41 (8.43-17.47) SC5b-9 (AU/ml) 2.94
(2.08-5.05)
2.95 (2.01-5.2)
2.83 (2.2-4.8)
Results are expressed as median, IQR. After repeated measures ANOVA (Friedman test), Dunn's post hoc test compared 6-hour values to the baseline and 24-hour values to the 6-hour values.
*p<0.05, ** p<0.01, *** p<0.001
a Baseline SC5b-9 values of the SA-PCI group compared to the baseline SC5b-9 values of the CA and STEMI-PCI group, p<0.05 b Baseline C3bBbP values of the STEMI-PCI group compared to the baseline C3bBbP values of the CA group and SA-PCI group, p<0.05 c Baseline C3bBbP values compared to the 24 h value, p<0.05
13
4.4. Complement activation in STEMI-PCI group upon admission and after primary PCI
The baseline level of C3bBbP plasma concentration was higher in the STEMI-PCI group compared to SA-PCI (median 11.33 AU/ml vs. 7.81 AU/ml, p=0.11) and to CORON group (11.33 AU/ml vs. 6.13 AU/ml, p=0.0001) (Table 2.) When analyzing the kinetics of the complement activation products after primary PCI, there were no significant changes in the plasma levels of C3bBbP at 6 hours. Interestingly, C3bBbP levels significantly decreased at 24 hours (p<0.05) (Table 2 and Figure 2).
Similarly, to the upstream component C3bBbP, the terminal complex (SC5b-9) baseline level was the highest in the STEMI-PCI group (median: 3.49 AU/ml) compared to SA- PCI (1.87 AU/ml, p=0.011) and CA (2.94 AU/ml, p=0.85) (Table 3).
SC5b-9 and C1rC1sC1-INH levels did not change significantly during the observation period. C1rC1sC1-INH levels were similar within the patient groups (Table 2).
Within the STEMI-PCI group significant correlation was found between baseline SC5b-9 level and post-procedural CK-MB and CRP levels (r=0.52 and r=0.47, p<0.05 respectively). Moreover SC5b-9 level at 6 hours correlated significantly with post-procedural troponin (r=0.58, p<0.05),
14
CK-MB (r=0.66, p<0.05), CK (r=0.43, p<0.05), GOT (r=0.66, p<0.05) and LDH (r=0.64, p<0.05) levels.
Analysis of complement activation according to coronary angiography results revealed no significant differences in the plasma levels of C1rC1sC1inh, C3bBbP, and SC5b-9 according to the applied approach (radialis vs. femoralis), predilatation, postdilatation or stent type (BMS vs. DES) (data not shown).
Figure 1. Changes in plasma C3bBbP levels in acute myocardial infarction and in stable coronary disease after coronary angiography/ or PCI.
* p<0.05, *** p<0.001, NS-non-significant
15
4.4. Serum and plasma levels of lectin pathway components in SAP patients with macroscopically healthy coronary arteries (NC)
The plasma level of TCC, the common end product of the complement activation pathways, was significantly higher in the NC group compared to CHD and to HC (5.45 AU/ml vs.
2.04 AU/ml, p=0.0001; 5.45 AU/ml vs. 1.3, p<0.0001). The serum levels of ficolin-2 were significantly lower in NC group compared to HC (3.6 µg/ml vs. 5.8 µg/ml, p=0.0053) and also lower compared to CHD group (3.6 µg/ml vs. 5.2µg/ml, p=
0.052). Similarly, the serum levels of ficolin-3 were significantly lower in NC group compared to HC (17.8 µg/ml vs. 24.1 µg/ml, p= 0.035) and to CHD (17.8 µg/ml vs. 26.8 µg/ml, p=0.0162), as well.
The ficolin-3/MASP-2 complex was significantly lower in NC group compared to HC (92.9 AU/ml vs. 144.9 AU/ml, p=0.0061). Interestingly, the ficolin-3/MASP-2 complex was also significantly lower in CHD group compared to HC (87.0 AU/ml vs. 144.9 AU/ml, p=0.0113).
The FCN3-TCC deposition was significantly lower in the CSX group compared to HC (67.8% vs. 143.3%, p=0.0081) and to CHD (67.8% vs. 159.7%, p= 0.0366), as well. There were no significant differences in serum MAP-1 levels, however, the
16
levels tended to be the lowest in the CSX group (CSX: 178.6 ng/ml, HC: 194.5 ng/ml, CHD: 212.4 ng/ml).
We found significant correlation between TCC and FCN3-TCC in the NC group (r=0.5067, p=0.032). Similarly, the ficolin-3/MASP-2 complex level and FCN3-TCC deposition correlated significantly (r=0.651, p=0.003).
5. CONCLUSIONS
5.1. Our data provide evidence for excessive activation of the complement system via classical pathway in patients with atherosclerotic coronary heart disease.
5.2. High C1rC1sC1-INH plasma levels - as an activation product of classical complement pathway - were characteristic for coronary atherosclerosis suggesting the role of C1rC1sC1- INH plasma levels as a useful biomarker. In the future, it might support risk stratification and diagnostic algorithm in the ischemic heart disease patient population.
5.3. Coronary angiography with or without PCI performed in patients with stable angina leads to early but reversible complement activation through the alternative pathway. We found significant correlation between postprocedural CK, creatinine applied contrast material volume (r=0.41, r=0.4, r=0.3, p<0.05 respectively) and C3bBbP at 6 hours. We assume that not the stent implantation, but rather catheter
17
manipulation and contrast material injection might initiate systemic complement activation. However, since the plasma level of the terminal complex (SC5b-9) did not rise significantly, we assume that the excessive activation of the alternative pathway does not necessarily lead to severe pathological consequences.
5.4. In acute STEMI patients the complement system is already activated and the primary PCI itself did not trigger the complement system as detected under elective conditions.
5.5. Elevated terminal complex SC5b-9 observed in acute STEMI patients at the baseline might represent a potential marker of myocardial damage. Furthermore, SC5b-9 at 6 hours after PCI correlated with all the cardiac enzymes (taken at 24 hours after the admission) confirming the presence of myocardial damage.
5.6. Significantly lower serum levels of lectin-pathway parameters, namely ficolin-2, ficolin-3, ficolin-3/MASP-2 complex and FCN3-TCC deposition was observed in NC patients compared to healthy control and patients with angiographically proven atherosclerotic coronary heart disease. Furthermore, we found significant correlations between TCC and FCN3-TCC deposition, ficolin-3/MASP-2 complex level and FCN3-TCC deposition. Taken together, low
18
levels of several lectin-pathway products might reflect upstream consumption and consequent, downstream terminal complement complex activation. Complement activation might contribute to the increased cardiovascular risk of NC patients (commonly known as Cardiac Syndrome X) by promoting endothelial and microvascular dysfunction.
6. BIBLIOGRAPHY OF THE CANDIDATES PUBLICATIONS
Publications related to Ph.D dissertation
Horváth Z, Csuka D, Vargova K, Leé S, Varga L, Garred P, Préda I, Zsámboki ET, Prohászka Z, Kiss RG. (2016) Association of low ficolin-lectin pathway parameters with Cardiac Syndrome X. Scand J Immunol, 84(3):174-81.
Horváth Z, Csuka D, Vargova K, Kovács A, Molnár A, Gulácsi-Bárdos P, Leé S, Varga L, Kiss RG, Préda I, Füst G.
(2013) Elevated C1rC1sC1inh levels independently predict atherosclerotic coronary heart disease. Mol Immunol, 54(1):8- 13.
19
Publications not related to Ph.D dissertation
Lee S, Hizoh I, Kovacs A, Horvath Z, Kiss N, Toth-Zsamboki E, Kiss RG. (2015) Predictors of high on-clopidogrel platelet reactivity in patients with acute coronary syndrome. Platelets, 27(2):159-167.
Leé S, Vargová K, Hizoh I, Horváth Z, Gulácsi-Bárdos P, Sztupinszki Z, Apró A, Kovács A, Préda I, Tóth-Zsámboki E, Kiss RG. (2014) High on clopidogrel treatment platelet reactivity is frequent in acute and rare in elective stenting and can be functionally overcome by switch of therapy. Thromb Res, 133(2):257-264.
Vargová K, Pállinger É, Horváth Zs, Kovács A, Leé S, Gulácsi-Bárdos P, Falus A, Kiss RG, Préda I. (2012) A mikrovezikulumok szerepe cardiovascularis kórképekben.
Orvosképzés, 2:55-60.
Kis E, Cseprekál O, Horváth Z, Katona G, Fekete BC, Hrapka E, Szabó A, Szabó AJ, Fekete A, Reusz GS. (2008) Pulse wave velocity in end-stage renal disease: influence of age and body dimensions. Pediatr Res, 63(1):95-8.