NOVEL THERAPEUTIC OPTIONS IN DIABETIC KIDNEY DISEASE
PhD Thesis
Dóra Bianka Balogh
Doctoral School of Clinical Medicine Semmelweis University
Supervisor: Andrea Fekete, MD, PhD
Official reviewers: Gábor Kökény, MD, PhD
Ágnes Haris, MD, PhD
Head of the Final Examination Committee: Miklós Kellermayer, MD, DSc
Members of the Final Examination Committee: Nóra Hosszúfalusi, MD, PhD Tibor Kovács, MD, PhD
Budapest 2020
1 TABLE OF CONTENTS
ABBREVIATIONS ... 4
1 INTRODUCTION ... 7
1.1 Diabetes mellitus ... 7
1.1.1 Prevalence ... 7
1.1.2 Classification ... 8
1.1.4 Complications... 10
1.2 Diabetic kidney disease... 11
1.2.1 Prevalence ... 11
1.2.2 Classification and diagnosis ... 11
1.2.3 Pathogenesis ... 13
1.2.3 Treatment of diabetic kidney disease ... 20
1.3 Role of the kidney in glucose metabolism ... 21
1.3.1 Renal glucose reabsorption is mediated by SGLT2 and SGLT1 ... 21
1.4 Novel antidiabetic drugs: SGLT2 inhibitors ... 24
1.4.1 Pleiotropic effects of SGLT2 inhibitors ... 26
1.4.2 SGLT2 inhibitors for the treatment of type 1 diabetes ... 27
2 OBJECTIVES ... 28
3 METHODS ... 29
3.1 Animals and experimental design ... 29
3.2 Measurement of arterial blood pressure ... 32
3.3 Metabolic and renal parameters ... 32
3.4 Cell cultures and experimental design ... 32
3.5 Conventional renal histology ... 34
3.6 Immunohistochemistry ... 35
2
3.7 Immunocytochemistry ... 35
3.8 Measurement of biomarkers of ECM formation and degradation ... 36
3.9 Quantitative RT-PCR ... 36
3.10 Western blot ... 38
3.11 Statistical analysis ... 40
4 RESULTS ... 41
4.1 Effect of RAASi on metabolic parameters and renal function ... 41
4.1.1 MAP remained unaltered in control, diabetic and RAASi-treated groups ... 41
4.1.2 RAASi are not affect metabolic parameters ... 42
4.1.3 RAASi and renal function ... 43
4.1.4 Tubulointerstitial fibrosis and RAASi... 44
4.2 DAPA prevents metabolic decline in diabetic rats ... 45
4.3 Diabetes-induced SGLT2 and GLUT2 increment are mitigated by DAPA ... 46
4.4 DAPA slows the loss of renal function ... 46
4.4.1 Renal retention parameters are improved by DAPA ... 46
4.4.2 DAPA minimizes the early and sensitive biomarkers of tubular damage ... 47
4.4.3 DAPA ameliorates mesangial matrix expansion in the diabetic kidney ... 49
4.5 Renal fibrogenesis is alleviated by DAPA ... 50
4.5.1 Novel urinary fibrosis markers were diminished by DAPA ... 50
4.5.2 DAPA mitigates profibrotic growth factor levels ... 51
4.5.3 Myofibroblast activation and tubulointerstitial fibrosis was decreased by DAPA ... 52
4.5.4 Correlation between tubulointerstitial fibrosis and urinary markers of ECM remodeling ... 53
4.5.5 DAPA prevents renal collagen accumulation ... 54
4.5.6 Diabetes-induced fibronectin accumulation is ameliorated by DAPA ... 55
3
4.6 Hyperglycemia-induced O-GlcNAcylation is prevented by DAPA in HK-2 cells
... 56
4.7 High glucose-induced profibrotic growth factor increment is diminished by DAPA in proximal tubular cells ... 58
4.8 DAPA moderates tubular response to hypoxia ... 59
4.8.1 Hypoxia-induced HIF-1α elevation is suspended by DAPA ... 59
4.8.1 Downstream elements of HIF pathway are moderated by DAPA ... 61
4.8.2 DAPA alters profibrotic growth factor expression in response to hypoxia ... 61
5 DISCUSSION ... 63
6 CONCLUSIONS ... 72
7 SUMMARY ... 73
8 ÖSSZEFOGLALÁS ... 74
9 REFERENCES ... 75
10 BIBLIOGRAPHY OF THE CANDIDATE’S PUBLICATIONS ... 94
11 ACKNOWLEDGEMENTS ... 96
12 FIGURES AND TABLES ... 97
4 ABBREVIATIONS
ACE angiotensin-converting enzyme
ACR albumin-to-creatinine ratio
ADA American Diabetes Association
Ang I angiotensin I
Ang II angiotensin II
ARB angiotensin receptor 1 blocker
α-SMA alpha-smooth muscle actin
BSA bovine serum albumin
CANVAS Canagliflozin Cardiovascular Assessment Study
CKD chronic kidney disease
CREDENCE Canagliflozin and Renal Events in Diabetes with Established Nephropathy Clinical Evaluation
CTGF connective tissue growth factor
CVD cardiovascular disease
DAPA dapagliflozin
DAPA-CKD A Study to Evaluate the Effect of Dapagliflozin on Renal Outcomes and Cardiovascular Mortality in Patients with Chronic Kidney Disease
DECLARE-TIMI 58 Dapagliflozin Effect on Cardiovascular Events- Thrombolysis in Myocardial Infarction 58
DEPICT Dapagliflozin Evaluation in Patients with Inadequately Controlled Type 1 Diabetes
DKA diabetic ketoacidosis
DKD diabetic kidney disease
ECM extracellular matrix
EMPA-REG OUTCOME Empagliflozin Cardiovascular Outcome Event Trial in Type 2 Diabetes Mellitus Patients-Removal of Excess Glucose
ELISA enzyme-linked immunosorbent assay
EPO erythropoietin
5
GDM gestational diabetes mellitus
GFAT1 glutamine-fructose‑6‑phosphate amidotransferase 1
GFR glomerular filtration rate
HbA1c glycated hemoglobin
HBP hexosamine biosynthetic pathway
HIF-1α hypoxia-inducible factor 1-alpha
HRP horseradish peroxidase
IFG impaired fasting glucose
IGT impaired glucose tolerance
KIM-1 kidney injury molecule-1
LOS losartan
MAP mean arterial pressure
MMP matrix metalloproteinase
MODY maturity-onset diabetes of the young
MTT methyl-thiazoletetrazolium
ncOGT nucleocytoplasmic O-GlcNAc transferase
NGAL neutrophil gelatinase-associated lipocalin
OGA O-GlcNAcase
O-GlcNAc O-linked N-acetylglucosamine
OGTT oral glucose tolerance test
PBS phosphate buffered saline
PDGF platelet-derived growth factor
SD standard deviation
SGLT2 sodium-glucose cotransporter 2
sOGT small O-GlcNAc transferase
STZ streptozotocin
TGF tubuloglomerular feedback
TGFβ transforming growth factor beta
TUM type IV collagen
T1DM type 1 diabetes
T2DM type 2 diabetes
RAAS renin-angiotensin-aldosterone system
6
rPRO-C3 collagen III formation
UAE urinary albumin excretion
uC3M MMP-9-mediated degradation of type III VEGF-A vascular endothelial growth factor A
WHO World Health Organization
7 1 INTRODUCTION
1.1 Diabetes mellitus
1.1.1 Prevalence
Over the past few decades, diabetes mellitus has become one of the largest epidemics the world has faced, making it an enormous challenge for modern healthcare systems.
Between 2000 and 2020, overall prevalence of diabetes in adults snowballed from 151 million to 463 million (Fig. 1). Today, this represents 9.3% of the world’s adult population aged 20-79 years. Without urgent multi-sectoral strategies and actions, 578 million (10.2%) people are predicted to live with diabetes by 2030 and this number will rise to 700 million (10.9%) by 2045 (1).
Figure 1 Estimated total number of diabetic adults (20-79 years) in 2019. (IDF DIABETES ATLAS Ninth edition, 2019)
8
Similarly to global trends the prevalence of diabetes has been increasing in Hungary (ca.
7-9%) as well. According to the database analysis of the National Health Insurance Fund 727 000 people are living with diabetes in Hungary (2). Diabetic patients have an increased risk of developing life-threatening health complications resulting in reduced quality of life, increased mortality and higher medical care costs. The global health expenditure on diabetes is estimated to be USD 760.3 billion per year (3).
1.1.2 Classification
Diabetes has a long history reaching back to antiquity. The term “diabetes” (Greek for
“passing through” meaning “a large discharge of urine”) was first used in the 2nd century, while in the 17th century the term “mellitus” (Latin for “honey”) was added describing the extremely sweet taste of urine (4). Diabetes mellitus is a group of metabolic disorders associated with dysregulation of carbohydrate, lipid and protein metabolism. It is characterized by constant hyperglycemia resulting from a relative or absolute deficiency of insulin secretion or peripheral insulin resistance or both. Persistent hyperglycemia causes generalized vascular damage leading to several complications including cardiovascular diseases, neuropathy, retinopathy or kidney disease.
Diabetes can be classified into various groups among which the following categories are the most frequent:
1. Type 1 diabetes (T1DM; caused by autoimmune β-cell destruction, usually leading to absolute insulin deficiency).
2. Type 2 diabetes (T2DM; caused by a progressive loss of β-cell insulin secretion frequently on the background of insulin resistance).
3. Gestational diabetes mellitus (GDM) (diabetes diagnosed in the second or third trimester of pregnancy).
4. Specific types of diabetes due to other causes e.g. monogenic diabetes syndromes (neonatal diabetes, maturity-onset diabetes of the young), diseases of the exocrine pancreas (cystic fibrosis, pancreatitis), drug- or chemical-induced diabetes and infection-related diabetes (5).
9
T1DM accounts for around 5-10% of diabetes in adults. It is characterized by autoimmune destruction of pancreatic β-cells leading to absolute insulin deficiency. The process is not fully understood, however many mechanisms can lead to the decline in β-cell function (e.g. genetic predisposition and abnormalities, epigenetic processes, auto-immunity, concurrent illnesses, inflammation and environmental factors) (6). The traditional paradigm saying that T1DM occurs only in children or adolescents has been disproven.
Despite T1DM developing frequently in childhood, it can be manifested in adults as well (7).
T2DM is the most common type of diabetes, accounting for more than 90% of all cases worldwide. T2DM is a complex chronic disorder primarily associated with insulin resistance in skeletal muscle, liver and adipose tissue and impaired insulin secretion.
Environmental (e.g. obesity, unhealthy diet, physical inactivity) and genetic factors (T2DM clusters in families and is heritable) are important determinants of insulin resistance and β-cell dysfunction (8). T2DM mostly occurs in adults, however it has also become a concern in children and adolescents as a result of the increasing prevalence of obesity and metabolic syndrome in this population (9).
GDM develops during pregnancy (generally detected in the second or third trimester) and resolves following delivery. GDM is currently the most common medical complication of pregnancy and its prevalence is increasing (10). In addition, the risk of developing T2DM in later life is substantially higher in women with GDM (11). Intrauterine exposure to diabetes is associated with increased lifetime risk of obesity and T2DM in the offspring as well (12). Detailed discussion of other specific types of diabetes (e.g. monogenic diabetes syndromes, diseases of the exocrine pancreas, endocrine disorders, drug- or chemical-induced diabetes, infections, etc.) exceeds the limits of this thesis.
1.1.3 Diagnosis
The classic symptoms of hyperglycemia are polyuria, polydipsia, blurred vision, hyperphagia and weight loss. Children with T1DM typically present with the hallmark symptoms of polyuria, polydipsia, weight loss and approximately one-third present with
10
diabetic ketoacidosis (DKA) (13). The majority of patients with T2DM often remain undiagnosed for years, since hyperglycemia develops gradually and is not severe enough at earlier stages to notice the classic symptoms. Increased serum glucose levels are usually noticed during routine laboratory evaluation suggesting the onset of T2DM.
Beside the classic symptoms of hyperglycemia, further blood glucose tests are needed for the diagnosis of diabetes. Fasting plasma glucose, two-hour plasma glucose during a 75 g oral glucose tolerance test (OGTT), glycated hemoglobin (HbA1C) or random plasma glucose test in patients with classic symptoms of hyperglycemia or hyperglycemic crisis can be used for diagnostic testing. According to the current guidelines of the American Diabetes Association (ADA) and World Health Organization (WHO) diagnosis can be established if any of the following criteria is met:
Fasting plasma glucose ≥ 7.0 mmol/L
Two-hour plasma glucose ≥ 11.1 mmol/L during a 75 g OGTT
HbA1C ≥ 6.5%
Random plasma glucose ≥ 11.1 mmol/L
“Prediabetes” is the term used for individuals whose serum glucose levels do not fulfil the criteria, but are higher than normal. Patients with increased fasting glucose (IFG; 6.1- 6.9 mmol/L) and/or impaired glucose tolerance (IGT; fasting plasma glucose < 7.0 mmol/L and two-hour plasma glucose 7.8-11.1 mmol/L) and/or HbA1C 5.7-6.4% have prediabetes indicating a higher risk for the future development of diabetes and cardiovascular disease (CVD) (5, 14).
1.1.4 Complications
Patients with all forms of diabetes are at increased risk of developing serious acute and chronic complications. DKA and severe hypoglycemia are the major life-threatening acute complications of diabetic patients. Poor glycemic control, misdiagnosis, lack of access to insulin or low socioeconomic status result in acute complications leading to permanent neurological consequences or death (6).
11
In general, the harmful effects of consistent hyperglycemia can be classified as chronic macrovascular complications (coronary artery disease, peripheral arterial disease) and microvascular complications (retinopathy, kidney disease, and neuropathy).
Hyperglycemia exacerbates the development of atherosclerosis and heart failure, therefore CVD is the principal cause of death among diabetic patients (15). Diabetic retinopathy may be the most common microvascular complication of diabetes and is the leading cause of blindness in adults. Diabetic kidney disease (DKD) is the main topic of this thesis and will be discussed in detail in the next chapter.
1.2 Diabetic kidney disease
1.2.1 Prevalence
DKD is a major cause of chronic kidney disease (CKD) and end-stage renal disease (ESRD), accounting for approximately 50% of cases in the United States (16) and 30- 40% of cases in Hungary (17). It typically develops after 10 years of diabetes in the case of T1DM (ca. 30%), but may already be present at diagnosis of T2DM (ca. 40%) (18, 19). The incidence of DKD has been increasing progressively parallels the dramatic worldwide rise of diabetes in the past decades. The annual healthcare cost of patients with DKD are 49% higher than diabetic patients with no kidney damage (20).
1.2.2 Classification and diagnosis
The clinical diagnosis of DKD is based on the presence of albuminuria and/or reduced estimated glomerular filtration rate GFR (eGFR) in the absence of signs or symptoms of other primary causes of kidney damage (e.g. rapidly decreasing eGFR, abrupt increase in albuminuria, nephrotic syndrome, refractory hypertension or eGFR decline within 2-3 months of initiation of renin-angiotensin system inhibition). However, this paradigm may have changed over the last two decades. In particular, GFR loss has been observed prior to the development of albuminuria (21-23), reduced GFR without albuminuria has been frequently described (24, 25) and albuminuria has been noted to be transient or reversible (26, 27).
12
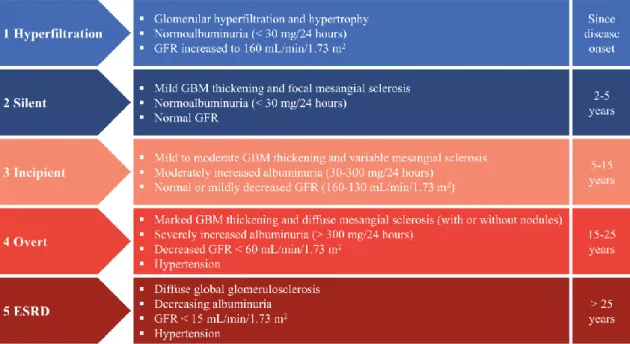
Stage 1 known as glomerular hyperfiltration is characterized by kidney hypertrophy and normal albumin excretion. An absolute, supraphysiologic elevation in GFR is observed in this early clinical entity (28).
Stage 2 develops silently over many years. Glomerular basement membrane (GBM) thickening without signs of clinical disease is a characteristic early change in diabetes.
GBM thickening is a consequence of extracellular matrix (ECM) accumulation, with increased deposition of collagen types IV and VI, laminin and fibronectin (29, 30). A number of patients remain in stage 2 throughout their lives.
Stage 3 is the forerunner of overt DKD. Diagnosis is supported by moderately increased urinary albumin excretion (UAE; 30-300 mg/24 hours) or albumin-to-creatinine ratio (ACR; 30-300 mg/g) confirmed by two independent measurements at least three months apart. A slow, gradual increase of albuminuria is a prominent feature of this very decisive phase of DKD when blood pressure is rising. Increased rate of UAE is higher in patients with elevated blood pressure. Expansion of cellular and matrix components in the
Figure 2 Stages of diabetic kidney disease. The figure illustrates the 5 stages of diabetic kidney disease and the likely renal pathologic and functional alterations in each stage. Based on Mogensen et al., Diabetes. 1983;32 Suppl 2:64-78 and Said and Nasr, Kidney International. 2016;90 1:24-26.
ESRD: end-stage renal disease; GBM: glomerular basement membrane; GFR: glomerular filtration rate.
13
mesangium and mild to moderate GBM thickening can be detected in stage 3 (31). GFR is normal or mildly decreased.
Stage 4 is overt DKD. It is characterized by persistent, severe albuminuria (> 300 mg/24 hours or ACR > 300 mg/g). Renal function declines (GFR < 60 mL/min/1.73 m2) when associated high blood pressure is left untreated. Segmental mesangiolysis can be observed with progression of diabetes and is associated with development of Kimmelstiel-Wilson nodules (32). These lesions consist of mesangial matrix accumulation with collagen fibrils, small lipid particles and cellular debris.
Stage 5 is ESRD with uremia. It is characterized by decreased UAE due to glomerular loss and < 15 mL/min/1.73 m2 GFR. Dramatically reduced renal function leads to fluid retention, hypertension, anemia, disturbances of bone and mineral metabolism, dyslipidemia and protein energy malnutrition. Excessive accumulation of ECM proteins in the mesangial space and Kimmelstiel-Wilson lesions finally result in advanced glomerulosclerosis. Interstitial fibrosis and tubular atrophy follow glomerular changes ultimately leading to ESRD requiring dialysis or kidney transplantation (Fig. 2) (33).
1.2.3 Pathogenesis
DKD is a complex and heterogeneous disease with numerous overlapping metabolic and hemodynamic pathways. Hyperglycemia affects most renal cell types; however, some cells are more vulnerable to high glucose concentrations than others. Cells that are unable to regulate glucose uptake are the most sensitive to changes in the diabetic milieu (34).
Glucose entry into proximal tubular cells is insulin independent; therefore, these cells are not capable of decreasing glucose transport adequately making them particularly susceptible to high glucose concentrations (35). Hyperglycemia not only affects tubular structures, but also enhances tubular glucose load, exposure and reabsorption. As the tubule grows the amount of reabsorbed glomerular filtrate increases, thus less reaches the macula densa causing GFR increment through the normal physiologic action of the tubuloglomerular feedback (TGF) system (36). Therefore, the proximal tubule may play a role as an initiator and contributor in the early pathogenesis of DKD.
14
Prolonged hyperglycemia results in production of advanced glycation end products (AGE), activation of the hexosamine and polyol pathway, increased vasoactive renin- angiotensin-aldosterone system (RAAS) activity and hypoxia. All these glucose-induced general mechanisms change renal hemodynamics and promote renal inflammation and fibrosis (37).
1.2.3.1 Renin-angiotensin-aldosterone system
Systemic, circulating RAAS is involved in numerous physiological functions that regulate vasoconstriction, fluid volume regulation, cardiac output and vascular wall integrity. RAAS is a coordinated hormonal cascade that is initiated through renin synthesis in juxtaglomerular cells. Renin enzymatically cleaves liver-derived angiotensinogen into angiotensin I (Ang I). Ang I is further converted to the biologically active peptide angiotensin II (Ang II), a potent vasoconstrictor by pulmonary angiotensin- converting enzyme (ACE). Further investigations proposed that other peptidases (e.g.
chymase, cathepsins) could regulate Ang II production as well (38). ACE not only generates Ang II but also degrades the vasodilator bradykinin, thus its activity serves to increase systemic vascular tone (39). ACE2, an enzyme homologue of ACE was identified in the kidney and heart. Their substrate specificities differ; ACE2 hydrolyzes Ang II to form Ang 1-7 400-fold more efficiently than Ang I which generates Ang 1-9 (40-42). These peptides have several opposing actions. Ang II mediates effects via complex intracellular signaling pathways binding to Ang II type 1 receptor (AT1R) and Ang II type 2 receptor (AT2R). Circulating Ang II regulates blood pressure and electrolyte balance via its actions on vascular tone, aldosterone secretion, renal sodium handling, water intake, sympathetic activity and vasopressin release using the AT1R. Ang II stimulation of the AT2R promots vasodilation and growth inhibition, which generally opposes Ang II actions mediated via the AT1R (43).
Data suggest that regulation of renal RAAS is partly independent of systemic circulation.
Kidneys express all of the RAAS components necessary for Ang II generation. Renal angiotensinogen is localized in the proximal tubule, where it can interact with renin.
Consequently, Ang I is formed and is converted to Ang II in the brush border of proximal
15
tubular cells (44). In diabetes, high glucose concentration stimulates both angiotensinogen and renin synthesis resulting in Ang II increment (45, 46). Notably, Ang II increases angiotensinogen mRNA expression and this feedback loop establishes a vicious cycle in the kidney. The high Ang II levels and overactivated RAAS lead to elevated blood pressure, mesangial cell contraction with decreased surface area for filtration, renal cell proliferation and hypertrophy, increased production of ECM, induction of growth factors and reactive oxygen species (47, 48). Further, Ang II is a major regulator of Ang II-dependent aldosterone release leading to renal fibrosis (49).
Transforming growth factor-β (TGF-β) plays a crucial role in Ang II-dependent renal pathology contributing to epithelial-mesenchymal transition (EMT) (50). Along with TGF-β signaling, Ang II-induced fibrogenesis is also mediated through connective tissue growth factor (CTGF), plasminogen activator inhibitor-1 (PAI-1) and various inflammatory effectors leading to ECM production and renal fibrosis.
1.2.3.2 Protein O-GlcNAcylation
Protein O-GlcNAcylation is one of the most common post-translational modifications which was discovered in the early 1980’s (51). So far, more than four thousand proteins within the nucleus and cytoplasm have been shown to be modified by O-linked N- acetylglucosamine (O‑GlcNAc) moiety. Unlike other glycosylation forms that consist of sequential chain elongation and complex branching, O-GlcNAcylation results in the addition of a single O-GlcNAc moiety (52). O‑GlcNAcylation is the product of nutrient flux through the hexosamine biosynthetic pathway (HBP) to generate uridine diphosphate GlcNAc (UDP-GlcNAc) substrate for O‑GlcNAcylation. Concentration of UDP-GlcNAc is directly influenced by glucose, amino acids, fatty acids and nucleotides, thus O- GlcNAc serves as a nutrient sensor to modulate cellular processes (e.g. signaling, transcription, cytoskeletal functions) in response to nutrient status (53). Under normal physiological conditions, the HBP accounts for 2-5% of glucose utilization. In diabetes, an undesirable effect of hyperglycemia is increased metabolic flux through the HBP leading to several diabetic complications (54). Higher flux via the HBP results in increased UDP-GlcNAc levels causing enhanced O-GlcNAcylation, which contributes to
16
dysregulation of signaling cascades and transcription in cells and tissues of diabetic subjects (55-58).
O‑GlcNAcylation is controlled by a pair of intracellular enzymes. O‑GlcNAc transferase (OGT) catalyses the addition of a GlcNAc moiety from the donor substrate UDP-GlcNAc to the hydroxyl groups of target proteins at serine and/or threonine residues, while O‑GlcNAcase (OGA) is responsible for removing β-D-N-acetylglucosamine residues from previously modified proteins. OGT is highly conserved but has three known splice
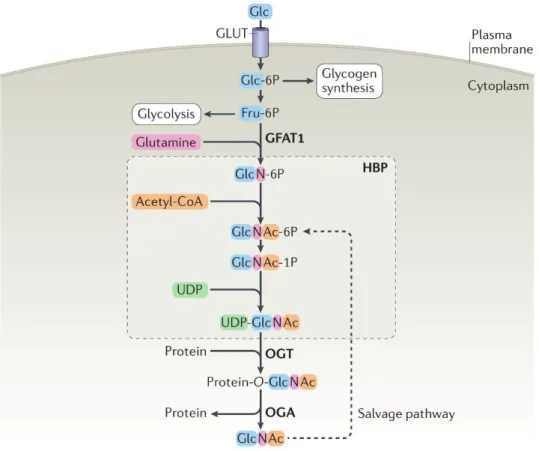
Figure 3 Protein O‑GlcNAcylation is regulated by nutrient flux via the hexosamine biosynthetic pathway. The majority of glucose is used for glycolysis and glycogen synthesis, while the hexosamine biosynthetic pathway (HBP) accounts for 2-5% of glucose utilization. Glutamine-fructose‑6‑phosphate amidotransferase 1 (GFAT1) is the rate- limiting enzyme of the HBP, which converts fructose‑6‑phosphate (Fru‑6P) into glucosamine‑6‑phosphate (GlcN‑6P).
Subsequent acetylation of GlcN‑6P and uridylation of GlcN‑1P yields the donor substrate for protein O‑GlcNAcylation, uridine diphosphate GlcNAc (UDP-GlcNAc). O‑GlcNAc transferase (OGT) and O‑GlcNAcase (OGA) catalyse the addition and removal of O‑GlcNAc, respectively. Free GlcNAc can be recycled via the GlcNAc salvage pathway converting GlcNAc into GlcNAc‑6P that can be utilized by the HBP. Modified image of Yang X, Qian K; Nat Rev Mol Cell Biol. 2017;18(7):452-465.
17
variants defined as nucleocytoplasmic (ncOGT; 110 kDa), mitochondrial (mOGT; 103 kDa), and short OGT (sOGT; 78 kDa), all of which vary in abundance between tissues.
The three isoforms differ only in the number of N-terminal tetratricopeptide repeat (TPR) motifs which affects their substrate recognition (59). Evolutionarily conserved OGA has two major splice variants: the long (OGA-L; 130 kDa) and short (OGA-S; 75 kDa) isoforms. OGA-L is localized in the cytosol and nucleus, whereas OGA-S resides primarily in lipid droplets (Fig. 3) (60).
A growing body of evidence demonstrates the importance of O-GlcNAcylation in insulin resistance and glucose toxicity, which are the fundamental pathological processes of diabetes. Literary data indicate that glutamine-fructose‑6‑phosphate amidotransferase 1 (GFAT1), the rate-limiting enzyme of the HBP is expressed in most tissues involved in the development of diabetic complications (61). Increased GFAT activity appears to be associated with insulin resistance, postprandial hyperglycemia and oxidative stress in T2DM (62). In diabetes, enhanced O-GlcNAcylation contributes to the development of complications in several ways. Insulin-responsive glucose uptake is affected by O- GlcNAcylation in skeletal muscle and adipose tissue (63). Furthermore, O- GlcNAcylation contributes to insulin resistance in adipocytes (64). In addition, deterioration of insulin secretion and pancreatic β-cell death is in part a consequence of diabetes-related increased protein O-GlcNAcylation (65, 66).
O-GlcNAcylation has a major role in the regulation of renal fibrosis. O-GlcNAcylation plays an essential role in high glucose-induced upregulation of PAI-1 and TGF-β expression contributing to the development of renal fibrosis (67-69). Further, hyperglycemia-induced O‑GlcNAcylation mediates fibrosis in mesangial cells (70). A study suggests that increased O-GlcNAcylation contributing to the development of renal injury and inflammation (71). All these data clearly support that disruption of O‑GlcNAc homeostasis in diabetes, which has been implicated in the pathogenesis of diabetes and subsequent DKD.
18 1.2.3.3 Hypoxia
Renal oxygenation is based on a balance between O2 supply and consumption. A complex interplay between renal blood flow, GFR, O2 consumption and arteriovenous O2 shunting maintain renal O2 tension at constant levels (72). The kidneys are less than 1% of total body weight but use 10% of total O2 consumption. O2 is mostly utilized to fuel Na⁺/K⁺- ATPase in proximal tubular cells, which regulates sodium reabsorption and other transport processes (e.g. solutes, glucose, amino acids). The kidney carries out its complex transport functions in a relatively narrow range of O2 tension; therefore, it is highly vulnerable to hypoxic injury (73).
Numerous studies have highlighted the pivotal contribution of hypoxia to DKD (74). As early as 1994, Körner et al. reported that O2 consumption ofproximal tubules isolated from STZ-diabetic rats is greater than that of control animals (75). These findings have been confirmed by various models and methods throughout the years. Palm et al. used Clark-type microelectrodes to show that renal tissue O2 tension is decreased in diabetic rats (76). Blood oxygenation level-dependent (BOLD) MRI demonstrated that hypoxia is present in the outer medulla as well (77). Renal hypoxia is a consequence of increased blood flow resulting in elevated GFR. In turn, this increases sodium and glucose reabsorption via sodium-glucose cotransporters (SGLT), which leads to enhanced Na+/K+-ATPase activity resulting in elevated O2 consumption. Further, a diabetes-related rapid decline in peritubular capillary density causes inadequate oxygen delivery to tubular cells making them susceptible to hypoxic injury. Collectively, all these processes lead to decreased tissue O2 tension.
Cells harbor many mechanisms with which they withstand hypoxic challenges; low O2
tension leads to activation of various genes facilitating adaptation (e.g. erythropoiesis, angiogenesis, iron and glucose metabolism) and survival. Although several transcription factors are participated in the control of hypoxia, hypoxia-inducible factor (HIF) system is the master regulator of this cellular response (78). HIF is a heterodimeric basic helix- loop-helix complex consisting of an α-subunit (HIF-1α, HIF-2α, HIF-3α) and a β-subunit (HIF-1β). In normoxic conditions, HIF-1α is hydroxylated by prolyl 4-hydroxylases
19
(PHD) and targeted for proteosomal degradation by the von Hippel-Lindau-E3 ubiquitin ligase complex. On the other hand, PHD is inactive and HIF-α degradation is inhibited during hypoxia, thus HIF signaling is activated. HIF-α translocates from the cytoplasm to the nucleus, where it dimerizes with HIF-1β. The HIF complex then binds to hypoxia responsive elements in the promoter sequences of numerous genes involved in maintaining cellular and tissue O2 homeostasis e.g. erythropoietin (EPO), vascular endothelial growth factor (VEGF) and glucose transporter-1 (GLUT1) (Fig. 4).
Figure 4 Oxygen regulates HIF-α protein expression. HIF is a heterodimeric transcription factor complex that is composed of an oxygen regulated HIF-1α subunit and a constitutively expressed HIF-1β subunit. HIF-1 activity depends on the degradation of HIF-1α subunit. HIF: hypoxia-inducible factor, FIH: Factor-inhibiting hypoxia-inducible factor, HRE: hypoxia responsive elements, PHD: prolyl 4-hydroxylases, VHL: von Hippel-Lindau-E3
20
Several studies support the tubular ‘chronic hypoxia hypothesis’ as a dominant pathogenic pathway in DKD, which not only promotes its progression but also initiates (79-81). Hypoxia triggers fibrotic response in tubulointerstitial cells and enhances myofibroblast differentiation. In response to low O2 tension collagen I production is increased, while matrix-metallopeptidase (MMP) 2 is decreased leading to ECM accumulation (82). Hypoxia also induces TGF-β expression, moreover they can act synergistically in the regulation of VEGF and EPO (83, 84). Activation of HIF plays an important role in tubulointerstitial fibrosis via direct transcriptional regulation of PAI-1, TGF-β and CTGF (85). Tubular hypoxia contributes to the development of tubular atrophy and interstitial fibrosis in a vicious circle promoting DKD progression. Targeting these processes can offer novel opportunities for therapeutic intervention.
1.2.3 Treatment of diabetic kidney disease
Optimization of glucose and blood pressure control to reduce the risk or to slow the progression of DKD are the primary standards of medical care. ADA recommends that targets for glycemic control should be considered with respect to age, comorbidities and life expectancy of patients. According to ADA and Kidney Disease Improving Global Outcomes (KDIGO) guidelines the target HbA1C is about 7.0%. For hypertension management, blood pressure levels of 140/90 mmHg are generally recommended, however, blood pressure targets at 130/80 mmHg may be considered for patients based on anticipated individual benefits and risks. For DKD patients, dietary protein intake should be approximately 0.8 g/bwkg/day and restriction of dietary sodium intake may be useful as well. Avoiding alcohol and tobacco is highly recommended since smoking has already been identified as an independent risk factor of DKD.
ACE inhibitors or ARBs are the preferred first-line medication regimen for blood pressure treatment in diabetic patients with hypertension and moderately increased UAE (86-88).
If UAE is moderately increased ACE inhibitor or ARB therapy has been demonstrated to reduce cardiovascular events (89). However, combination of ACE inhibitors and ARBs increase the risk of adverse events (hyperkalemia and/or acute kidney injury) and offers no benefits on DKD. Therefore, the combination should be avoided (90, 91). Aldosterone
21
antagonists (also known as mineralocorticoid receptor antagonists) combined with ACE inhibitors or ARBs are an area of great interest. Aldosterone antagonists are effective for treatment of resistant hypertension, have been shown to reduce albuminuria in short-term studies of DKD and may have additional cardiovascular benefits. Contrarily, dual therapy may results in increased hyperkalemic episodes (92, 93).
1.3 Role of the kidney in glucose metabolism
Renal involvement in glucose metabolism was first described in the 1930s. The kidney bears a crucial role in the regulation of glucose homeostasis in three different ways: (I) glucose utilization for its energy needs; (II) glucose release through gluconeogenesis; (III) tubular glucose reabsorption from glomerular filtrate. Although each of these can be altered in diabetes, the focus of this thesis is summarizing the mechanism of glucose reabsorption targeted in the management of diabetes.
1.3.1 Renal glucose reabsorption is mediated by SGLT2 and SGLT1
The kidney of a normoglycemic person filters ~180 g glucose per day. Almost all filtered glucose (ca. 99%) is reabsorbed and urine is essentially glucose free. Experiments on isolated rabbit proximal convoluted tubules in the early 1980s proved the presence of two different glucose transporters along the apical surface (94). Wright et al. demonstrated the existence of two proximal tubular Na+/glucose cotransporters by molecular cloning:
SGLT2 and SGLT1 as the primary mechanisms of glucose reabsorption in the kidney (95). Later, it was confirmed that low-affinity high-capacity SGLT2 protein is localized in the early proximal tubule (S1 and S2 segments), while high-affinity low-capacity SGLT1 is expressed in the late proximal tubule (S3 segment) in rodents using validated antibodies and knockout mice (96, 97). Recent studies showed the same expression pattern in the human kidney (98).
22
Tubular glucose reabsorption requires a driving force through the apical to the basolateral membrane. Na+ and glucose are co-transported from the tubular lumen to the intracellular space through SGLTs by a Na+ dependent electrochemical gradient. Intracellular glucose is reabsorbed via GLUT1 or GLUT2, while sodium is reclaimed by Na+/K+-ATPase on the basolateral membrane, thus releasing them into the bloodstream. The majority of luminal glucose (ca. 97%) is reabsorbed in the early proximal tubule through SGLT2.
The transport of Na+ and glucose occurs in a 1:1 ratio. SGLT1 reclaims the remaining 3%
luminal glucose in the late proximal tubule with a Na+:glucose coupling ratio of 2:1 (Fig.
5). All of the above was demonstrated by renal clearance and micropuncture studies in euglycemic Sglt1-/- and Sglt1/Sglt2 double knockout mice (99).
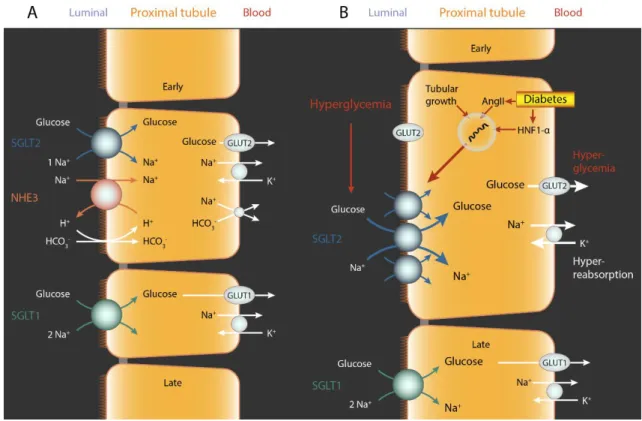
Figure 5 Renal glucose reabsorption is mediated by SGLT2 and SGLT1. (A) SGLT2 reabsorbs ∼97% and SGLT1 reabsorbs ∼3% of filtered glucose in the proximal tubules. (B) Diabetes increases the expression of SGLT2. This may be due to increased angiotensin II (Ang II) levels, hepatocyte nuclear factor HNF-1α and/or tubular growth.
Hyperglycemia and increased SGLT2 expression enhance glucose and Na+ reabsorption in the proximal tubule. Glucose exits via basolateral GLUT2 to the blood stream. The relevance of luminal translocation of GLUT2 in diabetes remains to be determined. The elevation in filtered glucose and SGLT2 expression enhance the glucosuric effect of SGLT2 inhibitors in diabetes. Based on Vallon V.; Annu. Rev. Med. 2015;66:255-70.
23
Renal glucose filtration and the tubular glucose reabsorption are enhanced to around 600 g per day in T1DM and T2DM. If GFR is normal, the renal transport maximum of glucose is reached when blood glucose levels exceed 11.1 mmol/L leading to a linear increase in glucosuria (100, 101). This process acts as a renal safety valve preventing extreme hyperglycemia. The elevated renal transport capacity of glucose is a consequence of tubular growth (102) or primary upregulation of SGLT2 or SGLT1 in diabetes (103, 104).
Diabetes-induced enhanced glucose reabsorption contributes to prolonged hyperglycemia, therefore it can be thought to be maladaptive. The tubular reabsorption capacity of glucose is reducing to the residual capacity of SGLT1 (~80 g/day) in response to SGLT2 inhibition. That is to say, SGLT2 inhibition causes the renal safety valve to open at a lower threshold resulting in normoglycemic and moderately hyperglycemic range of glucose homeostasis (Fig. 6).
Figure 6 Glucose reabsorption in the kidneys. The kidney of a normoglycemic person filters ~180 g glucose per day.
Almost all filtered glucose (ca. 99%) is reabsorbed and urine is essentially glucose free. The majority of luminal glucose (ca. 97%) is reabsorbed in the early proximal tubule through Na+/glucose cotransporter 2 (SGLT2). Renal glucose filtration and the tubular glucose reabsorption are enhanced in diabetes. SGLT2i induce sustained glucosuria associated with good blood glucose lowering effect in type 2 diabetes.
24
SGLTs belong to the SLC5 gene family including six isoforms of the SGLT gene. SGLT1 and SGLT2 are the best characterized cotransporters. SGLT1 is expressed mainly in the brush border membrane of the intestines and the kidney mediating glucose and/or galactose absorption. SGLT2 is localized in the proximal tubules and facilitates glucose reabsorption from the glomerular filtrate. SGLT3 as a renal glucose sensor and/or transporter has only recently been discovered. SGLT4-6 have also been identified but their function and structure is unknown yet (105).
Glucose-galactose malabsorption is an autosomal recessive disorder and is a consequence of a genetic mutation in SGLT1 leading to severe diarrhea (106). Individuals with mutations in SGLT2 gene are diagnosed as having familiar renal glucosuria. Patients with familiar renal glucosuria have reduced tubular glucose reabsorption resulting in persistent glucose excretion of 60-150 g/1.73 m2 per day without hyperglycemia. Most patients do not develop significant clinical complications over time, however the disorder can be associated with polyuria, polydipsia, polyphagia and recurrent urinary tract infections (107). These observations supported the potential role of SGLT2 inhibitors (SGLT2i) as safe glucose lowering drugs. SGLT2i act by inhibiting glucose reabsorption in renal proximal tubules, thereby lowering plasma glucose levels in an insulin-independent manner.
1.4 Novel antidiabetic drugs: SGLT2 inhibitors
The history of SGLT inhibitor development began with phlorizin, a natural flavonoid and dietary constituent contained in various fruit trees. It was first isolated from the bark of an apple tree in 1835 by French chemists (108). Phlorizin is a potent glucosuric agent and played a key role in uncovering the function of renal glucose reabsorption and the discovery of SGLTs. Phlorizin turned out to be a non-selective inhibitor of both SGLT2 and SGLT1. Since blocking SGLT1 leads to glucose-galactose malabsorption associated with diarrhea, phlorizin was not considered a suitable drug candidate. Further, it has poor metabolic stability due to rapid hydrolysis by β-glucosidase resulting in low oral bioavailability, short plasma half lives and toxic effects of the aglycon phloretin. To minimize the gastrointestinal side effects, the chemical structure of phlorizin was
25
modified in the late 1990s. The O-glucoside analog T-1095 showed promising glucose lowering effects in several diabetes models, however its development was discontinued in phase II (109). Several O-glucoside SGLT2 inhibitors were developed, but all “first generation” compounds were rejected due to the metabolic lability of the O-glucoside bond resulting in insufficient plasma half life. This problem was solved by C-glucoside- based “second generation” SGLT2i providing greater resistance to β-glucosidase, hence greater oral bioavailability. This discovery has led to the development of longer-acting and more selective SGLT2i.
Dapagliflozin (DAPA) was the frontrunner of C-glucoside-based SGLT2i development.
The in vitro SGLT inhibitory potential (EC50) of DAPA is 1.1 nM for human SGLT2, equaling 1200-fold selectivity for SGLT2 over SGLT1 compared with phlorizin’s 10-fold selectivity. This proved that DAPA is a metabolically robust and selective SGLT2 inhibitor (110). Forxiga™ (DAPA) was the first agent approved by the European Medicines Agency (EMA) for the treatment of T2DM in April 2012, followed by the Food and Drug Administration (FDA) in the United States shortly after. DAPA was followed by canagliflozin and empagliflozin; all three have been approved in the United States and in the European Union. Ipragliflozin, tofogliflozin and luseogliflozin have been approved in Japan. This new class of oral drugs is generally well tolerated and all of them induce sustained glucosuria associated with good blood glucose lowering effect in T2DM. Due to SGLT2i’s unique insulin-independent mode of action, their efficacy does not decrease with progressive β-cell dysfunction and/or insulin resistance. Further, SGLT2i can be prescribed as add-on therapy to other antidiabetic agents.
Metabolic control in diabetes requires lifelong treatment, thus drug safety is of paramount importance. Human trial reports on the safety and efficacy of SGLT2i have not revealed major adverse side effects. Despite of this, genital and urinary tract and mycotic infections are the most common salutary effects of SGLT2i; however, these were generally mild to moderate in intensity. In addition, FDA issued a Drug Safety Communication warning in 2015 that SGLT2i treatment may lead to euglycemic DKA. Cases have been reported in both T1DM and T2DM diabetic patients. Euglycemic DKA is a consequence of lower insulin levels, hyperglucagonemia and volume depletion leading to lipolysis and
26
ketogenesis. Of note, the FDA identified potential triggering factors of DKA e.g.
intercurrent illness, reduced food and fluid intake, reduced insulin doses and history of alcohol intake. Despite of this, the Empagliflozin Cardiovascular Outcome Event Trial in Type 2 Diabetes Mellitus Patients-Removal of Excess Glucose (EMPA-REG OUTCOME) study did not find any difference in rates of ketoacidosis in T2DM patients treated with empagliflozin vs. placebo. Nevertheless, further studies are needed to define the clinical relevance and the mechanisms involved.
1.4.1 Pleiotropic effects of SGLT2 inhibitors
The proof of cardiovascular safety for new glucose-lowering therapies has been required by FDA since 2008. Empagliflozin, canagliflozin, and dapagliflozin have been evaluated for cardiovascular safety in large-scale multicenter clinical trials: EMPA-REG OUTCOME, Canagliflozin Cardiovascular Assessment Study (CANVAS) and Dapagliflozin Effect on Cardiovascular Events-Thrombolysis in Myocardial Infarction 58 (DECLARE-TIMI 58), respectively (111-113). Each of these trials showed low incidence of heart failure and mitigated loss of kidney function in patients with T2DM and cardiovascular disease. These data indicate that renoprotection may be a class effect of SGLT2i. The objective of these trials was to investigate the cardiovascular safety of SGLT2i, hence subjects at high cardiovascular risk were primary enrolled and only relatively few patients with established CKD were included. Improved renal outcomes in these trials suggested that SGLT2i might also improve renal outcomes for patients with established DKD. The Canagliflozin and Renal Events in Diabetes with Established Nephropathy Clinical Evaluation (CREDENCE) trial recently proved that SGLT2i slow the progression of DKD. Patients with T2DM and albuminuric CKD (ratio of albumin [mg] to creatinine [g], >300 to 5000 and eGFR 30-90 mL/min/1.73 m2) who were already receiving RAAS blockers were enrolled in the CREDENCE study. The progression to ESRD, a doubling of the creatinine level or death from renal failure were 34% lower in the SGLT2i treatment group vs. placebo at a median follow-up of 2.6 years (114). Another ongoing clinical trial, A Study to Evaluate the Effect of Dapagliflozin on Renal Outcomes and Cardiovascular Mortality in Patients With Chronic Kidney Disease (DAPA-CKD) is evaluating the effect of DAPA on renal outcomes and cardiovascular mortality in patients
27
with chronic kidney disease (eGFR 25-75 mL/min/1.73m2). Comparison studies suggest that SGLT2i are more renoprotective than other antidiabetics (e.g. GLP analogues) with similar glucose lowering effect (115). These results were substantiated by another study in which reduced albuminuria was independent of changes in HbA1c, blood pressure or body weight in DAPA-treated T2DM patients (116). Thus, renoprotection may arise not only beacuse of lower glucose levels, but due to other mechanisms of SGLT2i, such as inhibition of TGF, anti-inflammatory or anti-fibrotic effects. These renoprotective outcomes are encouraging and indicate that SGLT2i offer a promising therapeutic option in the future management of patients with T2DM.
1.4.2 SGLT2 inhibitors for the treatment of type 1 diabetes
DAPA is the first SGLT2i approved in the European Union as an adjunct to insulin in T1DM adults with a body mass index (BMI) of ≥ 27 kg/m2, when insulin alone does not provide adequate glycemic control despite optimal insulin therapy. The therapeutic efficacy of DAPA as an adjunct to insulin in adult patients with insufficiently controlled T1DM was assessed in 24-week, phase III studies, Dapagliflozin Evaluation in Patients with Inadequately Controlled Type 1 Diabetes (DEPICT)-1 and in DEPICT-2. The results of DEPICT-1 showed a significant reduction in HbA1c, body weight, total insulin dose and glycemic variability with no increase in the risk of hypoglycemia or DKA (117).
Improved HbA1c, mean glucose levels, glycemic variability and time in glycemic target range with no increase in hypoglycemia vs. placebo were demonstrated in DEPICT-2.
Although there were several events of DKA in patients receiving DAPA (118). Overall, the DEPICT trials provide short-term evidence for using DAPA as adjunct therapy to adjustable insulin to improve glycemic control in T1DM patients. Therefore, the aim of my PhD work was to investigate the potential protective properties of DAPA as a promising therapeutic option of DKD in a rat model of T1DM.
28 2 OBJECTIVES
The objective of our study was to identify new therapeutic options in the management of DKD. Based on the current literary data indicating that SGLT2i are renoprotective beyond their blood glucose lowering properties, the aim of our experiments was to investigate the potential antifibrotic effects of DAPA in DKD with special focus on protein O- GlcNAcylation and tubular hypoxia. We also wanted to compare the renoprotective effects of SGLT2i with the current gold-standard clinical therapy with RAAS inhibitors.
Specific aims:
1. To determine the antifibrotic and renoprotective effects of various RAASi in monotherapy in experimental model of T1DM
2. To investigate the safety and efficacy of DAPA and DAPA combined with ARB losartan in T1DM
3. To analyze the protective effects of DAPA in DKD
4. To evaluate the possible antifibrotic role of DAPA both in vivo and in vitro
5. To determine the effects of DAPA and DAPA combined with losartan on protein O- GlcNAcylation and hypoxia in human proximal tubular cells
29 3 METHODS
Study approval
All experiments were conducted in accordance with guidelines of the Committee on the Care and Use of Laboratory Animals of the Semmelweis University Budapest, Hungary (PEI/001/1731-9-2015).
Materials
All chemicals and reagents were purchased from Sigma-Aldrich (St. Luis, MO, USA) and all standard plastic laboratory equipment was purchased from Sarstedt (Numbrecht, Germany) unless stated otherwise.
3.1 Animals and experimental design
Experiments were performed on eight-week old male Wistar rats (Rattus norvegicus) purchased from Toxi-Coop Ltd. (Budapest, Hungary). Rats were housed in plastic cages under a 12-hour light/dark cycle at constant temperature (24±2 °C) with ad libitum access to standard rodent chow and tap water.
Diabetes was chemically induced with a single intraperitoneal injection of 65 mg/bwkg streptozotocin (STZ) dissolved in 0.1 M citrate buffer (pH 4.5). Blood glucose levels were measured with a Dcont Ideal device (77 Elektronika, Budapest, Hungary) three times from tail vein. Rats with a peripheral blood glucose value above 15 mmol/L 72 hours after the STZ injection were enrolled in the study. Two different experimental protocols were used.
30 Protocol I
After five weeks of diabetes rats were randomized into five groups (n=7-8/group) and were treated daily by oral gavage for 2 weeks as follows:
1. isotonic saline as vehicle (D)
2. enalapril dissolved in isotonic saline (D + ENA; 40 mg/bwkg/day) 3. losartan dissolved in isotonic saline (D + LOS; 20 mg/bwkg/day) 4. spironolactone dissolved in isotonic saline (D + SPI; 50 mg/bwkg/day) 5. eplerenone dissolved in isotonic saline (D + EPL; 50 mg/bwkg/day).
Doses were adopted from our previous studies in line with literary data where effective blockade of ACE, AT1R or aldosterone activity was achieved without changes in systemic blood pressure (119-121). Non-diabetic, age-matched controls (n=7-8/group) received equivalent volumes of citrate buffer without STZ once, and the same amount of saline by oral gavage daily at the same time as the diabetic animals throughout the 2-week treatment period (Fig. 7).
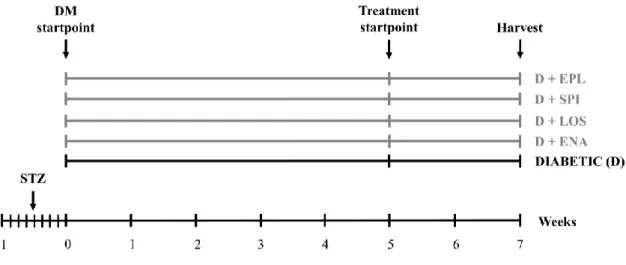
Figure 7 Experimental design of Protocol I. After five weeks of diabetes rats were randomized into five groups (n=7- 8/group) and were treated daily by oral gavage for 2 weeks with isotonic saline as vehicle or D+ENA: D+enalapril, D+LOS: D+losartan, D+SPI: D+spironolactone, D+EPL: D+eplerenon. DM: diabetes mellitus, STZ: streptozotocin
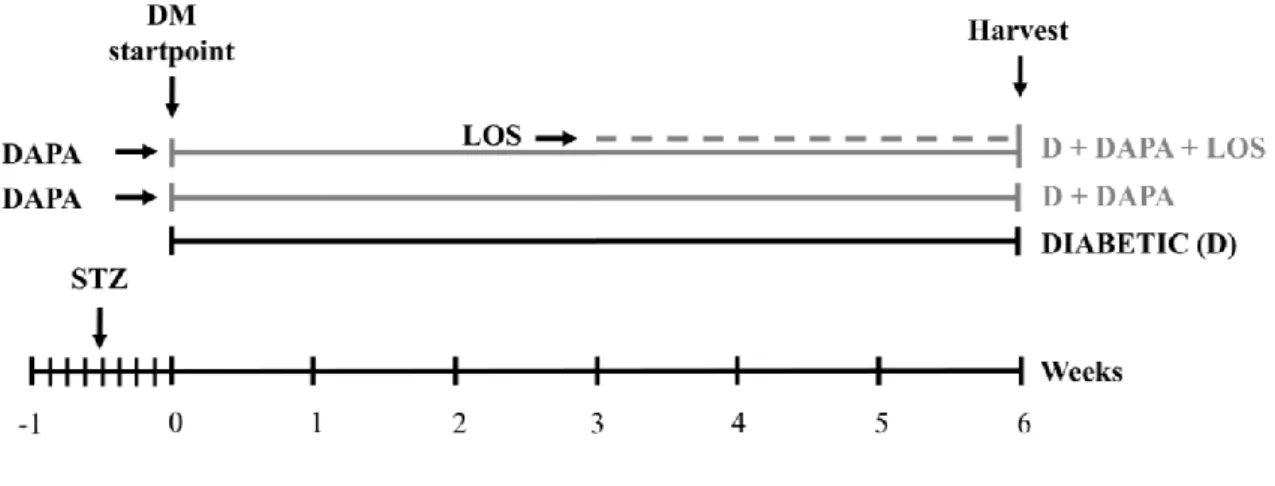
31 Protocol II
Rats were randomly divided into three groups immediately after the onset of diabetes (n=6 in D and n=7 in treatment groups) and were treated per os as follows:
1. isotonic saline as vehicle (D)
2. DAPA dissolved in isotonic saline (D + DAPA; 1 mg/bwkg/day for six weeks) 3. DAPA + losartan dissolved in isotonic saline (D + DAPA + LOS; 1 mg/bwkg/day
DAPA for six weeks + 20 mg/bwkg/day losartan in the last three weeks of the protocol)
Age-matched controls (n=6) received the equivalent volume of citrate buffer without STZ once, and the same amount of saline by oral gavage daily at the same time as the diabetic animals during the 6-week study period. Rats were weighed daily; blood glucose levels were measured weekly. Blood pressure, serum and urinary parameters were determined twice throughout the study period (Fig. 8).
Figure 8 Experimental design of Protocol II. Rats were randomly divided into three groups immediately after the onset of diabetes (n=6 in D and n=7 in treatment groups) and were treated per os as follows: isotonic saline as vehicle (diabetic) or dapagliflozin (D+DAPA) or dapagliflozin + losartan (D + DAPA + LOS; DAPA for six weeks + losartan in the last three weeks of the protocol). STZ: streptozotocin
32
In both protocols, rats were placed into metabolic cages to collect urine for a 24-hour period before euthanasia. At the end of the experiments rats were anesthetized by a mixture of 75 mg/bwkg ketamine (Richter Gedeon, Budapest, Hungary) and 10 mg/bwkg xylazine (Medicus Partner, Biatorbagy, Hungary) after which terminal blood was drawn from the abdominal aorta to sacrifice the animals. Blood, urine and kidney samples were collected and stored for further investigations.
3.2 Measurement of arterial blood pressure
Systolic and diastolic pressures were measured on tail vein using a CODA Standard monitor system (EMKA Technologies, Paris, France) which uses clinically validated proprietary volume pressure recording. Mean arterial pressure (MAP) was calculated.
3.3 Metabolic and renal parameters
Serum and urinary parameters were photometrically determined with commercially available kits on a Hitachi 912 photometric chemistry analyzer (Roche Hitachi, Basel, Switzerland). Creatinine clearance, albumin excretion and glucosuria were determined from 24-hour collected urine. Urinary kidney injury molecule-1 (KIM-1) and neutrophil gelatinase-associated lipocalin (NGAL) levels were measured using rat specific enzyme- linked immunosorbent assays (ELISA) (R&D Systems, Minneapolis, MI, USA).
3.4 Cell cultures and experimental design
Human proximal tubular epithelial cell line (HK-2; LGC Standards, ATCC Cat#CRL- 2190, American Type Culture Collection, Manassas, VA, USA) was grown in DMEM (5.5 mM or 25 mM D-glucose) supplemented with 10% FBS, 1% L-glutamine, 1%
antibiotic, antimycotic solution containing 10,000 IU/mL penicillin, 10 mg/mL streptomycin and 25 mg/mL Amphotericin B (Thermo Fisher Scientific, Waltham, MA, USA). Cells were incubated at 37 °C in a humidified atmosphere of 5% CO2 and 95% air.
Then, cells were plated either in 6-well plates (5×10⁵ cells/well) or in 24-well plates
33
(1.2×10⁵ cells/well) and there was a growth arrest period of 24 hours in serum-free medium before treatment in all experiments. Three sets of experiments were performed.
Hyperglycemia model
The effect of high glucose was tested on HK-2 proximal tubular cells cultured in DMEM containing 5.5 mM glucose and treated with high glucose (HG; final cc. 35 mM) or high mannitol (final cc. 35 mM) for 24 hours. HG cells were treated with 10 µM DAPA (HG + DAPA; Santa Cruz Biotechnology Inc., Heidelberg, Germany) or 10 µM DAPA combined with 10 µM LOS (HG + DAPA + LOS) for 24 hours. Cells in 5.5 mM glucose conditions served as controls and mannitol treated cells were used for testing hyperosmolarity per se.
Hypoxia model
Hypoxia was induced in bold line stage top CO2/O2 incubator (Okolab, Ottaviano, Italy) by keeping the cells in 1% O2 for 2 hours. HK-2 cells cultured in medium containing 25 mM glucose were treated as follows: 10 µM DAPA (H + DAPA) or 10 µM DAPA combined with 10 µM LOS (H + DAPA + LOS) for 24 hours before harvest. Cells were harvested at the end of hypoxia. Cells cultured under normoxic conditions served as controls.
Cell viability and proliferation assay
Prior to the experiments, the non-toxic dosage of DAPA and LOS was confirmed by methyl-thiazoletetrazolium assay (MTT) (Roche Diagnostics, Mannheim, Germany).
Cell viability was determined by MTT assay according to the manufacturer’s instructions.
Cell viability was also assessed by trypan blue exclusion. Cells were detached with trypsin-EDTA and re-suspended in medium diluted 1:1 with trypan blue solution. Live cells from triplicate wells were counted in a Bürker chamber.
34 3.5 Conventional renal histology
Periodic acid-Schiff staining
Renal cortex was separated under light microscope and fixed in 4% buffered formalin, embedded in paraffin and 5 µm thick sections were cut. Images were taken with a Zeiss AxioImager A1 light microscope (Zeiss, Jena, Germany). To evaluate mesangial matrix expansion sections were stained with periodic acid-Schiff (PAS). Twenty fields of x400 magnification containing glomeruli were randomly selected per animal, excluding incomplete glomeruli along the sample edge. The ratio of mesangial area (number of pixels containing purple mesangial matrix deposition) per glomerular tuft area (total number of pixels in the glomerulus) was measured in each glomerulus.
Masson's trichrome staining
To evaluate tubulointerstitial fibrosis sections were stained with Masson’s trichrome. Ten fields of x200 magnification were randomly selected from cortical and cortico-medullary regions respectively per animal. The ratio of Masson-stanied fibrotic area (pixels containing stained interstitial fibrotic tissue) per total area (total number of pixels in the area) was measured in each field.
Picrosirius red staining
To evaluate collagen accumulation sections were stained with Picrosirius red. Ten fields of x200 magnification were randomly selected from cortical and cortico-medullary regions per animal. The ratio of Picrosirius red-stanied interstitial area per total area was measured in each field area to obtain the percentage of collagen deposition.
Areas were measured with Panoramic Viewer software version 1.15.2 (3DHISTECH, Budapest, Hungary). Analysis was performed in a double blinded fashion with computer- assisted morphometry using Adobe Photoshop CS6 (Adobe Inc., San José, CA, USA) and Image J (US National Institute of Health, Bethesda, MD, USA) softwares.
35 3.6 Immunohistochemistry
All reagents for and fibronectin immunohistochemistry were obtained from Hisztopatologia (Pecs, Hungary) respectively. Slides were deparaffinized in xylene, rehydrated in graded ethanol series and washed in dH2O. Heat-induced epitope retrieval was performed by boiling the paraffin-embedded tissue sections in citrate buffer (pH=6).
Slides were peroxidase blocked and nonspecific attachments were inhibited with protein solution. Sections were incubated against fibronectin (ab2413; Abcam, Cambridge, MA, USA) antibody followed by peroxidase labelled anti-rabbit antibody. Fibronectin was visualized with HISTOLS-Resistant AEC Chromogen/Substrate System counterstained with hematoxylin and eosin and mounted with permanent mounting medium. Evaluation of fibronectin staining was performed similarly to PAS stained samples.
3.7 Immunocytochemistry
HK-2 cells were cultured in tissue culture chambers and various treatments or hypoxia were applied. After repeated washing cells were fixed in 4% paraformaldehyde, washed again with phosphate buffered saline (PBS) and permeabilized with Triton X-100. After blocking with 5% bovine serum albumin (BSA) cells were incubated with the same O- GlcNAc and HIF-1α antibodies used for western blotting for overnight at 4 °C. After repeated washing cells were incubated with specific secondary antibodies: Alexa Fluor 488 goat anti-mouse (A-11001; Invitrogen™, Carlsbad, CA, USA) and Alexa Fluor 488 chicken anti-rabbit (A-21441; Invitrogen™) respectively for 1 hour at room temperature.
Samples were washed with PBS and nuclei were counterstained with Hoechst 33342 (4082S; Cell Signaling Technology Inc., Danvers, MA, USA). Cells were mounted with ProLong Glass Antifade Mountant then a glass coverslip was added (P36982, Invitrogen™). Appropriate controls were performed, omitting the primary antibody to assure specificity and to avoid autofluorescence. Cells were imaged using an inverted microscope (Ti2; Nikon, Tokyo, Japan) equipped with a 20x objective (CFI Plan Apochromat Lambda, N.A. 0.75). For the semi-quantitative evaluation of fluorescence 10 visual fields/treatment were analyzed with ImageJ software (US National Institute of Health) (122).
36
3.8 Measurement of biomarkers of ECM formation and degradation
The biomarkers rPRO-C3 (measuring collagen type III formation), uC3M (measuring collagen type III degradation by MMP-9), and TUM (measuring tumstatin, a collagen type IV fragment degraded by MMP-9) were measured in rat urine samples using competitive ELISA developed by Nordic Bioscience (Herlev, Denmark). Biomarker levels were normalized to urinary creatinine levels measured using the QuantiChromTM Creatinine Assay kit (BioAssay Systems, USA). The assays were carried out at Nordic Bioscience laboratories following previously described protocols (123). Briefly, a streptavidin-coated 96-well ELISA plate were coated with biotinylated peptide for 30 min. Plates were washed and incubated with standard peptide or sample together with HRP-conjugated monoclonal antibody and incubated for overnight at 4°C (uC3M, rPRO- C3) or 1 hour at room temperature (TUM). Plates were washed and incubated with 3,3ʹ,5,5-tetramethylbenzidine (4380H, Kem-En-Tec, Taastrup, Denmark) for 15 min at room temperature in the dark. To stop the reaction, 1% sulfuric acid solution was added, and plates were analysed with the ELISA reader at 450 nm with 650 nm as reference (VersaMax, Molecular Devices, CA, USA).
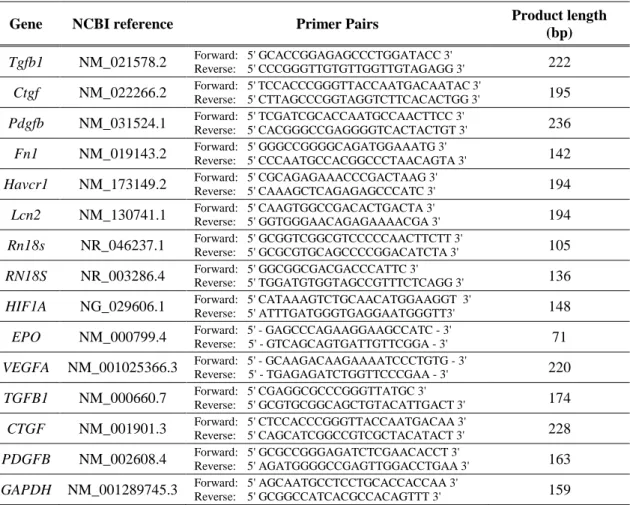
3.9 Quantitative RT-PCR
Total RNA was extracted using the Total RNA Mini Kit (Geneaid Biotech Ltd, New Taipei City, Taiwan). The quality and quantity of isolated RNA was measured on a NanoDrop ND-1000 spectrophotometer (Baylor College of Medicine, Houston, TX, USA). 500 ng RNA was reverse-transcribed using Maxima™ First Strand cDNA Synthesis Kit for RT-qPCR (Thermo Fisher Scientific, Waltham, MA, USA) to generate first-strand cDNA. Tgfb1, Ctgf, Pdgfb, Fn1, Havcr1, Lcn2, Rn18S, TGFB1, CTGF, PDGFB, HIF1A, GAPDH and RN18S mRNA expressions were determined in duplicates using LightCycler 480 SYBR Green I Master enzyme mix (Roche Diagnostics, Indianapolis, IN, USA) and specific primers listed in Table 1. Primer sequences were designed using Lasergene PrimerSelect software version 7.1.0 (DNASTAR, Madison, WI, USA) based on nucleotide sequences from the nucleotide database of National Center for Biotechnology Information. Results were analyzed by the LightCycler® 480 software
37
version 1.5.0.39 (Roche Diagnostics, Indianapolis, IN, USA). Target gene expressions were normalized against Rn18S or RN18S mRNA or GAPDH housekeeping genes.
Table 1 Sequences of primer pairs for quantitative RT-PCR.
Gene NCBI reference Primer Pairs Product length
(bp) Tgfb1 NM_021578.2 Forward: 5' GCACCGGAGAGCCCTGGATACC 3'
Reverse: 5' CCCGGGTTGTGTTGGTTGTAGAGG 3' 222 Ctgf NM_022266.2 Forward: 5' TCCACCCGGGTTACCAATGACAATAC 3'
Reverse: 5' CTTAGCCCGGTAGGTCTTCACACTGG 3' 195 Pdgfb NM_031524.1 Forward: 5' TCGATCGCACCAATGCCAACTTCC 3'
Reverse: 5' CACGGGCCGAGGGGTCACTACTGT 3' 236 Fn1 NM_019143.2 Forward: 5' GGGCCGGGGCAGATGGAAATG 3'
Reverse: 5' CCCAATGCCACGGCCCTAACAGTA 3' 142 Havcr1 NM_173149.2 Forward: 5' CGCAGAGAAACCCGACTAAG 3'
Reverse: 5' CAAAGCTCAGAGAGCCCATC 3' 194 Lcn2 NM_130741.1 Forward: 5' CAAGTGGCCGACACTGACTA 3'
Reverse: 5' GGTGGGAACAGAGAAAACGA 3' 194 Rn18s NR_046237.1 Forward: 5' GCGGTCGGCGTCCCCCAACTTCTT 3'
Reverse: 5' GCGCGTGCAGCCCCGGACATCTA 3' 105 RN18S NR_003286.4 Forward: 5' GGCGGCGACGACCCATTC 3'
Reverse: 5' TGGATGTGGTAGCCGTTTCTCAGG 3' 136 HIF1A NG_029606.1 Forward: 5' CATAAAGTCTGCAACATGGAAGGT 3'
Reverse: 5' ATTTGATGGGTGAGGAATGGGTT3' 148 EPO NM_000799.4 Forward: 5' - GAGCCCAGAAGGAAGCCATC - 3'
Reverse: 5' - GTCAGCAGTGATTGTTCGGA - 3' 71 VEGFA NM_001025366.3 Forward: 5' - GCAAGACAAGAAAATCCCTGTG - 3'
Reverse: 5' - TGAGAGATCTGGTTCCCGAA - 3' 220 TGFB1 NM_000660.7 Forward: 5' CGAGGCGCCCGGGTTATGC 3'
Reverse: 5' GCGTGCGGCAGCTGTACATTGACT 3' 174 CTGF NM_001901.3 Forward: 5' CTCCACCCGGGTTACCAATGACAA 3'
Reverse: 5' CAGCATCGGCCGTCGCTACATACT 3' 228 PDGFB NM_002608.4 Forward: 5' GCGCCGGGAGATCTCGAACACCT 3'
Reverse: 5' AGATGGGGCCGAGTTGGACCTGAA 3' 163 GAPDH NM_001289745.3 Forward: 5' AGCAATGCCTCCTGCACCACCAA 3'
Reverse: 5' GCGGCCATCACGCCACAGTTT 3' 159
38 3.10 Western blot
All reagents and equipment for Western blot were obtained from Bio-Rad Laboratories Inc. (Hercules, CA, USA) unless stated otherwise. Total protein was extracted from kidney cortex and HK-2 cells. Samples were homogenized in lysis buffer (1 M Tris, 0.5 M EGTA, 1% Triton X-100, 0.25 M NaF, 0.5 M phenylmethylsulfonyl fluoride, 0.5 M sodium orthovanadate, 5 mg mL−1 leupeptin, and 1.7 mg mL−1 aprotinin, pH 7.4) by Fastprep RP120 homogenisator (Thermo Fisher Scientific). Lysates were centrifuged at 13 000 rpm at 4°C for 10 min. Protein concentration of the supernatants was measured in 96-well microplates with a DC™ Protein Assay kit at 650 nm by a SPECTROstar Nano microplate reader (BMG Labtech, Ortenberg, Germany). Protein samples were mixed with 4x Laemmli sample buffer (1:3) and heated at 95 °C for 5 minutes or 37 °C for 30 minutes.
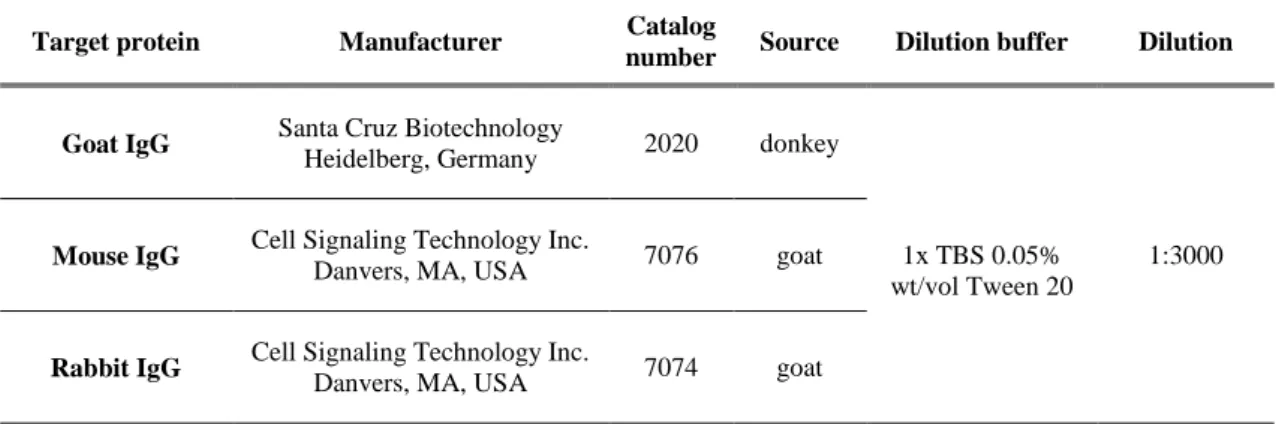
Samples were electrophoretically resolved on polyacrylamide gradient gels (4-20%) and transferred to nitrocellulose membranes with fast and high-efficiency semi-dry Trans- Blot Turbo™ Transfer System. The protein transfer was verified by 1% Ponceau S staining. After blocking, membranes were immunoblotted with specific primary antibodies. After repeated washing, the blots were incubated with the appropriate horseradish peroxidase (HRP)-conjugated secondary antibodies. LuminataTM Forte Western HRP Substrate (Millipore Corporation, Billerica, MA, USA) was used for chemiluminescent detection of blots. Details of antibodies are listed in Table 2 and Table 3.
Densitometric analysis of bands was performed by Quantity One Analysis software (Bio- Rad Laboratories Inc.). After background subtraction, integrated optical densities of bands of interest were factored for Ponceau S staining to correct for variations in total protein loading. Each blot was normalized to an internal control so that bands on separate blots could be compared.