Received 20 Feb 2015|Accepted 28 Oct 2015|Published 27 Nov 2015
Differential epigenetic reprogramming in response to specific endocrine therapies promotes
cholesterol biosynthesis and cellular invasion
Van T.M. Nguyen1,*, Iros Barozzi2,*, Monica Faronato1, Ylenia Lombardo1, Jennifer H. Steel1, Naina Patel1, Philippa Darbre3, Leandro Castellano1, Bala´zs Gy+orffy4,5, Laura Woodley6, Alba Meira1, Darren K. Patten1, Valentina Vircillo7, Manikandan Periyasamy1, Simak Ali1, Gianmaria Frige2, Saverio Minucci2,
R. Charles Coombes1 & Luca Magnani1
Endocrine therapies target the activation of the oestrogen receptor alpha (ERa) via distinct mechanisms, but it is not clear whether breast cancer cells can adapt to treatment using drug-specific mechanisms. Here we demonstrate that resistance emerges via drug-specific epigenetic reprogramming. Resistant cells display a spectrum of phenotypical changes with invasive phenotypes evolving in lines resistant to the aromatase inhibitor (AI). Orthogonal genomics analysis of reprogrammed regulatory regions identifies individual drug-induced epigenetic states involving large topologically associating domains (TADs) and the activation of super-enhancers. AI-resistant cells activate endogenous cholesterol biosynthesis (CB) through stable epigenetic activation in vitro and in vivo. Mechanistically, CB sparks the constitutive activation of oestrogen receptors alpha (ERa) in AI-resistant cells, partly via the biosynthesis of 27-hydroxycholesterol. By targeting CB using statins, ERabinding is reduced and cell invasion is prevented. Epigenomic-led stratification can predict resistance to AI in a subset of ERa-positive patients.
DOI: 10.1038/ncomms10044 OPEN
1Department of Surgery and Cancer, Imperial College London, London W12 0NN, UK.2IFOM-IEO Campus, European Institute of Oncology, Milan 20139, Italy.3School of Biological Science, University of Reading, Reading RG6 6LA, UK.4MTA TTK Lendu¨let Cancer Biomarker Research Group, 2nd Department of Pediatrics, Semmelweis University, Budapest H-1117, Hungary.5MTA-SE Pediatrics and Nephrology Research Group, 2nd Department of Pediatrics, Semmelweis University, Budapest H-1117, Hungary.6ECMC, Charing Cross Hospital, London W120nn, UK.7Department of Pharmacy, Health and Nutritional Sciences, University of Calabria, Arcavacata di Rende (CS) 87036, Italy. * These authors contributed equally to this work. Correspondence and requests for materials should be addressed to L.M. (email: l.magnani@imperial.ac.uk).
O
ver 70% of all breast cancers are characterized by the expression of the nuclear receptor oestrogen receptor alpha (ERa)1. Patients with ERa-positive disease are routinely treated with adjuvant endocrine therapies (ETs) after surgery. ETs include a series of compounds designed to interfere with ERa activation, including selective oestrogen receptor modulators (for example, tamoxifen), aromatase inhibitors (AIs, for example, Letrozole and Anastrozole) and selective oestrogen receptor downregulators (Faslodex/Fulvestrant)2. Tamoxifen competitively bind to ERa in the place of estrogens such as estradiol (E2). AIs are designed to deplete the estrogens in circulation, while Fulvestrant irreversibly bind to ERaleading to ERa degradation. Over 40% of ERa breast cancers eventually relapse from ETs becoming progressively refractory to further treatments1. It remains unclear whether resistance to ETs involves drug-specific mechanisms. Since ETs are characterized by different mechanisms2,3, it is conceivable that chronic exposure to therapy may impart specific selective pressure and elicit different response mechanisms to induce stable phenotypic changes.During development and differentiation, cell identity is established by the epigenetic activation of cell-type-specific distal regulatory elements mediated by combinatorial patterns of histone modifications4,5. These regions are often embedded in chromatin-accessible sites and contain DNA sequence motifs for cell-type-specific transcription factors (TFs)6. The epigenome retains some degree of plasticity, as cell identity can be epigenetically reprogrammed by exposure to external stimuli such as the ectopic expression of TFs6. Cancer cells can also remodel histone modifications and chromatin accessibility in response to chronic exposure to therapeutic agents7–9. For example, adaptation to oestrogen deprivation in ERa-positive breast cancer cells invokes extensive epigenetic reprogramming especially in distal regulatory regions such as enhancers7. Regulatory elements directly associated with active transcription, and more complex regulatory regions (that is, super-enhancers (SEs)) can be mapped by measuring the histone modification histone 3-lysine 27 (H3K27ac)10–14. In this study, we have investigated the nature of drug adaptation to a diverse range of ETs in isogenic ERa-positive breast cancer cells using integrative and orthogonal epigenomic approaches.
Our data demonstrate that breast cancer cells evolve individual epigenomic and transcriptomic profiles in response to treatment.
Both in vitro and in vivo, AI-resistant cells acquire the most aggressive phenotype and develop invasive characteristics in two- dimensional and three-dimensional (3D). Integrative analyses of AI-resistant cells identify stable upregulation of the entire cholesterol biosynthesis (CB) pathways including genes involved in 27-hydroxyl-cholesterol (27HC) biosynthesis. 27HC stimula- tion is sufficient to promote oestrogen-independent ERabinding to thousands of putative regulatory regions. In agreement with this finding, chromatin immunoprecipitation sequencing (ChIP- seq) analysis of the chromatin of AI-resistant cells confirmed extensive ERa binding despite oestrogen-deprived conditions.
Furthermore, CB blockers (statins) can reduce ERa binding to DNA and abrogate cell invasion. CB upregulation also occurs in vivoduring breast cancer progression. Finally, we demonstrate that a CB-based signature might be used to improve the stratification of ERa breast cancer patients before adjuvant treatment.
Results
Adaptation to AI treatment leads tode novoinvasiveness. ETs are designed to block oestrogen-driven proliferation by inter- fering with one specific TF (for example, ERa). However, we
hypothesized that the development of resistance may follow distinct routes and generate alternative phenotypes through the different molecular mechanisms specific to each agent2. To test this hypothesis, we used a series of isogenic cell lines resistant to single agents or a combination of agents (endocrine therapy (ET)- resistant ETR cells, Fig. 1a)15. Our aim was to understand the connection between the acquisition of drug-resistance and breast cancer progression, particularly metastatic development. We then carried out a real-time, impedance-based assay to monitor the migratory and invasion behaviour of ETR cells. These assays demonstrated that long term estrogen deprived (LTED) cells (mimicking AI resistance16) specifically develop migration and invasion properties, while MCF7- and TAM/Fulvestrant-resistant cells (MCF7T and MCF7F) do not (Fig. 1b; Supplementary Fig. 1A). It is worth noting that sequential resistance did not increase these traits (LTEDT and LTEDF versus LTED). To corroborate these findings, we developed a 3D invasion assay (organoids assay) in which the cells were allowed to form 3D bodies and then embedded in Matrigel. In agreement with the 2D assay, AI-resistant cells (LTEDs) spread remarkably through the Matrigel environment, while the MCF7s do not (Fig. 1c;
Supplementary Movie 1A–D). Finally, we developed a metastatic mouse model to validate our findings in vivo by engineering two red-fluorescent protein reporter (mCherry) lines (MCF7-FRP and LTED-RFP). After injection into the tail vein of NOD-SCID mice (Fig. 1c), only LTED cells colonize several sites including the lymph nodes and bones (Fig. 1d). Histology analyses of putative metastatic tissues from the lymph nodes and bone marrow confirms that the invading cells are of human origin and contains breast cancer protein markers17 (HNA and PBX1 (ref. 18), Fig. 1d; Supplementary Fig. 1B). Overall, these data demonstrate that AI-resistant cells acquire traits common to aggressive breast cancers. Tamoxifen- or Fulvestrant-resistant cells, although becoming resistant to the cytostatic effect of the agent, do not evolve into highly invasive cells thus supporting the notion of agent-specific reprogramming.
ETR cells follow distinct reprogramming routes. To decipher the molecular changes induced by drug-specific resistance, we developed an unbiased integrative approach combining RNA sequencing (RNA-seq) and H3K27ac ChIP-seq in ETR cells. All ETR cells express significantly lower messenger RNA (mRNA) levels for several oestrogen receptor target genes, indicating that ET treatments still exert negative pressure on ERasignalling. As expected, MCF7F and LTEDF cells acquire an ERa-negative status, while the rest of the panel remained ERa positive (Supplementary Fig. 2A). Interestingly, other chromatin compo- nents of ERasignalling19(for example, ERapioneer factors such as FoxA1, PBX1 and GATA3 (refs 20,21)) remain expressed at similar levels in all cell lines (Supplementary Fig. 2B,C). Cell lines with sequential resistance are characterized by a greater number of differentially regulated genes (Supplementary Fig. 3A).
Correspondingly, these cells display increased numbers of potential regulatory regions as demonstrated by the significant increase in H3K27ac-positive loci (Supplementary Fig. 3B). This increase could not simply be attributed to general changes in H3K27ac distribution (Supplementary Fig. 3C).
We then carried out a gene ontology analysis on our RNA-seq data to identify potential pathways responsible for the invasive phenotype characterizing LTED cells. To increase the power of these analyses, we clustered together all the genes differentially regulated in invasive (LTED–LTEDT–LTEDF) and non-invasive (MCF7T–MCF7F) cells (Supplementary Fig. 4A).
Strikingly, we found that LTED cells activated metabolic pathways and lipid metabolism (for example, super-pathway of
CB, Fig. 2a; Supplementary Fig. 4B; Supplementary Data 1). More importantly, these pathways were not active in non-invasive MCF7T and MCF7F cells (grey versus red bars), suggesting
differential transcriptional reprogramming (Fig. 2a). These changes are not transiently imposed by the culture condition, but rather represent stably engrained transcriptional. In point of
Δ Area Δ Area Δ Area Δ Area Δ Area Δ Area
0.99±0.2 0.95±0.3 0.99±0.2 3.02±0.4 3.1±0.3 4.25±0.3 5 Days 2 Days
10
–7 M
Tamoxifen >1 year MCF7T
MCF7FER–
LTED
LTEDT
LTEDFER–
10–7 M Fulvestrant >1 year
10–7 M Fulvestrant >1 year E2 deprivation>1 year
MCF7
ERα breast cancer cell adaptation protocol
3D matrigel invasion assay
MCF7 MCF7T MCF7F LTED LTEDT LTEDF
Day 2Day 0
In vivo metastatic model
MCF7-RFP LTED-RFP NOD-SCID Red fluorescent protein
Epi-fluorescence 15 14 13 12 11
×108
MCF7-RFP LTED-RFP
Day 1 Day 60
LTED-RFP
Bone marrow mets
H&E
MCF7-RFP
LTED-RFP Bone marrow Mets
Human nuclear antigen
Lymphnode mets Phenotypical
assays
Integrative -omics
In vivo validation
Proof of concept: biomarker/therapeutics
Migration
Cell index
1
0 5 10 15 20 25
1
0
1
0
5 10 15 20 25 5 10 15 20 25
MCF7 LTED
MCF7T LTEDT
MCF7F
LTEDF Blank
Time (h)
1° and 2° Ab 2° Ab only
d c b a
e
10–7 M Tamoxifen >1 year
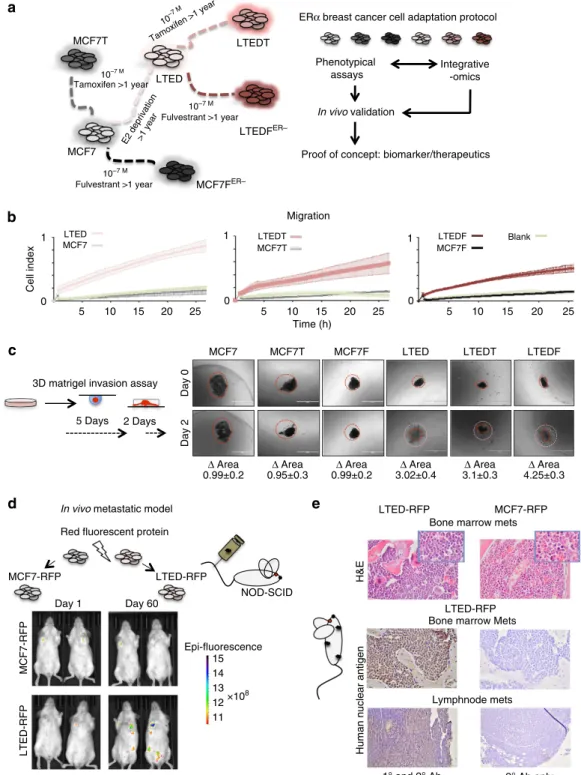
Figure 1 | Adaptation to AI treatment is associated with cell invasion.(a)In vitroadaptation experimental protocol: ERa-positive breast cancer cells (MCF7) were chronically exposed to endocrine therapies to generate ETR lines15. Each cell type was screened for the development of invasive potential.
ETR cells were also profiled using integrative epigenomics and the results were cross-validated using clinical samples. (b) Real-time monitoring of cell migration demonstrates increased motility of LTEDs cells compared with other resistant lines. (c) 3D organoids assay was used to demonstrate invasive potential under physical constraints (Matrigel).DArea is calculated using ImageJ (area day 2/area day 0,n¼5). The horizontal white bar indicates a distance of 1,000mm. (d) LTED cells can form metastasesin vivoat various sites. Cells were stably transfected with the mCherry construct, injected in the tail of the mice and followed usingin vivoimaging. (e) Snapshots of histological analysis of tissues from mice injected with LTED or MCF7 cells. The first two panels represent haematoxylin and eosin (H&E) staining on bone marrow (insets taken at a higher magnification). The bottom four panels represent immunohistochemistry on tissue from mouse bone marrow or lymph nodes showing invasion by cells immunoreactive for human nuclear antigen (left panels) or negative controls with no primary antibody (right panels).
Trans-farnesyl diphosphate biosynthesis Ethanol degradation IV
0 5 10 15
–Log (P value)
IPA pathway analysis
Interferon signalling Sertoli junction signalling Remodelling of ephytelial junctions
Role of tissue factor in cancer Inhibition of angiogenesis by TSP1 IL-17A signalling in fibroblasts IL-8 signalling Epithelial adherens junction signalling Chemokine signalling Renal cell carcinoma signalling IL-17 signalling Role of NANOG ESC pluripotency Germ cell–sertoli cell junction signalling Glucocorticoid receptor signalling Glycolysis I Semaphorin signalling in neurons IL-2 signalling IL-17A signalling in gastric cells HMGB1 signalling Cholesterol biosynthesis III
Glioma invasiveness signalling Superpathway of cholesterol biosynthesis Cholesterol biosynthesis I Cholesterol biosynthesis II Geranylgeranyldiphosphate biosynthesis I Mevalonate pathway I γ-linolenate biosynthesis II Zymosterol biosynthesis Protein kinase A signalling Stearate biosynthesis I Oleate biosynthesis II Fatty acid activation Type II diabetes mellitus signalling Oxidative ethanol degradation III Acetate conversion to acetyl-CoA Mitochondrial L-carnitine shuttle pathway Putrescine degradation III Cardiac β-adrenergic signalling
2
MCF7T U MCF7F LTED U LTEDT U LTEDF
LTED LTED_TamR LTED_FulvR MCF7 MCF7_TamR MCF7_FulvR FDPS MVD SQLE TM7SF2 LSS ACAA1 CYP51A1 DHCR7 NSDHL DHCR24 HMGCR LBR GGPS1 HMGCS1 IDI1
** ** *
* *
* * * *
* * * * *
0 3
Log2 ratio vs MCF7
* 0.2 ≤ FPKM < 1
** FPKM < 0.2 Cluster 5
Cluster 1
Cluster 2
Cluster 9
LTED LTEDT LTEDF MCF7 MCF7T MCF7F
13 (n = 23) 12 (n = 70) 11 (n = 81) 10 (n = 37) 9 (n = 104) 8 (n = 134) 7 (n = 193) 6 (n = 126) 5 (n = 380) 4 (n = 860) 3 (n = 249) 2 (n = 649) 1 (n = 4,759) H3K27ac
TSS-proximal
13 (n = 111) 12 (n = 128) 11 (n = 168) 10 (n = 238) 9 (n = 182) 8 (n = 167) 7 (n = 173) 6 (n = 610) 5 (n = 752) 4 (n = 307) 3 (n = 1,082) 2 (n = 767) 1 (n = 1,396) H3K27ac
TSS-distal
0.0 0.2 0.4 0.6 0.8 1.0
TSS−proximal TSS−distal
13 12 11 10 9 8 7 6 5 4 3 2 1 2 10
Median (FPKM)
mRNA
−1.5 +1.5 z-score (log2(RPKM))
LTED LTEDT LTEDF MCF7 MCF7T MCF7F LTED LTEDT LTEDF MCF7 MCF7T MCF7F
c d e
b a
g f
Molecular mechanisms of cancer EIF2 signalling Protein ubiquitination pathway mTOR signalling NRF2−mediated oxidative stress response Hypoxia signalling in the cardiovascular system GNRH signalling Regulation of eIF4 and p70S6K signalling CD27 signalling in lymphocytes NGF signalling Role NANOG in mammalian embryonic stem cell pluripotency Human embryonic stem cell pluripotency Estrogen receptor signalling Glioblastoma multiforme signalling Axonal guidance signalling Wnt/beta−catenin signalling Regulation of cellular mechanics by calpain protease Neuregulin signalling Actin cytoskeleton signalling Nucleotide excision repair pathway Glycogen degradation II Glycogen degradation III Cholesterol biosynthesis I Cholesterol biosynthesis II (via 24,25−dihydrolanosterol) Cholesterol biosynthesis III (via desmosterol) Superpathway of cholesterol biosynthesis Biotin−carboxyl carrier protein assembly Acetate conversion to acetyl−CoA Retinol biosynthesis Zymosterol biosynthesis Geranylgeranyldiphosphate biosynthesis Folate transformations I Tec kinase signalling Phenylalanine degradation IV (mammalian, via side chain) Semaphorin signalling in neurons Thrombin signalling Superpathway of geranylgeranyldiphosphate biosynthesis I (via mevalonate) GalphaQ signalling Phospholipase C signalling Signalling by Rho family GTPases
–Log10 (p)
0 4 8 12
Cluster 1 Cluster 2 Cluster 5 Cluster 9
TSS
TSS
TSS
TSS
TSS
TSS A B C D E 1
A1
Distal enhancer–promoter pairing strategy
A1 C3
A12 F26
B43
E38
Unsupervised clustering Deconvolution
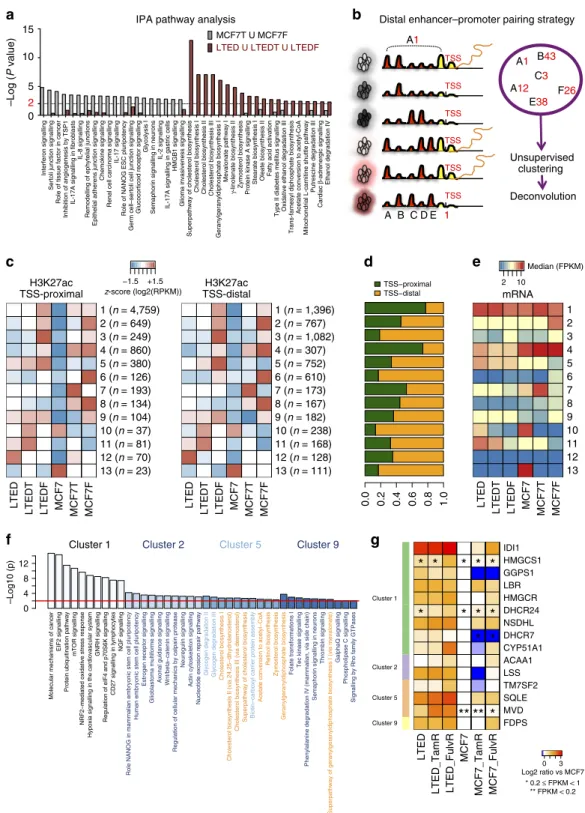
Figure 2 | Drug adaptation and epigenetic reprogramming.(a) IPA pathway analysis of differentially upregulated genes (for details of the analysis, see Supplementary Fig. 4A). The top 20 IPA pathways for invasive and non-invasive cells are plotted with their respectivePvalues. Metabolic pathways are in bold. The dotted line is set at a pVal¼0.01. (b) Diagrammatic image of the bioinformatics strategy adopted for the epigenetic analysis in the six cell lines.
For more details, please see the Methods (c) Heatmaps showing the mean H3K27ac level in each cluster for each of the six cell lines. Regions were split into TSS-proximal and distal and shown as separate heatmaps. Total number of regions in brackets. (d) The proportion of TSS-proximal and distal regions in each cluster is shown. (e) Heatmap showing the median of the linear FPKM for each cluster along the cell lines. (f) IPA canonical pathways significantly enriched considering the genes putatively regulated by the TSS-proximal elements in enhancer clusters. The 10 most enriched terms were extracted and their log10 (Pvalue) (Fisher’s exact test) are shown as bar plots. The red line is set at a pVal¼0.01. (g) FPKM values of genes belonging to the
‘Superpathway of Cholesterol Biosynthesis’ (IPA canonical pathways) identified using H3K27ac patterns alone but also showing a significant deregulation in RNA-seq compared with MCF7. Transcripts showing low expression levels are indicated with asterisks.
fact, we could not re-establish the original transcriptional profile (for example, MCF7) by culturing resistant cells in MCF7 culture conditions and the absence of endocrine treatment (Supplementary Fig. 4C).
We hypothesized that the reprogrammed transcriptomes evolved by invasive LTEDs cells might play a central role in driving aggressive breast cancerin vivo. To test this, we devised five individual cell signatures containing the top 10% of upregulated genes specific to each individual cell line (Supplementary Data 2) and split patients into high and low expressors (Supplementary Fig. 5A). Analysis of the METABRIC22 data set (restricting it to the ERa-positive patients) demonstrates that only LTED-based signatures significantly predict poor survival (Supplementary Fig. 5B,C).
Collectively, these data demonstrate that AI-resistant cell lines evolve transcriptional programmes typical of patients developing more aggressive tumours.
Drug resistance invokes activation of regulatory elements. We reasoned that chronic drug exposure probably acts as a constant selective pressure within our cell line system and allow for selective activations of regulatory regions. Indeed, we demon- strated that these changes become heritable and eventually independent from media conditions. We then investigated the epigenetic circuitry that drives the cell-type-specific transcription in our ETR models. By comparing our epigenomic maps with publically available H3K27ac profiles, we confirmed the common ancestry of ETR cells (data from ENCODE5), suggesting that adaptation to therapy does not entirely upset the epigenetic landscape (Supplementary Fig. 6A). Next, we devised a strategy to pinpoint the distal regulatory enhancers actively involved in regulating cell-type-specific gene expression (Fig. 2b). We first identified all the loci that showed changes in H3K27ac by comparing ETR cells with MCF7s using MACS23. We then pooled and clustered all the regions showing a significant increase or decrease in at least one cell line according to the co-variation of their patterns across the six cell lines (Fig. 2b and extended Methods). Using this strategy, we extrapolate genome-wide groups of potentially interacting TSS and enhancer pairs sharing the same pattern of activity across the lines (13 different clusters). Each cluster is then de-convoluted to TSS-proximal and TSS-distal (canonical enhancers) elements (Fig. 2c,d). We then match the promoter-proximal H3K27- acetylated regions to RefSeq genes and annotate the genes according to our RNA-seq analysis. These analyses demonstrate that H3K27ac at distal enhancers is highly consistent with H3K27ac at promoter and mRNA transcription (Fig. 2e).
Of note, our analysis provides a solid alternative for studying distal regulatory regions in the absence of detailed interaction maps.
We then used Ingenuity Pathway Analysis to identify cell-type- specific pathways based on canonical enhancers (Supplementary Data 3). Cluster 1 contains mainly promoter-proximal elements (Fig. 2d) and shows an increase in H3K27ac signals in all resistant cells (Fig. 2c). In agreement, pathways significantly enriched in this cluster have been previously associated with ET resistance (mTOR, EIF2, NGF, EGF and HER2 signalling22,24) (Fig. 2f).
Clusters 2 and 3 are directly associated to the loss of ERa, thus demonstrating the central role of this TF in breast cancer cells.
Despite over half of the regions in these groups mapping to distal enhancers, coding regions unambiguously assigned to TSS- proximal elements are enriched for pluripotency genes (Fig. 2f), a feature typical of basal, stem-like ERa-negative breast cancers25. Focusing on LTED-specific regulatory elements, cluster 5 and cluster 9 are almost exclusively enriched for genes belonging to
the super-pathway of CB confirming our transcriptional analysis (Fig. 2f). Overall, these unbiased epigenomics analyses strongly support our initial findings, and substantiate the hypothesis that AI-resistant cells epigenetically activate distinct pathways compared with other resistant cells.
Drug-resistance-specific activation of SEs. Our integrative epigenomic analyses suggest that endogenous activation of CB is one of the key pathways epigenetically activated in AI-resistant cells. Epigenetic activation of the CB pathway appears to occur through a multi-step process. For example, many regulatory elements associated with genes belonging to CB are included in cluster 1 (common to all resistant cells, Supplementary Data 3), indicating that these genes are active also in Tamoxifen- or Fulvestrant-resistant cells (Fig. 2g). Nevertheless, the rate-limiting enzymes of this pathway and their associated regulatory regions (for example, HMGCR and SQLE) are ultimately activated/
upregulated only in oestrogen-deprived LTED cells (Fig. 2g). We therefore decided to investigate whether epigenomic activation of CB involves more complex epigenetic features such as SEs.
Recent publications11,26,27have identified dense clusters of distal regulatory regions that are strongly associated with transcription and particularly susceptible to perturbation, termed SEs (Fig. 3a).
Adapting a previously published approach27, we identified a set of 710 SEs with different types of distribution across ETR cells (Supplementary Fig. 6B). Initial clustering analysis using SEs reveals that LTEDs cells share extensive epigenetic features.
Instead, MCF7F cells maintain fewer connections with parental MCF7 further demonstrating the marked effect of ERa loss (Supplementary Fig. 6C). As expected, SEs activation strongly reflects cell unique traits, for example, the SEs associated with oestrogen/oestrogen receptor target gene17EGR3 was identified only in MCF7 cells (Fig. 3a). Next, we clustered SEs to obtain 10 distinct groups using a similar approach-based on co-variance (Figs 2b and 3b and extended materials). IPA analysis of LTED- specific SE clusters (clusters 3 and 5) identified once more metabolic and signalling pathways. It must be pointed out that the acetylation of SEs was strongly associated with the expression of nearby genes, in agreement with previous findings28 (Supplementary Fig. 6D; Supplementary Data 4). Finally, we identified the TF motifs buried within peak-valley-peak structures to gain further insights into the regulatory circuitry underlying these SEs. Running IPA analysis to identify pathways coordinated by TFs that could potentially bind these SE valleys, we found that LTED-specific SE clusters 3, 5 and 6 were enriched for several metabolic nuclear receptor-driven pathways (Fig. 3c, the TFs identified include FOXO1, FOXA1, FOXA2, NR5A2 for cluster 3 and RXRG, VDR, RXRB, RXRA for cluster 5). Finally, we investigated the accessible chromatin landscape to gain more detailed insights into global changes in TF occupancy using high-depth DHS-seq29. Footprinting analysis to scan for putative binding sites using DHS-seq identifies a massive increase in SREBP1 and SREBP2, the two master regulators of cholesterol homeostasis in mammals30, in LTED cells (Fig. 3d). Significantly, SREBP1/e are also the top candidates transcriptional regulators in LTED for our RNA-seq-based analysis (see Supplementary Data 1, upstream regulators). SREBP1 activates cholesterol genes by binding their promoter after nuclear translocation in response to intracellular cues31,32. SREBP1 nuclear translocation can be inhibited using a novel series of compounds called fatostatin33. To test whether SREBP1 translocation was effectively one of the key events in CB activation, we treated MCF7 and LTED cells with fatostatin. Fatostatin treatment induced a significant reduction for several key genes in the CB pathway including the two rate-limiting enzymes HMGCR and SQLE specifically in LTED cells (Fig. 3e).
In summary, SEs and chromatin accessibility analyses further demonstrate a role for cholesterol-driven signalling centred on the potential crosstalk between nuclear receptors and cholesterol- specific TFs. These data suggest that epigenetic reprogramming might induce new transcription factor dependencies.
Epigenetic reprogramming involves larger chromatin structures.
Recent evidence suggests that SEs are regulated in the context of TADs28, with relatively insulated effects within CTCF-defined regions. TADs are physically defined genomic regions that shows cohesive gene regulation during development33. Several
10 (n = 27) 9 (n = 33) 8 (n = 38) 7 (n = 42) 6 (n = 57) 5 (n = 57) 4 (n = 58) 3 (n = 81) 2 (n = 157) 1 (n = 160) H3K27ac
Super-enhancers
LTED LTEDT LTEDF MCF7 MCF7T MCF7F
−1.5 +1.5 z-score (log2(RPKM))
0 0.5 1 1.5 2.5 2
ID1 HMGCR HMGCS1 LBR DHCR7 DHCR24 CYP51A1 ACAA1 SQLE LSS FDPS
mRNA fold changes
RT–qPCR Fatostatin treatment
MCF7 LTED CTRL 15 μM FATO
** *
*
PEBP4 EGR3
EGR3 locus: chr8:22,436,508–22,659,381
PAWR locus: chr12:79,868,240–80,072,994
LTEDT LTEDF MCF7T MCF7F LTED MCF7
LTEDT LTEDF MCF7T MCF7F LTED MCF7
PAWR
SREBPs motif in DNAseI footprints
–10*log (P value)
0 200 400 600 800
LTEDT LTEDF
LTED
MCF7T MCF7F
MCF7 LTEDT LTEDF LTED
MCF7T MCF7F
MCF7
% SREBP1/2 over top 5,000 Footprints
SREBP1 SREBP2
nSREBP motif/s5000 (%)
0 5 10 15 20 25
P<0.0001 P<0.0001
LTEDT LTEDF LTEDMCF7T MCF7F
MCF7 LTEDT LTEDFLTED
MCF7T MCF7F
MCF7
DHS-Seq
>100M reads Footprinting (P<10–20) Motif search analysis Motif Analysis
SEs Valleys
2 4 6 8
–Log (P value) 6 5 5 5
3
5 VDR/RXR activation
FXR/RXR activation FXR/RXR activation LXR/RXR activation TR/RXR activation
FXR/RXR activation
Accessible chromatin
Cluster.no. Go term
a b
c d
e
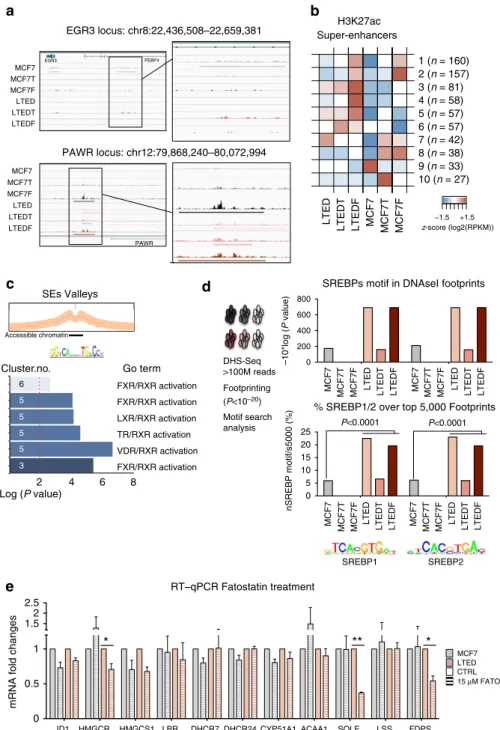
Figure 3 | Activation of super-enhancers during epigenetic reprogramming.(a) Snapshot representing SE peaks and associated raw data for two genomic locus underlying cell-type-specific phenotypes (EGR3 and PAWR). (b) Heatmaps showing the mean H3K27ac level in each cluster of SE regions for each one of the six cell lines. Total number of regions in brackets. (c) DNA motif analysis (HOMER) was carried out in the potential regulatory regions between H3K27ac-marked nucleosomes for specific clusters of SEs. Gene Ontology analysis based on potential interacting TFs is shown in the bottom panel. The vertical dashed red line indicatesP¼0.01. (d) Pipeline for the analysis of DHS-set Footprinting data sets. SREBP1 and SREBP2 footprints are uniquely enriched within the accessible chromatin landscape of LTEDs cells. The left panel indicatesPvalues from Cistrome analysis (Sitepro). The right panel displays the number of motifs within the top 5,000 footprints (expressed as a percentage). Statistical analyses were carried out using a Pearson’s w2-test. (e) Treatment with a SREBP1 inhibitor (Fatostatin) induces downregulation of key cholesterol biosynthesis transcripts specifically in LTED cells.
Error bars represent s.e.m. calculated on three independent experiments. Asterisks indicate significant statistical differences comparing treated with mock- treated cells (T-test,Po0.05).
studies indicate that TAD boundaries are generally resistant to differentiation34. We observed that in some instances, clusters of genes physically located in the same genomic region (for example, keratin locus, chr12q13.13) are differentially regulated as a single transcriptional unit (Supplementary Data 4). More specifically, the KRT locus (KRT7, KRT80, KRT81, KRT83 and KRT86) is upregulated in all resistant cells and its putative SE belongs to cluster 1 (Fig. 3b). This raises the possibility of coarse-grained epigenetic reprogramming occurring at the level of entire genomic compartments. To test this hypothesis, we sorted 2,283 TADs (previously identified in IMR90 cells33) according to the ratio of their H3K27ac levels in LTED versus MCF7 (Fig. 4a). The TAD encompassing the KRT genes (chr12:52,513,73353,913,733) ranked in the top 5%, showing a 1.42-fold increase in H3K27ac in LTED cells (Fig. 4a), confirming that epigenetic reprogramming might target sets of genes simply based on their physical proximity.
We then investigated whether analogously to KRTs, CB genes are regulated in response to coarse-grain activation of their respective SE-TAD structures. Genes in the CB pathways were found scattered over different genomic compartments with no coherent changes in H3K27ac, suggesting a TAD-independent, punctuated regulation (Fig. 4a). Thus, while some CB genes might be passively regulated in response to widespread epigenetic changes, others may be controlled by more precise epigenetic changes, often counteracting the local TAD changes. For example, at the SQLE locus the local increase in acetylation (LTED versus MCF7) substantially overshadows the modest increase in TAD acetylation (Fig. 4b, yellow arrow). Strikingly, genes such as HMGCR and CYP51A1 gain H3K27ac signals in their putative regulatory regions despite locally losing acetylation at the TAD level (Fig. 4b, black arrows). We obtained similar results when comparing global changes in RNA transcription within the TAD to the local changes for single CB genes. These data strongly suggest that CB genes activated in non-invasive cells (Fig. 2g) might be passengers of TAD-wide epigenetic activation, while rate-limiting CB genes are specifically targeted in AI-resistant cells only.
To further investigate the role of CB in AI-resistant cells, we transcriptionally profiled the entire cholesterol superpathway using reverse transcription (RT)–quantitative (q)PCR. The CB pathway is made up of 24 genes coding for enzymes necessary to build cholesterol molecules from acetyl-derived carbons (Fig. 4c;
Supplementary Fig. 7A). Strikingly, 22/24 genes in the CB superpathway are upregulated in LTED cells, while 2/24 and 3/24 are upregulated in MCF7T and MCF7F cells, respectively (Fig. 4c). To rule out cell-type-specific bias in the activation of CB, we then analysed a second ERa-positive cell lines (in T47D breast cancer cells35). In agreement with MCF7 data, we observe a marked upregulation of CB transcripts in T47D-LTED cells as compared with naive T47D (21/24, Fig. 4d). On the other hand, non-tumorigenic MCF10A have much lower mRNA levels for all CB genes compared with non-invasive T47D or MCF7 cells (average 14±11%).
To confirm the epigenetic nature of CB activation in T47D-LTED cells, we assessed the H3K27ac status of several regulatory elements comparing resistant and naive cells. In agree- ment with MCF7 ETR cells, T47D-LTED exhibit a strong increase in K27acetylaiton at enhancers associated with CB genes (Fig. 4e).
Finally, we investigated the epigenetic activation of distal enhancers associated with CB directly in clinical specimens. In agreement with our in vitro data, ChIP–qPCR analysis demon- strate a significant increase in H3K27ac signal in a biopsy derived from a metastatic deposit (AI resistant) compared wih a sample derived from a primary, drug-sensitive ERabreast cancer patient (Fig. 4g).
Altogether, these data demonstrate that the selective pressure operated by chronic drug exposure is counteracted using very
distinctive epigenetic mechanisms. More specifically, these data strongly support the centrality of CB epigenetic activation in AI- resistant cells.
CB promotes ERaactivation. ERaand other nuclear receptors can be activated by a vast array of ligands including sexual hormones (estrogens) and other cholesterol-derived compounds.
Recent evidence has shown that cholesterol derivatives such as 25 and 27 hydroxycholesterol can also promote the transcription of ERatarget genes in breast cancer cells36,37. Interestingly, 27HC can also increase metastatic invasion in mice xenografted with MCF7 cells38. We then hypothesized that one of the possible consequence of epigenetic activation of CB in AI-resistant cells might be the activation of autocrine signalling via de novo synthesis of 27HC39. To test this, we initially investigated the expression levels of CYP27A1 and CYP7B1, the two enzymes involved in the synthesis and catabolism of 27HC from cholesterol precursors39. Analogously to CB genes, CYP27A1 is significantly upregulated in LTEDs compared with MCF7 and other resistant cells (Fig. 4c). Similarly, T47D-LTED exhibited an increase in CYP27A1 compared with parental T47D cells (Fig. 4d). On the other hand, we could not identify CYP7B1 transcripts in our cells (Fig. 4c,d). CYP27A1 is highly expressed in macrophages but also in ERa-positive breast cancer cells in vivo38. For example, we could identify strong expression of CYP27A1 in two newly established ERa metastatic cell line models derived from pleural effusion of AI-resistant patients (Supplementary Fig. 7B). These data suggest that LTED cells can convert the cholesterol obtained via augmented CB into 27HC in an autocrine pattern39.
Next, we performed ChIP-seq analysis to determine whether 27HC could induce ERachromatin binding in a way similar to other well-characterized ligands such as estradiol (E2)38 and EGF40. We performed these experiments using parental MCF7, in which endogenous CB is modest compared with LTED, to increase the signal to noise ratio and get robust ERainduction.
27HC stimulation (1mM)38led to ERabinding to 5,174 regions.
Interestingly, over 70% of 27HC-ERa-binding sites were occupied by E2-ERaor EGF-ERa(Fig. 5a). Shared ERa-binding sites were enriched for H3K27Ac, H3K4me1, PBX1 and FOXA1, two TFs central to ERasignalling19and were highly accessible (as shown by DHS-seq) while depleted of repressive histone marks (K9me3 and K27me3) (Fig. 5b). Shared ERa-binding sites had over 70%
overlap with the core-ERa-binding sites foundin vivo41. We thus concluded that 27HC-bound ERacan be recruited to regulatory regions commonly associated with oestrogen signalling. In addition, we also identified a set of binding sites unique to 27HC activation (Fig. 5c). These sites appeared to be weaker and less enriched for K27ac but still under selective constraints (Phastcons method).
We then examined ERarecruitment in LTED cells cultured in the complete absence of oestrogen. We hypothesized that endogenous CB activity might be sufficient to promote ERa binding to a large set of regulatory elements. Focusing on 27HC-specific ERa-binding sites, we found that oestrogen- depleted LTED cells have a higher average ERa binding compared with MCF7 cells grown in the same conditions (Fig. 5d). When we expanded this analysis to the entire repertoire of ERa-binding sites (E2, EGF and 27HC in MCF7 plus LTED, total 51,974 regions), LTED cells still exhibited stronger genome- wide recruitment of ERa compared with their parental MCF7 cells grown in the absence of oestrogen (Fig. 5e), suggesting that CB activation might be sufficient to replace oestrogen in LTED cells. Blocking endogenous CB using Lovastatin (HMGCR inhibitor) or Terbinafine (SQLE inhibitor) induces a modest
although significant reduction in ERa recruitment at 27HC unique sites in LTED cells (Fig. 5f), further suggesting that CB contributes to cell-autonomous ERarecruitment in LTED cells.
Finally, we reasoned that epigenetic CB activation in AI- resistant LTED cells might contribute to the invasive phenotype displayed by these cells. We therefore tested the possibility of
LTED/MCF7 CB genes LTED/MCF7
TAD
RNA TAD vs gene RNA changes
Fold enrichment negative control 0 5 10 15 20
0 500 1,000
TAD (IMR90)
1,500 2,000
−1.0 0.0 1.0 2.0
Log2 ratio (H3K27ac LTED / MCF7)
KRTs TAD (chr12:52,513,733−53,913,733)
Cholesterol biosynthesis de−regulated genes TAD hyper-Ac LTED TAD hypo-ac LTED
TAD vs gene H3K27ac changes
LTED/MCF7 CB genes LTED/MCF7 TAD
K27ac
RT–qPCR MCF7
100 1–199 2–500
>501
<0.9 9–1 99–10
mRNA levels compared withMCF7 full media (%)
MCF7 MCF7T MCF7F
1 3 2 4 5 6 7 8 9 10 11 12 13 14 15 16 17 18 19 20 21 22 23 24 Acetyl
CoA Cholesterol 27 Hydroxyl
cholesterol Catabolism Cyp27A1 Cyp7B1
**
*
LTED LTEDT
LTEDF *
*
*
*Not expressed
ChIP qPCR T47D
RT-qPCR T47D T47D
T47D-LTED
1 3 2 4 5 6 7 8 9 10 11 12 13 14 15 16 17 18 19 20 21 22 23 24 Cyp27A1 Cyp7B1
ChIP qPCR clinical samples Primary Metastatic
Distal enhancers Fold enrichment negative control 0
20 40 60 80
T47D T47D-LTED
Distal enhancers CYP51A1
DHCR7 EBP
HMGCR FDPS
HMGCS1 ID1
MSMO1 MVD
MVK SQLE
–1 1 2
CYP51A1 DHCR7
EBP
HMGCR FDPS
HMGCS1 ID1
MSMO1 MVD
MVK SQLE
–1 1 3 2
SQLE SQLE
CYP51A1 ACAA1 MSMO1 HMGCR NEG. CYP51A1ACAA1 MSMO1 HMGCR
CTRL NEG.
CTRL
c
d
e b a
c
f
Figure 4 | Epigenetic activation of cholesterol biosynthesis.(a) In all, 2,283 topologically associating domains (TADs) (identified in IMR90 cells33and showing acetylation in at least one out of the six cell lines) were sorted according to the ratio of their H3K27ac levels in LTED versus MCF7. The red arrow highlights the TADs encompassing the KRT genes (chr12:52,513,73353,913,733) while the light-blue arrows highlights the TADs encompassing the deregulated genes in the cholesterol biosynthesis pathway. (b) Radar plots of global (TAD) versus local (CB genes) changes in H3K27ac and RNA transcription. Data are represented as ratios (Log2 RPKM LTED/RPKM MCF7). (c) RT–qPCR analysis of all the enzymes involved in cholesterol and 27HC biosynthesis (identifiers in Supplementary Fig. 8A). RNA fold differences were calculated comparing MCF7 with individual resistant cells averaging at least three independent experiments. All comparisons with different colours were statistically significant (T-test). (d) RT–qPCR analysis of all the enzymes involved in cholesterol and 27HC biosynthesis (identifiers in Supplementary Fig. 8A). RNA fold differences were calculated comparing T47D with individual resistant cells averaging at least three independent experiments. (e) ChIP–qPCR for H3K27ac demonstrates strong enrichment at distal regulatory regions controlling CB genes in AI-resistant T47D cells. Error bars represent s.e.m. calculated on three independent experiments. (f) ChIP–qPCR for H3K27ac demonstrates strong enrichment at distal regulatory regions controlling CB genes in metastatic clinical samples.
blocking cellular invasion by targeting CB. As expected, LTED cells tended to be more sensitive to inhibition of CB as demonstrated by their respective half-maximal inhibitory con- centration (IC50) (MCF7: 89 and 90mM, LTED: 22 and 42mM, Lovastatin and Terbinafine, respectively). More importantly, inhibition of CB or short interfering RNA-mediated depletion of SQLE was sufficient to block the invasion of AI-resistant LTED cells in 3D Matrigel assay (Fig. 6a; Supplementary Movie 5A–D).
Conversely, treatment with mevalonate (the byproduct of HMGCR) significantly increased the invasive potential of non- invasive MCF7 cells (Fig. 6b). SQLE depletion also resulted in the significant repression of several genes involved in cellular invasion (Fig. 6c). Altogether, these data strongly suggest that epigenetically activated CB contributes to the invasive phenotype exhibited by AI-resistant LTED cells.
CB serves as a biomarker in AI-treated breast cancer patients.
Our integrative analysis of breast cancer cell lines resistant to individual ETs identified epigenetic activation of CB as a poten- tially important resistance mechanism specific to AI-treated patients. We therefore investigated whether our findings had translational potential and could be used to stratify patients before endocrine treatment. We initially developed a gene signature (Supplementary Data 1) to retrospectively stratify TCGA ERa-positive breast cancer patients that expressed high or low levels of CB gene mRNA levels. We used TCGA data since it was possible to retrieve treatment information from these patients (AIn¼144, Tamoxifenn¼127). ERa-positive patients with high expression of our CB-based signature at diagnosis consistently display shorter recurrence- and metastatic-free survival and are characterized by poor survival (Supplementary Fig. 8A,B). The
0 1
–5 kb +5 kb
–5 kb +5 kb
27HC unique ERα Concatenate ERα
RPKM
0 –1,500 0.03
0 +1,5000
Distance from the centre of binding
ERa ETOH LTED ERa ETOH MCF7
Fold enrichment vs internal negative control 0 2 4 6 8 10
LTED ChIP–qPCR: ERα
Mock Lovastatin Tebinafine
B.S 1 B.S 2 B.S 3 B.S 4 B.S 5 B.S 6 B.S 8
Internal neg. control 1 Internal neg. control 2 27HC-specific ERα-binding sites
*
* *
*
* *
0 1
a
c
f
d e
b
E2 13,520 EGF 9,032
27HC 5,174
2,749 1,503
ETOH EGF E2 27HC
27HC unique ERα sites (1,503)
27HC EGF
K27 ac
E2 FoxA1 PBX1 DHSs K9
me3 K27 me3
Common ERα sites (2,749): MCF7 cells ChlP-seq: ERα MCF7 cells
K4 me1
ERα
Figure 5 | 27-Hydroxycholesterol promotes ERabinding.(a) Venn diagrams of ligand-specific ERacistromes. (b) Heatmaps showing the epigenetic features of ERa-binding sites common to all stimuli. (c) Heatmaps showing ERabinding at 27HC-specific loci. (d) Comparison between ERaChIP-seq signals from LTED (green) and MCF7 (black) grown in the absence of estrogens at 27HC-specific sites. (e) Same analysis as indfocusing on all ERa-binding sites (right panel). (e) ChIP–qPCR analysis shows reduced ERabinding at 27HC-specific ERa-binding sites upon treatment with CB pathway inhibitors (48 h treatment). Error bars represent s.e.m. calculated on three independent experiments. Asterisks indicate significant differences compared with mock-treated cells (analysis of variance, with Dunnet’st-testPo0.05).
same signature cannot be used to identify ERa-negative patients, suggesting a significant degree of specificity (Supplementary Fig. 8C). There are no significant changes in performance when correcting for luminal A or luminal B (Supplementary Fig. 9). CB can be directly upregulated in response to p53 mutations42; however, MCF7 cells are p53wt and LTED do not acquire p53 mutations. On the other hand, T47-LTED incur in significant CB activation despite T47D being already p53mut, suggesting a degree of independence between the genetic status of p53 and the activation of CB. Finally, we still observed a strong prognostic significance within the ERa-p53-mutated subpopulation, suggesting the existence of additional mechanisms (Supplementary Fig. 9).
Most importantly, our CB signature was particularly efficient in assessing overall survival in AI-treated patients but not in
Tamoxifen-treated patients (Fig. 7a) again suggesting that endocrine resistance is driven by distinct mechanisms. Examining the expression of genes involved in CB in an independent cohort (FEMARA trial43), we find that MSMO1, MVD and SQLE mRNA levels are statistically higher in patients that did not respond to neo-adjuvant (pre-surgery) AI therapy (Fig. 7b).
Overall, these data suggest that patients with high CB are less likely to benefit from AI treatment and are in substantial agreement with our in vitroresults.
SQLE is the second rate-limiting enzyme in the CB pathway and one of the genes epigenetically activated specifically in LTED cells (Figs 2g and 4b). As expected, SQLE-encoded protein is strongly upregulated in all LTED models (Fig. 7c). We therefore quantified mRNA levels for HMGCR and SQLE in an ERa breast cancer patient treated with AI for whom we had
c
0 100 50
0 100 50
CEACAM5 KRT81
*
0 100 50
0 100 50
CCND1 MYC
* * * **
qRT–PCR: LTED
a
LTED
3D Matrigel invasion assay
DRUGS: 15 μM Terbinafine 4 μM Lovastatin
DRUGS 5 Days
2 Days +
Day0 ETOH LovastatinTerbinafine
Δ=0.99±0.2 Δ=1.0±0.2 siSQLEa siSQLEb siCTRL
Δ=2.0±0.3 Δ=0.95±0.2 Δ=1.1±0.2 0 50 100
Rel. RNA levels
qRT–PCR: SQLE
* **
siSQLE 5 Days
2 Days + –
Day0
LTED
b
MCF7 Mevalonate
5 Days 2 Days +
_
Day0
3D Matrigel invasion assay
0 1 2 3
MCF7 MCF7+
mevalonate (50 μM)
Δ Area
P<0.0037 –
Δ=2.2±0.2
siSQLEb siSQLEa siCTRL
siSQLEb siSQLEa
siCTRL siCTRLsiSQLEa siSQLEb
siSQLEb siSQLEa
siCTRL siCTRLsiSQLEasiSQLEb
Figure 6 | Blocking cholesterol biosynthesis reduces cellular invasion.(a) Blocking cholesterol biosynthesis via treatment with CB inhibitors (left panel) or direct depletion of SQLE (right panel) is sufficient to arrest LTED invasion in Matrigel organoids assays. The horizontal white bar indicate a distance of 400mm.
DArea is calculated using ImageJ (area day 2/area day 0,n¼5). SQLE RNA fold changes were determined comparing two independent short interfering RNA (siRNA) (a,b) versus a non-targeting control. Bars represent the mean with the s.d. of three independent experiments. Asterisks indicate significant difference (analysis of variance (ANOVA),Po0.05). (b) Treatment with Mevalonate increases the invasive potential of MCF7 cells in 3D organoid assays.DArea is calculated using ImageJ (area day 2/area day 0).Pvalue was calculated using a Student’sT-test. (c) qRT–PCR analysis of genes involved in invasion/migration in LTED cells upon SQLE depletion. KRT81 is shown as a control. RNA fold changes were determined comparing two independent siRNAs versus a non- targeting control. Error bars represent s.e.m. calculated on three independent experiments. Asterisks indicate significant differences (ANOVA,Po0.05).
longitudinal data (RNA obtained at diagnosis, first relapse and in circulating metastatic cells from pleural effusion). In agreement with our previous finding, we found that key CB genes are progressively upregulated during cancer progression (Fig. 7d). Overall, SQLE emerged from these analyses as a novel candidate biomarker to identify AI-resistant breast cancer patients. This was further confirmed by our unbiased analysis of the entire human transcriptome. When we sorted all 22,277 probes present in the U133A gene chip according to their potential to predict relapse in a panel of 724 ERa-positive breast cancer patients treated with ET, SQLE (probe set 209218_at) ranked 1st (hazard ratio¼2.67) (Fig. 7e; Supplementary Data 5). Finally, we speculated that genetic–epigenetic interac- tions might facilitate SQLE expression in ERa-positive breast
cancer. Remarkably, SQLE is amplified in almost 10% of ERa-positive patients and overexpressed in an additional 13%44 (Supplementary Fig. 10A). SQLE amplification directly correlates with increased mRNA expression in primary tumours (Supplementary Fig. 10B). SQLE emerges also as one of the top-ranking overexpressed genes in 10 breast cancer- independent data sets (invasive ductal carcinoma (IDC) versus normal breast, Supplementary Data 6). More importantly, SQLE amplification or mRNA overexpression is sufficient to stratify outcome in ERa-positive breast cancer patients from the TCGA cohort (Supplementary Fig. 10C). Altogether, our data strongly support the prediction generated using drug-specific resistant cells and confirm a functional role for epigenetic activation of CB as a mechanism of resistance to AI therapyin vivo.
c
e
Relative mRNA expression (log2)
Responder n=36
Non-responder n=14 1
6 MVD
MSMO1 SQLE P=0.033
P=0.005
P=0.048
b
SQLE b-Actin 70 kDa
50 kDa
H.R
1 22,277
3
2
0 1
# Of probes SQLE
FOXM1
1
0.05 HER2
Hazard ratio relapse P value
P value Neoadjuvant: pretreatment
ENDOCRINE TRT/NO CHEMO N=735 Affy probes ranking based on HR
a CB signature TCGA
O.S
0 1.0
Anastrozole
n=144 HR=>100
P=0.00054
Years 8 6 4 2 0
Low High
Years 8 6 4 2 0 0 1.0
Tamoxifen
High
Low n=127
HR=5.07 P=0.1
O.S
* *
*
d Patient 1 Patient 2
0 200 400 600
0 100 300 400 200
HMGCR SQLE HMGCR SQLE
Primary Secondary Circulating
*
* * *
MYC 11
7 11
7
10 5 1
MCF7MCF7TMCF7FLTEDLTEDTLTEDF
Figure 7 | CB-guided stratification of AI-resistant patients.(a) Kaplan–Meier survival plots using averaged expression of differentially regulated enzymes (RNA-seq) involved in cholesterol biosynthesis in specific subgroups of ET-treated patients. (b) Pretreatment mRNA levels (FEMARA Trial, see text) of key enzymes can help identify AI-resistant patients.Pvalues were calculated using a Mann–WhitneyU–test. (c) Western blot analysis of SQLE and protein quantification. Error bars represent s.e.m. calculated on four independent experiments. Asterisks indicate significant difference comparing each cell type with MCF7 cells (analysis of variance,Po0.05). (d) HMGCR and SQLE mRNA levels were quantified in longitudinal samples from breast cancer patients.
mRNA was extracted from FFPE slides marked by a registered pathologist. Error bars represent s.e.m. calculated on three independent experiments.
Asterisks indicate significant differences compared with primary samples (T-test,Po0.05). (e) Manhattan plot for the prognostic potential of all human genes contained in the affy-chip U133. Both hazard ratio andPvalues are represented. Red and black dotted lines represent hazard ratio¼1 andPo0.05, respectively.