Establishment of a HTS amenable platform for the identification of compounds selectively targeting ABCB1 expressing multidrug
resistant cancer
Doctoral dissertation Szilárd Tóth
Molecular Medicine Doctoral School Semmelweis University
Supervisor: Gergely Szakács, M.D. PhD Opponents:
Antal István, PhD Bátori Sándor, PhD
Head of the Final Examination Committee:
Sára Tóth, PhD Members of the Final Examination Committee:
Tamás Mészáros, PhD András Szarka, PhD
Budapest
2018.
1
Table of contents
Abbreviations ... 4
1. Introduction ... 6
1.1. Hallmarks of cancer and therapy resistance ... 8
1.1.1. Role of mutations and plasticity of the tumor cells in drug resistance ... 8
1.1.2. Mechanisms of drug resistance and multidrug resistance (MDR) ... 10
1.1.3. Physiological role and function of ABCB1... 11
1.2. Overcoming MDR by inhibition or evasion of P-gp ... 12
1.3. Exploiting the phenomenon of collateral sensitivity ... 13
1.3.1. Experimental evaluation of collateral sensitivity of P-gp expressing MDR cancer cells ... 14
1.3.2. Examples of collateral sensitivity provoking agents from the literature ... 15
1.3.3. Systematic study revealed MDR-selective compounds from the NCI-60 Cell Line Screening assay database ... 17
1.4. In vitro cytotoxicity assays and HTS in drug development ... 21
1.4.1. In vitro cytotoxicity assays to identify MDR-selective compounds ... 21
1.4.2. Main principles of high-throughput cytotoxicity screening ... 22
1.4.3. Role of reagent-based cytotoxicity assays in HTS ... 23
1.4.4. Examples of novel, fluorescent protein based cytotoxicity assays ... 25
1.4.5. Evaluating the robustness and reproducibility of assays – Z’-factor ... 26
1.4.6. Hit identification by assays based on fluorescent protein expression ... 28
2. Objectives ... 29
3. Materials and Methods ... 30
3.1. NCI DTP database and in silico data mining ... 30
3.2. Compounds and chemicals ... 30
3.3. Cell lines and culture conditions ... 31
3.4. Cytotoxicity assays using MTT, PrestoBlue or SRB reagents ... 32
3.5. Fluorescent protein based cytotoxicity assays ... 33
3.6. Flow cytometry ... 34
3.6.1. Analysis of mCherry expressing cell line populations ... 34
3.6.2. Calcein-AM efflux assay ... 35
4. Results ... 36
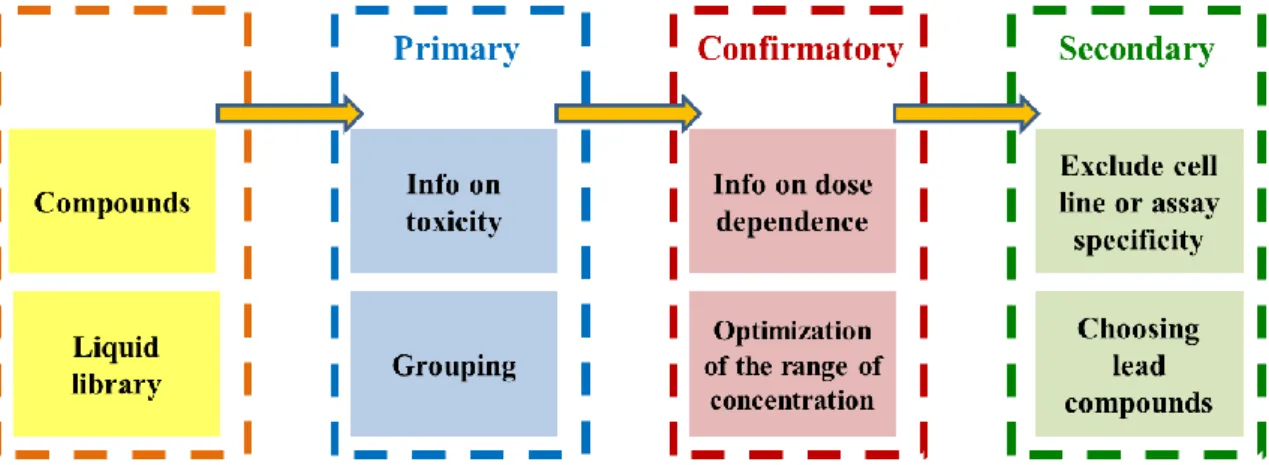
4.1. Establishing an automated cytotoxicity testing platform capable of HTS, combined with a fluorescent protein based cytotoxicity assay development ... 36
2
4.1.1. Establishing a 3-step screen to for the identification of MDR-selective
compounds ... 36
4.1.2. Utilization of fluorescent protein expressing cells in cytotoxicity testing .... 38
4.1.3. Installation of an automated screening platform to perform fluorescent protein based cytotoxicity assays on 96 and 384 well plates ... 46
4.1.3.1. Items of the screening platform ... 47
4.1.3.2. Creation of a fluorescent cell line deposit ... 47
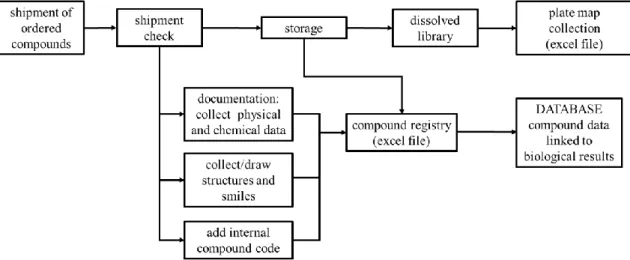
4.1.3.3. Compound registry ... 48
4.1.3.4. Automated raw data processing ... 49
4.1.3.5. Optimization of fluorescent protein based cytotoxicity screening with mCherry expressing uterine sarcoma cell lines ... 49
4.1.3.6. Uneven distribution of cells ... 51
4.1.3.7. Measuring growth and growth inhibition based on mCherry detection ... 52
4.1.3.8. Robustness of 96 well plate fluorescent assays of mCherry expressing cells ... 55
4.1.3.9. Scale down of the cytotoxicity assay volume to increase compound screening throughput ... 57
4.1.3.10. Robustnes of the fluorescent protein based assay on 384 well plates ... 61
4.1.3.11. Probing other fluorescent proteins in the cytotoxicity assay ... 62
4.2. Identification and validation of MDR-selective compounds ... 64
4.2.1. Delineating cell line specificity of compounds reported to show collateral sensitivity ... 64
4.2.1.1. Results of the additional experiments with the thiosemicarbazone Dp44mT ... 66
4.2.1.2. Results of the additional experiments with the flavonoid desmosdumotin B analogues ... 67
4.2.2. Identification of MDR-selective compounds from the DTP drug repository 69 4.2.2.1. Systematic in vitro cytotoxicity testing of the newly identified MDR- selective candidates ... 70
4.2.2.2. Investigation of the structural coherence of the MDR-selective compounds ... 74
4.3. Screening of compound libraries focusing on flavonoid, TSC and 8-OH- quinoline chemotypes to explore collateral sensitivity ... 77
4.3.1. Primary screening of the compound collection ... 77
4.3.2. Utilization of the screening platform to identify improved MDR-selective compounds of the 8-OH-Q chemotype ... 79
4.3.3 Screening and testing a TSC library against resistant cancer... 85
3
4.3.4. Screening and testing a medium sized compound library with flavonoids and
thiosemicarbazones. ... 88
4.3.5. Investigation of protoflavone compounds against MDR cancer ... 93
5. Discussion ... 98
6. Conclusions ... 109
7. Summary ... 110
Összefoglalás ... 111
8. Bibliography ... 112
9. Publication list ... 129
9.1. Publications related to the thesis ... 129
9.2. Further publications not related to the thesis ... 130
10. Acknowledgements ... 131
Supplementary Information ... 132
4
Abbreviations
1,10-phen 1,10-phenanthroline
2D 2 dimensional
2-DG 2-deoxy-glucose
8-OH-Q 8-hydroxy-quinoline
ABC ATP-binding casette
ABCB1 ATP-binding cassette sub-family B member 1 ABCC1 ATP-binding cassette sub-family C member 1 ABCG2 ATP-binding cassette sub-family G member 2
ADME-Tox absorption, distribution, metabolism, excretion, toxicity
AI activity index
API active pharmaceutical ingredient ATCC American Type Culture Collection CHO chinese hamster ovary cell line
CS collateral sensitivity
CS agent collateral sensitivity provoking agent
DMEM Dulbecco Modified Eagle’s minimal essential medium DTP Developmental Therapeutics Program of NCI
eGFP enhanced green fluorescent protein
GI50 half maximal (50 %) growth inhibitory concentration HCS high content screening
HTS high throughput screening
IC50 half maximal (50 %) inhibitory concentration
mCh mCherry
MDR multidrug resistance; multidrug resistant MDR1 multidrug resistance 1, gene of P-gp
mOr mOrange
MTT 3-(4,5-dimethylthiazol-2-yl)-2,5-diphenyltetrazolium bromide
5
NAI normalized activity index
NCE new chemical entities
NCI National Cancer Institute (of the United States)
P85 block copolymer Pluronic P85
PA protoapigenone
PAIN pan assay interference compound
PBS phosphate buffer saline
P-gp Permeability-glycoprotein, ABCB1
PSC833 valspodar
QY quantum yield
RPMI-1640 Roswell Park Memorial Institute-1640; cell culture medium
RR resistance ratio
SR selectivity ratio
SRB sulforhodamine B
TQ tariquidar
TSC thiosemicarbazone
VBL vinblastine
VCR vincristine
6
1. Introduction
Cancer is one of the leading causes of death worldwide. According to WHO, 8.8 million people died in various forms of malignant cancer in 2015. Almost half of the cancer deaths are from lung (1.69 million), liver (788 thousand), colorectal (774 thousand), stomach (754 thousand) and breast (571 thousand) cancers. Based on the factsheet of EUCAN, the most frequently diagnosed type in european countries is breast cancer, followed by colon and lung cancer for women (accounting for 48.8 % in total), and prostate cancer, followed by lung and colon cancer for men (accounting for 51.4 % in total) [1]. For females, breast cancer shows the highest death rate, while for males, lung cancer kills the most patients [2]. The mortality rate for all cancers varies from country to country, as a factor of economic level and local health care system. In Europe, based on the data collected from 2011-2013, the highest mortality rate (male and female together) was in Hungary, followed by other central european countries (Figure 1, Appendix 1) [3].
Figure 1. Mortality rate of all cancers per 100 thousand inhabitants in 2013. The highest rate was in Hungary (352.1), and the lowest rate was reported in Turkey (186.4) [3].
Cancer treatment depends on the type and the stage of the malignancy. In most cases surgical resection is needed, which is later combined by chemotherapy or radiation therapy. Another example is neoadjuvant therapy, when the usage of chemotherapeutics 186.4 – 236.8 236.9 – 249.6 249.7 – 269.7 269.8 – 291.1 291.2 – 352.1 lack of data
7
precedes surgery in order to shrink the tumor [4] [5] [6]. Besides conventional therapies, targeted therapies and immunotherapies are emerging treatment possibilities.
In the last decades, survival rates have improved, especially for breast and prostate cancers, or melanoma (Figure 2). Better outcome is due to improvements in all treatment fields. In surgery, novel techniques such as keyhole surgery or lumpectomy allow more precise interventions, and further development is expected by the introduction of the iKnife [7]. Radiotherapy is performed with more focused devices, new drugs were introduced in chemotherapy regimens, and the growing field of biological therapy provides novel, cancer specific approaches (e.g. rituximab for non-Hodgin lymphoma [8], trastuzumab for HER-2 positive breast cancer [9], or combined immunotherapeutic strategies for melanoma using interferon-α, interleukin-2 and immune checkpoint inhibitors [10]). However, there are some malignancies, where only minor improvements were observed. Tumors, such as lung or pancreatic cancers continue to show poor outcome (Figure 2).
Figure 2. Ten year relative survival (%) of selected cancers for adults in England and Wales.
Trends are between 1971-2007 [11].
8
Treatment failure is often due to the inherent or acquired resistance of the tumors, mediated by the tumor microenviroment (the stroma), or molecular changes, that can occur even in response to treatment, as tumor cells can adapt to various toxic impacts.
1.1. Hallmarks of cancer and therapy resistance
Cancer is a group of diseases consisting of over 100 different conditions. The primary distinction of cancers is based on the tissue of origin (e.g. lung cancer, breast cancer) and the cell type (e.g. carcinomas, sarcomas, adenocarcinomas) [12]. Despite the complexity of the many types of cancers, Hanahan and Weinberg defined the following 6 hallmarks that characterize all cancer types: (1) acquiring autonomous growth signals, (2) evasion of growth inhibitory signals, (3) evasion of apoptotic cell death, (4) unlimited replicative potential, (5) capability to form new blood vessels – angiogenesis – and (6) invasion and metastasis [13]. The original list of hallmarks were later completed with two enabling characteristics. Genome instability and tumor-promoting inflammation provide a permissive environment to acquire the above hallmarks. Reprogramming energy metabolism and avoiding immune destruction were defined as emerging hallmarks, as their importance in carcinogenesis is still under debate [14].
1.1.1. Role of mutations and plasticity of the tumor cells in drug resistance
Although it is not considered as a hallmark, intrinsic or acquired anticancer therapy resistance is frequently observed in all cancer types. The phenomenon of drug resistance occurs when tumor cells become insensitive to treatment. The development of cancer drug resistance is linked to DNA mutations or other metabolic changes including epigenetic events due to the plasticity of cancer cells, since these alterations serve as sources of new phenotypes during tumor progression [15] [16]. The new phenotypes emerge as a consequence of the multiple environmental pressures that compel the malignant cells to continuously change and adapt. In agreement with the Darwinian evolution model, cells, which obtained genetic mutations (or epigenetic changes) that result in growth advantage become predominant compared to neighboring cells. Clones with higher proliferation rate then expand within the tumor. Successive advantageous mutations/alterations lead to waves of clonal expansion, resulting in tumor heterogeneity [17] [18].
The consecutive mutations that accumulate and contribute to carcinogenesis are affecting
9
mainly proto-oncogenes, tumor supressor genes and DNA repair genes, sometimes called
“drivers” of cancer [12]. According to the Cancer Genome Atlas Pan-Cancer effort, where mutation patterns of 3281 tumors from 12 cancer types were thoroughly analyzed, 2 to 6 such driver mutations are sufficient for oncogenesis [19]. The analysis also identified oncogenic mutations that can occur in any type of cancer, such as the mutations of histone modifiers, but reported several tissue specific genetic alterations as well, which affect mostly transcriptional factors and transcriptional regulators. Taken together, mutations and epigenetic plasticity of the malignant cells create a heterogeneous tumor where subclones can have different DNA alterations ranging from point mutations to large chromosomal aberrations (e.g. chromosomal translocations) [20] [21] [22] [23] and abnormal DNA methylation pattern variations [24] [25]. Tumor heterogeneity has a profound clinical impact. Therapy acts as a selective pressure, and in response, the fittest – most resistant – subclones are selected to survive, which manifests in tumor relapse [26]
[27].
As an example, 5-fluorouracil (5-FU) resistance of colorectal cancer appears with the recurrence of the tumor that was initially responding well to this chemotherapeutic agent.
When mRNAs were extracted from the tumor that already became resistant to 5-FU treatment, high levels of dihydropyrimidine dehydrogenase (DPD) transcripts were found. DPD is responsible for the inactivation of 5-FU before it is converted to its active form (to fluorodeoxyuridine by thymidine phosphorylase) [28]. Moreover, amplification of the TYMS locus (thymidylate synthetase, target of the activated 5-FU) was correlated with poorer survival among patients with advanced, metastatic colorectal cancer, who were treated with 5-FU previously [29] [30] [31].
Resistance derived from tumor heterogeneity is more pronounced when targeted drugs are used, due to the highly specific targeting of certain malignant alterations. As an example, when patients with chronic myelogenous leukemia (CML) are treated with imatinib, kinase-domain mutations commonly emerge, leading to clinical drug resistance and relapse [32]. A study proved that these mutations can already be present in a tumor subpopulation at the time of diagnosis, before imatinib treatment is initiated [33]. Another example is when patients with colorectal cancer are treated with cetuximab and irinotecan, a subpopulation with p.K57T missense mutation in the MAP2K1 gene will likely outgrow in the tumor, which contributes to poor response to therapy [34].
10
1.1.2. Mechanisms of drug resistance and multidrug resistance (MDR)
The most common mechanisms that confer drug resistance to tumor cells are the (a) increased metabolic degradation of drugs, (b) keeping molecular targets at a low level, (c) increased DNA damage repair, (d) changed apoptotic pathways, (e) mutation in the target protein, (f) trapping drugs into acidic compartments, (g) alterations in the cell cycle and checkpoints and (h) the increased efflux by energy dependent transporters [15] [35].
Besides the above conventional mechanisms, cells can ‘escape’ from the treatment by epithelial-mesenchymal transition (EMT) [15], and certain micro-RNAs seem to contribute to the emergence of drug resistance as well [36].
Certain mechanisms from the above list can confer resistance to a single agent (the agent with which the treatment was conducted), while other forms provide cross-resistance to additional drugs. If cross-resistance is efficient against structurally unrelated and functionally distinct drugs, the phenotype is termed “multidrug resistance” (MDR) [37].
Overexpression of the ATP-binding cassette efflux transporters (ABC-transporters) in the plasma membrane of the malignant cells is one of the most common and effective mechanisms of MDR. The main ABC-transporters related to multidrug resistance are ABCB1 (P-glycoprotein, P-gp) [38], ABCG2 (BCRP) [39] [40] [41] and ABCC1 (MRP1) [42]. These transporters have broad substrate specificity, they can recognize and extrude a wide range of xenobiotics from the (tumor) cells, keeping low intracellular drug concentrations. Many anticancer therapeutics, either conventional (e.g. vinca-alkaloids) or targeted drugs (e.g. EGFR inhibitors) that are currently in use are subjects of transport by the ABC pumps [37]. The substrate specificity of the 3 main MDR ABC-transporters are partly overlapping, nevertheless when cultured cancer cells are treated with chemotherapeutics, the major mechanism of multidrug resistance is mediated by P- glycoprotein [35]. In addition, when mice bearing Brca1- and p53-deficient mammary tumors were treated with doxorubicin (a P-gp substrate), resistance frequently occurred and was linked to the overexpression of the P-gp ortholog Mdr1a and/or Mdr1b [43] [44].
P-gp is widely expressed also in many human cancers, including cancers of the gastrointestinal tract (small and large intestine, liver cancer, and pancreatic cancer), cancers of the hematopoietic system (myeloma, lymphoma, leukemia), cancers of the genitourinary system (kidney, ovary, testicle), and childhood cancers (neuroblastoma, fibrosarcoma) [45]. In hematological malignancies, sarcomas, breast cancer and other
11
solid cancers, the contribution of P-gp to poor chemotherapy response was demonstrated [37]. P-gp mediated (and in general ABC-transporter mediated ) MDR is still a serious obstacle in cancer therapy, as during treatment, if the fittest clones, which arise due to the selective pressures are overexpressing P-gp, the tumor will most probably stop responding to P-gp substrate chemotherapeutics.
1.1.3. Physiological role and function of ABCB1
ABC-transporters are transmembrane proteins controlling the passage of their substrates across biological membranes and barriers under normal physiological conditions. Thus, ABC-pumps play a crucial role in the distribution of their endogenous substrates (reviewed in [37]). Moreover, ABC transporters make up a complex cellular defense system responsible for the recognition and removal of environmental toxic agents [46].
Accordingly, ABCB1 [47] and ABCG2 [48] [49] proteins are expressed e.g. in the blood- brain barrier, where they protect the brain from xenobiotics. P-gp is expressed also in the liver, intestine and kidney [45] [50].
P-glycoprotein is a 170,000-dalton molecular weight phosphoglycoprotein comprised of two transmembrane domains (TMD), each containing six transmembrane helices, and two nucleotide binding domains (NBD) [51]. Extrusion of xenobiotics by P-gp from the cell is an energy-dependent action fueled by ATP hydrolysis [52].
Figure 3. Structure of P-gp, based on molecular dynamics simulation [54]. Green: lipid bilayer, red: aqueous phase. A) Inward-facing state of P-gp. B) outward-facing structure of P-gp.
12
P-gp in its drug recognition (inward facing) state allows drug binding and asymmetric occlusion of an ATP in each NBD domains. Upon drug and ATP binding, the subsequent hydrolysis of the two ATPs triggers a conformational motion, when the transition of the inward facing state to the outward facing state takes place, resulting in the release of the captured drug into the extracellular space via the pore that is formed by the TMD helices.
After drug release, P-gp returns to the inward facing state, and P-gp can start the conformational cycle again [53]. Inward-facing and outward facing states are shown in Figure 3.
1.2. Overcoming MDR by inhibition or evasion of P-gp
In vitro experiments of malignant cells showed that the relative amount of surface P-gp strongly correlates with the degree of drug resistance, and if P-gp is inhibited, MDR cancer cells regain their original sensitivity to the drugs that are subjected to transport [55] [37]. Considering that Mdr1a/b KO mice are viable and fertile [47], it was a reasonable strategy to inhibit the function of P-gp in vivo, and co-administer chemotherapeutics with the inhibitor to reverse MDR in tumor cells [56]. Unfortunately, the in vitro effectiveness of inhibitors has not translated to the clinic. Clinical trials were conducted with 3 generations of P-gp inhibitors (e.g. the first generation inhibitors cyclosporin or verapamil, PSC833 from the second generation, or tariquidar as a third generation inhibitor), but no remarkable benefit was reported, and the reasons for failure were assosiated to side effects, undesirable pharmacokinetic interactions or simply to ineffectiveness [37] [57]. Thus, novel approaches are needed to fight against MDR in cancer, which do not interfere with the role of P-gp in pharmacological barriers.
Presently, drug candidates are commonly tested to determine if there is an interaction with ABC transporters. One strategy to improve therapy response and avoid transporter mediated MDR is to design new classes of anticancer agents that simply bypass the multidrug transporters [58]. This can be achieved by modifying already existing therapeutics in a way that they are no longer recognized by the transporters (e.g. design of daunomycin [59] or camptothecin [60] analogues), or by discovering novel agents that lack MDR transporter interaction. Another advance is the encapsulation of drugs in nanoparticles or liposomes, preferably designed for targeted delivery [58]. Liposomal formulations of MDR substrate drugs have a greater potential against MDR cancer, e.g.
efflux pump based MDR in allograft bearing mice occurred less frequently, and with a
13
delayed onset– as it was demonstrated by our research group – when the effect of doxorubicin and liposomal doxorubicin treatment was compared [61]. Moreover, both overall and relapse free survival were increased remarkably when the liposomal formulation was administered. In an earlier study, conducted by Krishna and Mayer [62], when liposomal doxorubicin and the second generation P-gp inhibitor PSC833 were co- administered in P388 ascites tumor bearing mice, the tumor volume was reduced more efficiently compared to when the combination of PSC833 and free doxorubicin was used, albeit the tumor did not diminish completely.
1.3. Exploiting the phenomenon of collateral sensitivity
There is an alternative strategy against drug resistant cancer, which is substantially different from the efforts to overcome MDR by blocking transporter function, or to avoid drug extrusion by designing molecules which are not recognized by the ABC-pumps. The novel approach relies on the phenomenon called collateral sensitivity (CS), which was originally observed and described as an interesting anomaly by Szybalski and Bryson, who found compounds that provoked induced sensitivity to resistant bacteria strains [63].
They hypothesized that during isolation of strains possessing resistance to one antibacterial substance, associated characters producing higher sensitivity (hypersensitivity) to another agent might be selected. As a conclusion, they proposed to apply such compounds as selective agents alone, or in combination with other drugs to prevent the emergence of bacterial resistance. The hypothesis they claimed became well accepted, and the definition of collateral sensitivity was soon adapted for non-bacterial cases. CS was observed in insects (since 1950s, termed enhanced susceptibility [64] [65]), yeast [66] and protozoa [67] (both since the 1970s) or weeds (first report from 1987 [68]).
In cancer, the first report of collateral sensitivity is from 1951 [69], when 6- mercaptopurine resistant mouse leukemic cells were noticed to be more sensitive to methotrexate than the parental line.
Collateral sensitivity is a type of synthetic lethality, which in MDR tumor cells is linked to the cellular alterations resulting from the adaptation to cytotoxic/cytostatic drugs, and associated with vulnerabilities that were created concurrently to drug selection [70].
Accordingly, collateral sensitivity of MDR tumor cells can be exploited therapeutically in such a strategy, where multidrug resistance is considered as a trait (similarly to the
14
hallmarks of cancer) that might be targeted by new drugs. Theoretically, administration of collateral sensitivity provoking compounds have the potential to prevent MDR tumor formation by the preferential killing of MDR cells in a heterogeneous tumor population [71].
1.3.1. Experimental evaluation of collateral sensitivity of P-gp expressing MDR cancer cells
Several compounds demonstrating preferential hypertoxicity to P-gp positive cell lines were listed in a recent review [70], proving that application of drugs eliciting collateral sensitivity can be effective also against MDR cancer cells with pathological P-gp overexpression.
The compounds were identified in various in vitro cytotoxicity experiments, which served as the basis of determining their potency. A common way to evaluate the extent of collateral sensitivity is to calculate the ratio of cytotoxicity measured against the parental, P-gp negative cell line divided by the cytotoxicity measured against its multidrug resistant, P-gp positive derivative [71]. The cytotoxicity of a compound is expressed as the half-maximal inhibitory concentration (IC50) value, and their ratio is termed selectivity ratio (SR) [72]. If SR > 1, the compound is killing the MDR cells preferably over the parental line, while a SR < 1 indicates that the tested compound exerts greater toxicity towards the parental cell line, e.g. because the test compound is a P-gp substrate.
Correspondingly, higher SRs refer to more pronounced collateral sensitivity. However, selectivity ratio is not the only factor of a compound’s potency, the cytotoxicity (IC50) value is also relevant, as it can range from nanomolar to millimolar concentrations.
Moreover, the P-gp expressing MDR cells can be targeted via non-transporter related and also by P-gp mediated mechanisms. Therefore the contribution of P-gp in CS has to be clarified. As explained above, drug efflux by P-gp is a frequent form of MDR, thus P-gp mediated CS might be preferable over mechanisms related to cell line specific alterations evolved during drug selection of the cell line. There are 3 common ways to address the observed hypertoxicity of an MDR targeting drug candidate to P-gp. First, by testing the compound against additional parental and P-gp positive MDR cell line pairs, the robustness of selectivity can be investigated, and collateral sensitivity has to appear across all cell pairs, if P-gp is involved. Additionally, if a compound’s hypertoxicity towards P- gp expressing MDR cells is significantly abrogated when an ABCB1 inhibitor is co-
15
incubated in a non-toxic concentration, the observed CS is P-gp dependent (concurrently the cytotoxicity towards the parental cell line has to be unaffected). Abrogation of selectivity may be achieved also by siRNA driven P-gp knockdown [71], or by the use of a tetracycline controlled promoter, where the presence of the antibiotic suppresses the transcription of P-gp, and P-gp mediated CS of the MDR line is observed only when tetracycline is absent [73]. The third way is to apply MDR1-transfected cell lines, which are created from parental lines with MDR1 gene insertion. The MDR1 transfected resistant cell lines, in contrast to P-gp expressing MDR cell lines created with in vitro selection of parental lines in chemotherapeutics, lack other cellular changes that might have occurred during drug selection, thus cell line specificity of the experienced selective toxicity is minimal [71].
1.3.2. Examples of collateral sensitivity provoking agents from the literature
P-gp expressing MDR cancer cells are indeed targetable [70] [72]. Most of the collateral sensitivity provoking substances (CS agents) were found serendipitously, when the original aim of the research teams was to investigate cross resistance, or simply the lack of transporter mediated resistance of anticancer substances. In several cases, the observed hypersensitivity of MDR cells could be linked to certain cellular changes that cells acquired during drug selection in parallel to P-gp overexpression.
A good example for this kind of cell line specific hypertoxicity is the case of 2-deoxy-D- glucose (2-DG), which was found to kill the vinblastine resistant and P-gp overexpressing cell line KB-V1 more effectively than its parental (KB-3-1 cervix carcinoma) form [74].
2-DG provoked collateral sensitivity in 2 other KB-3-1 derived MDR cell lines, the colchicine selected KB-C1 and doxorubicin selected KB-D1, but the extent of hypertoxicity was not proportional to the level of multidrug resistance. Selective toxicity of 2-DG was first associated to the decreased expression of GLUT-1 transporter found in MDR cells, but finally it was linked to altered apoptotic pathway of resistant lines.
Another compound that originally was believed to be an MDR-selective agent is the natural product austocystin D [75]. A later study by Marks et al. has shown that austocystin D directly interacts with P-gp as a low affinity substrate, although this interaction is not responsible for its selective toxicity towards MDR cells [76]. As they explain, the observed hypertoxicity is linked to the elevated levels of the Cytochrome P450 enzyme, which activates and turns austocystin D into a DNA damaging agent upon
16
entering the cell. Thus, certain P-gp expressing MDR cells, thanks to the potential coordinated upregulation of CYP enzymes and ABC-transporters are more susceptible to austocystin D. 2-DG and austocystin D, albeit killed the investigated MDR cells preferably, are not ideal drug candidates, because their selective manner is tied to a special cellular change, which is not expected to represent resistant tumors in general.
In contrast, there are other compounds that were published to selectively kill P-gp overexpressing cells, where the selective action was mediated by the transporter. The hypertoxicity of verapamil towards MDR cells was widely studied in Chinese hamster ovary (CHO) cells. MDR cells derived either from E29 or from AuxB1 parental CHO cell lines become sensitive to verapamil after selection in vincristine or colchicine, and sensitivity was linked to the overexpression of hamster P-gp [77] [78] [79]. By using the same AuxB1 and its colchicine resistant derivative (CHRC5) hamster cell lines, Laberge et al. proved the MDR-selective toxicity of verapamil, and discovered the MDR-selective toxicity of the electron transport chain (ETC) complex I inhibitor rotenone [80]. When verapamil and rotenone were tested in the presence of PSC833 (a 2nd generation P-gp inhibitor), the preferential toxicity against MDR cells was completely abrogated. Besides hamster cell lines, verapamil was also studied in a P-gp expressing human MDR cell line K562/ADR, but it showed only a slight, 1.78 fold selectivity compared to parental K562 [81]. Two additional compounds, TritonX-100 [82] and reversin121 [83] were identified and published as MDR-selective agents against MDR CHO cells. While the hypertoxicity of TritonX-100 was demonstrated only against MDR hamster cell lines, and was found to be equally toxic to LR73 and the mouse mdr1a transfected LR73/1A CHO cell lines, reversin121 killed the human KB-V1 cell line preferably over KB-3-1.
In search for novel anticancer compounds, Nakagawa-Goto et al. tested several unique flavonoids with desmosdumotin B skeleton, and reported a striking collateral sensitivity towards the human MDR cell line KB-VIN, which is a vincristine selected derivative of the parental KB nasopharyngeal carcinoma line [84]. The most potent compounds were 6,8,8-triethyldesmosdumotin B and its 4’-Me and 4’-Et substituents, showing 222-, 460- and 320-fold selectivity, respectively. The MDR selective effect of desmosdumotins was partly sensitive to P-gp inhibition by verapamil in KB-VIN cells (however data were not shown for KB). In a later work the same group observed selective toxicity for the 3 most potent compounds also against the vincristine selected Hep3B-VIN cells over Hep3B
17
[85]. Although the difference of sensitivity between parental and MDR cell lines were much smaller, P-gp knockdown with siRNA resulted in the loss of cell proliferation blockage by the flavonoids [86]. Despite the observed P-gp mediated hypertoxicity of desmosdumotin B flavonoids towards KB-VIN and Hep3B-VIN, the authors noted that the hyperactivity of the synthesized analogues was not general against every MDR cell line, but they refer only to their unpublished data, without mentioning the name of the cell lines [84]. According to the authors the activity of these compounds is linked to single-nucleotide polymorphisms (SNPs) of the MDR1 gene, of which some can radically affect P-gp conformation, thus changing its interaction with the drugs [87].
In addition to small molecules, the block copolymer Pluronic P85 (P85) was also reported to act selectively against MDR cell lines, and the selective cell damaging effect was attributed to the function of P-gp [88] [89] [90]. P85 was proposed to be utilized to inhibit P-gp and restore the accumulation of otherwise P-gp substrate therapeutics in MDR cancer cells, but no convincing in vitro cytotoxicity tests were performed to clarify if P85 alone is a cytotoxic MDR-selective agent.
The above mentioned compounds can plausibly kill P-gp overexpressing cancer cells with a preference over their parental counterparts. However, in many studies the lack of systematic investigation of P-gp dependency of the observed collateral sensitivity leaves doubts about the role of the transporter, thus cell line specificity of the MDR-selective candidate compounds has to be delineated in later studies.
1.3.3. Systematic study revealed MDR-selective compounds from the NCI-60 Cell Line Screening assay database
The discovery that radically changed and boosted the research of anticancer collateral sensitivity, and when the list of known P-gp potentiated MDR-selective compounds was extended is tied to a systematic study, which originally meant to investigate ABC- transporter mediated cross-resistance, and intended to predict substrates of ABC- transporters [73]. The study used a publicly available database of the National Cancer Institute of the National Institute of Health (NCI of the NIH) that was created by the Developmental Therapeutics Program (DTP). Since its inception in 1955, DTP has supported the discovery of more than 40 US-licensed anti-cancer agents by providing services and resources to the academic and private-sector research communities
18
worldwide [91]. The drug discovery and development services include in vitro and in vivo screens. The so-called NCI-60 Human Tumor Cell Line Screen was initiated in 1990, and utilized 60 different human tumor cell lines to identify and characterize novel compounds with growth inhibitory effect or tumor cell line killing potency [92]. In exchange for the service, DTP collected and stored the dose response data against the 60 cell lines in a publicly available database. In 2016, the NCI announced to close the NCI-60 screen in favor of launching a new repository of cancer models that are derived from fresh patient tumor samples with known clinical history [93]. The latest database from 2016 includes the toxicity values of more than 50,000 compounds [94]. One of the great advantages of this database is that the 60 different human tumor cell lines (representing leukemia, melanoma and cancers of the lung, colon, brain, ovary, breast, prostate, and kidney cancers) are thoroughly characterized, thus toxicity patterns can be recognized and linked to specific alterations occurring in cancer types [95], such as the alterations of the quantity or quality of resistance factors.
The referred systematic study of Szakács et al. [73] analyzed a 1429 compound set whose screening data in the DTP database met a certain quality control criteria (described in [96]), including 118 compounds with known mechanism of action. To identify the compounds of the 1429 set whose toxicity was influenced by the presence of ABC- transporters, mRNA levels of all the 48 human ABC-transporters were measured and correlated to the toxicity patterns disclosed by DTP. The toxicity data is stored as growth inhibition values, thus ABC-substrates showed strong negative correlation (the higher level of mRNA of a transporter the lower grade of growth inhibition). Interestingly, when ABCB1 mRNA levels were correlated to the growth inhibition data, several compounds gave strong positive correlation coefficients, suggesting that besides conferring MDR, ABCB1 is capable to potentiate the toxicity of certain molecules. To test this paradoxical observation, which seemed to be a statistically insignificant event, the authors performed a Benjamini-Hochberg procedure [97], which estimated that only 30% of the top scoring hits were false positives, and 70 % of the compounds with strong positive coefficients are likely to be abundant of valid correlations. After consecutive in silico filtering and in vitro tests, the first compound that was validated to exert hypertoxicity in various MDR model systems was the thiosemicarbazone NSC73306 (Figure 4). Increased toxicity of NSC73306 was only observed when functional P-gp was expressed in the plasma
19
membrane, and when P-gp was blocked by inhibitors, hypersensitivity of MDR cells could be abrogated [73]. In a follow up study, the entire DTP dataset (approx. 43,000 substances) was systematically analyzed to find more MDR-selective compounds [98].
As a result, dozens of compounds showing collateral sensitivity against KB-V1 cell line (over KB-3-1) were successfully identified, of which 4 structurally distinct compounds were further investigated against additional cell lines pairs, and were found to exert robust P-gp potentiated hypertoxicity. The new MDR-selective compounds were NSC10580, NSC168468, NSC292408 and NSC713048 (Figure 4).
As thiosemicarbazones (TSCs) are known to possess a diverse biological activity profile, including anticancer and antiviral activity, as reviewed recently in [99], the identification of the P-gp potentiated MDR-selectivity exerted by NSC73306 inspired further investigations, and new analogues were synthesized and tested. Hall and co-workers disclosed a basic structure-activity relationship (SAR) study in 2 subsequent articles [100]
[101], where residues and moieties, which increased/decreased the magnitude of the P- gp mediated hypertoxicity of NSC73306 were identified. The most effective, improved TSC was ‘compound 32’ (Figure 4) showing an increased, almost 3 times higher selective toxicity compared to NSC73306.
Figure 4. Verified MDR-selective compounds NSC73306, NSC10580, NSC168468, NSC713048 and NSC292408, identified by the systematic datamining approach. Compound 32 [101] and Dp44mT are analogues of NSC73306 (TSCs), and KP772 (1,10-phenanthroline lanthanum complex) is the analogue of NSC292408.
20
A further example of the potential of the TSC scaffold against P-gp overexpressing MDR cells is Dp44mT, described by Richardson et al., which mediated MDR-selective toxicity against the P-gp positive KB-V1 cell line [102]. As subsequent research demonstrated, Dp44mT showed a P-gp inhibitor (Elacridar and PSC833) sensitive hypertoxicity to KB- V1, and also to the P-gp expressing MDR cell lines HCT-15, DMS-53 and the paclitaxel resistant 2008/P200A [103]. The collateral sensitivity elicited by Dp44mT seemed to be P-gp dependent. However, no MDR1 transfected cell lines were involved in the studies, thus the preferential MDR cell killing effect of Dp44mT cannot exclusively linked to the function of P-gp until further experiments are performed.
TSCs are not the only compounds that were identified in several independent laboratories as potential MDR-selective agents. In 2007, Heffeter and colleagues identified the preferential and P-gp mediated hypertoxicity of KP772 towards MDR cells [104]. KP772 is a complex of lanthanum and 1,10-phenanthroline (1,10-phen), which was capable to exploit the vulnerability derived from the maintenance of functional P-gp overexpression in the plasma membrane of the colchicine resistant KB-C1 cell line, and killed it with a small but significant preference over the parental KB-3-1 line. KP772 is very similar to a tin complex of 1,10-phen called NSC292408 (Figure 4), identified in the above referred systematic study as an MDR-selective compound. Moreover, as KP772 was submitted to the drug screening repository of DTP (renamed as NSC632737), it was identified in the same systematic study as a putative MDR-selective analogue of NSC292408 [98], supporting the relevance of 1,10-phenanthroline metal complexes.
The list of the compounds eliciting collateral sensitivity against P-gp expressing MDR cells is longer and more diverse, here I only introduced examples that were relevant milestones (and that are related to the present PhD thesis). The observed collateral sensitivity was tested in different ways for each compound. In some of the presented studies, the role of P-gp in the preferential toxicity was not properly delineated, and still remains to be elucidated. The reason is partly due to the fact that collateral sensitivity provoking compounds were identified only by retrospective observations in experiments conducted with drug selected cell lines, which possibly harbor other alterations besides P-gp overexpression. To overcome the problem of cancer cell specific activity, systematic studies are preferred, as seen in the two consecutive studies of Szakács et al. [73] [98].
To identify further, potent MDR-selective agents, well-designed high-throughput
21
screening of compound libraries against parental and MDR cell line pairs would be highly beneficial. Identification of novel structures and subsequent lead optimization for better candidates is still an important task.
1.4. In vitro cytotoxicity assays and HTS in drug development 1.4.1. In vitro cytotoxicity assays to identify MDR-selective compounds
In general, when the target of interest is a membrane transporter, membrane receptor, nuclear receptor or ion channel, cell-based assays are applied [105] [106]. In accordance, ABCB1-potentiated MDR-selective compounds reported in the literature so far have been identified and validated also by comparing their growth inhibitory potential against parental and MDR cell lines. This so called phenotype-based approach is required, as the exact targets of MDR-selective compounds are not known, only the function of P-gp is proven to be responsible for the observed effect (phenotype- versus target-based approaches are explained later in 1.4.2.). In vivo effects of a test compound can be predicted based on in vitro cytotoxicity assays. Thus, the cell-based approach is an important and integral step in drug discovery both for academic research and for the pharmaceutical industry. Validated compounds can be ranked based on their toxicity and/or MDR-selectivity, keeping in mind that the in vivo/clinical efficacy depends also on the ‘drug-likeness’ of the compounds [107].
There are general requirements for cytotoxicity assays. The established assay has to be pharmacologically relevant, which means, it has to be capable of identifying compounds that provoke the desired effect. It has to be reproducible across assay plates or across testing days. The assay must be robust: the quality of the assay has to be uninfluenced by the variability derived from assay methodology or perturbation introduced by the instruments. It is also important that solvents should not interfere with the assay output [108] [109]. Cost-effectiveness and safety (and the related waste management) are also taken into consideration during planning larger experiments [110].
An additional relevant feature of a cytotoxicity assay in general if it is ‘robot friendly’
[111]. When larger compound libraries are intended to be tested in a relatively short time, automated liquid handling is beneficial, and 384- or 1536-well microplates are preferred.
Thus, the assay has to be suitable for the scale down of the reaction volume to 384- or 1536-well formats without detrimental effects on the above mentioned properties, and the statistical significance of the results.
22
1.4.2. Main principles of high-throughput cytotoxicity screening
The main goal of high throughput screening (HTS) technique is to accelerate drug discovery by screening large compound libraries. HTS originates from the 1980s when automation, preparative chemistry, analytics and overall compound management reached a certain technical level allowing robust screening campaigns of good quality compound libraries [112]. Nowadays, the number of compounds tested in HTS campaigns are usually narrowed down with cheminformatics prior to in vitro tests. The in silico filtering step can be applied to remove problematic functionalities, to predict solubility and ADME-Tox properties, or to run uniqueness analysis if intellectual property issues have to be considered [107] [113].
Today HTS is a mature and validated approach to identify the chemical starting points.
There are 2 main screening types, phenotypic and target-based approaches (Figure 5).
Figure 5. Flow chart of phenotype-based and target-based drug discovery [116]. The aim of early phase drug discovery is to identify the target and the lead molecules. In the phenotype-based approach, lead molecules are obtained first, followed by target deconvolution to identify the molecular targets that underlie the observed phenotypic effects. In the target-based approach, molecular targets are identified and validated before lead discovery starts.
Analysis of 259 new FDA approved drugs from 1999 to 2008 suggested that phenotypic screening strategies were more productive in the discovery of first-in-class small- molecule drugs [114]. However, another analysis using 113 first-in-class drugs, which were FDA approved between 1999 and 2013, reported that target-based approaches yielded more drugs [115]. The apparent contradiction, as it is explained in the latter article, is partly due to the different categorization of certain screens, and the conclusion could be biased also by the chosen drug sets, e.g. the second analysis contains many kinase inhibitors, which were typically discovered by target based approaches. Whichever
23
article is closer to the answer, both screening types are important and contribute to the discovery of new therapeutics.
Selection of compounds for HTS campaigns should be well designed. Based on the source, chemical libraries can consist of natural products, semi-synthetic and synthetic compounds. If there is no known structure preference before the compound screening, researchers tend to use diversity sets with a high variety of chemical scaffolds and structures. Fragment library is used to determine biologically active compound fragments that can be fused to obtain more effective compounds (thus, second round of screening is often needed with the compounds synthesized as the combinations of the fragments). If there is already a promising chemotype, a focused library can be designed, that is well suitable also for SAR purposes and lead optimization. Historically, and for practical reasons, a compound library can be also ‘off-the-shelf’ relating to compounds that are already existing active pharmaceutical ingredients (APIs), thus compound synthesis is not necessary, and repositioning is possible [113].
There are numerous therapeutics in use that were identified through HTS. Tyrosine kinase inhibitors (e.g. gefitinib, erlotinib, sorafenib, dasatinib or lapatinib) are common examples, HTS was run in the 1990s and it took approx. 10 years for each drug to obtain FDA approval [117].
1.4.3. Role of reagent-based cytotoxicity assays in HTS
There are a plenty of reagent-based methods to determine the cytotoxicity (growth inhibition) of a compound in a 96-well plate format. However, only a part of these are sufficiently sensitive and applicable in HTS [118]. In the practice, avoiding the usage of radioactively labelled materials is highly preferred due to the extra safety risks and disposal costs. Furthermore, the simple ‘mix and measure’ liquid handling principle is preferred, while filtration, separation and washing steps are to be avoided, as they are time consuming and difficult to automate [119]. Accordingly, cell component staining dyes, such as crystal violet or sulphorhodamine B (SRB) [120] are not favorable and limited to manual or semiautomatic screening due to the multiple washing steps and volatile liquid pipetting in their protocols. Similarly, the conventional MTT assay [121]
that is probably the most broadly used viability assay, can be only augmented by automation with inevitable manual steps. Nevertheless, there are examples, when these
24
cytotoxicity assays were utilized in compound screening, for instance the NCI-60 Human Cancer Cell Line Screen (see in 1.3.3.) used the SRB assay for the identification of anticancer compounds [122].
The need for HTS facilitated the development of less laborious reagent based assays with minimized liquid handling and incubation time. For such purposes, viability reagents (measuring the activity that is attributable to cellular maintenance) proved to be the most convenient. The MTT analogue MTS [123] provides an absorbance-based assay and indicates the mitochondrial reductive capacity of the cells, as the tetrazolium salt reagent is converted to a light absorbing formazan by living cells. Alamar Blue [124] is another popular viability reagent, offering fluorescent read-out. Its fluorophore called resazurin is converted to the highly fluorescent resorufin, mostly through mitochondrial reductases, similarly to MTT. Another common technique is the bioluminescent detection of ATP using the firefly luciferase enzyme [125], which provides a sensitive way of live cell (cellular energy) measurement [110] [111]. Although all these assays are assessing cell viability, they have relevant differences, which has to be considered in cytotoxicity testing.
If reagent conversion is low (due to the small amount of viable cells), absorbance-based measurements are inherently less sensitive than the fluorescence- or luminescence-based measurements. This is because absorbance is the difference between the intensities of the emitted light and the light passing through the sample, which may be both very strong for the low concentration reagent sample and also for the control (no reagent) sample, while the emitted light – derived either from fluorescence or luminescence – can be distinguished easier from background by the detector even if the signal (reagent concentration) is low [126]. Another difference between the assays is in their deteriorative effect to cells. ATP quantification involves lysis of the cells with detergents, thus it is destructive and is considered as a typical end point assay. In contrast, MTS has minor toxicity on the cells, while resazurin based assays are not considered cytotoxic, and cells might be used later for additional measurements [110] [111]. However, longer exposure to Alamar Blue assay can hinder cell growth, as it was shown for the cisplatin resistant A2780 ovarian carcinoma cell line [127].
25
1.4.4. Examples of novel, fluorescent protein based cytotoxicity assays
The right choice of the in vitro screening assay is of paramount importance in the drug- discovery process. Reagent-based assays are popular and commonly used in research, as they are well characterized, and protocols are available and easy. However, the attractiveness of reagent-free and label-free approaches, and the technical improvement of spectrophotometers and fluorescence imaging created the possibility to quantify cytotoxicity in novel ways. Also, techniques that provide more information are preferred (e.g. high content screening) [109]. One of the novel approaches to measure cell mass is to exploit the light emitting nature of fluorescent proteins. Gene constructs of the fluorescent proteins can be inserted to host cells, allowing the establishment of fluorescent cell lines. Examples of fluorescent protein based, non-conventional cytotoxicity measurements are demonstrated in this chapter.
In a study by Steff et al. in 2001 [128] eGFP-expressing mammalian cell lines were created and cytotoxicity was determined based on the decay of the eGFP signal by flow cytometer and also by fluorescent microplate reading, as cell death was accompanied with degradation of the fluorescent protein. In the same year, a more comprehensive study was carried out. Torrance et al. [129] used 2 isogenic DLD-1 cell lines (of which one cell line had a mutant K-Ras allele) transfected with either YFP or BFP, co-cultured them, and followed their growth for 6 days by a microplate reader via daily fluorescent intensity detections. They screened the effect for the growth curves of almost 30,000 compounds, and identified a lead compound against mutant K-Ras cell line, then confirmed its effect in a xenograft tumor model. High content screening (HCS) devices are also capable to count fluorescent protein expressing cells. In 2008 Rosado et al. [130] transfected two immortalized lymphoblastic murine cell line variants with either eCFP or eYFP, co- cultured them, and tested a dozen of molecules to find selective Akt signaling inhibitors.
The measurement of differential cell survival was performed by an automated high- content microscopy system. In 2011 another dual-fluorescent based HCS study was performed, 3119 chemicals were screened against ovarian cancer cell lines [131]. One cell line of a pair was marked only with eGFP whilst the other was co-transfected with mCherry and a truncated form of the MUC16 tumor marker. After compound incubation, nucleus of the cells were stained with Hoechst, then plates were imaged and analyzed by a cellular imaging system to find MUC16 selective agents.
26
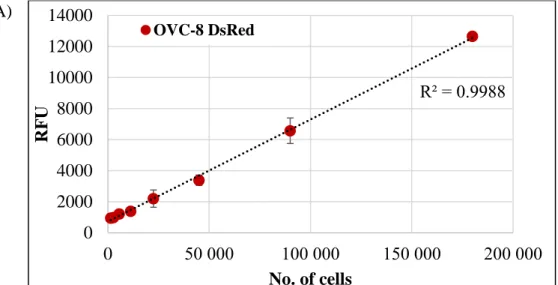
In 2009, Brimacombe et al. [132] set up a dual-fluorescent system for probing multidrug resistance in cancer. They used the OVCAR-8 (parental) and NCI/ADR-RES (MDR phenotype) cell line pair from the NCI-60 cell panel, transfected with DsRed2 and eGFP, respectively. To avoid the extra nucleus staining steps, required for image based evaluations, co-cultured cells were investigated with a fluorescent laser scanning microplate cytometer, and evaluation was based on eGFP and DsRed2 intensities only.
The same type of device was used in 2015 in the study of Kenny et al. [133] to screen the Prestwick Chemical Library (1140 compounds) and the Library of Pharmacologically Active Compounds (LOPAC1280) to identify drugs preventing adhesion, invasion and growth of ovarium carcinoma cell lines. Tumor cells expressing eGFP were seeded (simultaneously with test compounds) in a well where a multilayered culture containing primary human fibroblasts, mesothelial cells and extracellular matrix were already present. After 16 h incubation, consecutive cell fixation and washing steps, fluorescent cell counting was carried out, then hits were identified and taken for subsequent investigations. The most promising compounds were validated against ovarium cancer cells also in 4 different in vivo models.
These examples show how fluorescent proteins can be used in hit and lead validation by cytotoxicity measurements in various ways, as appropriate alternatives to reagent based assays. Moreover, as apparent from some of the above examples, screening of larger compound libraries can be designed to rely on the fluorescent protein expression as a measure of growth inhibition. Cell fixation and consecutive nuclear staining had to be performed in some of the studies, because imaging software programs usually require it to distinguish (and count) cells. Therefore, washing steps could not be avoided in all cases, while other studies could perform a reagent-free assay procedure, which was beneficial in the aspect of automation. The utilization of fluorescent proteins provides additional benefits. Co-culturing of isogenic cell line pairs, which are different only in their fluorescent color can reduce the cost of culturing materials by multiplexing techniques, moreover cell lines in a well grow (obviously) under the same conditions.
1.4.5. Evaluating the robustness and reproducibility of assays – Z’-factor
Standardization is important in every part of the screening assay set-up, starting from the supply and maintenance of cells and other aspects of the tissue culture procedure, the quality of the tissue culture/detection plates used, the hardware, software and data
27
management [110]. During assay development and optimization, statistical analysis of the measured data is monitored to track the assay quality. The analysis is based on statistical parameters such as the mean or deviation of the measured signals. Developers can use for instance the coefficient of variation (CV, which is the standard deviation normalized by the mean value) or the signal to noise ratio (SNR) to amend the assay performance. In addition, there is a more complex quality metrics, that is often used for small-molecule high throughput screens, called the screening window coefficient or Z’- factor [134]. Z’-analysis, which determines the robustness of the assay integrates a number of external and internal impacts. It measures the assay resolution, which is influenced by many factors, e.g. by the assay procedure, or by the instrumentation that was used. By definition Z’-factor is a number that is ≤ 1 and the intervals of Z’-factor designate the usability of the investigated assay (Table 1).
Table 1. Assay quality regarding to Z’-factor values [134].
Z’-factor value Related to screening Assay type
1 An ideal assay Dose-response acquisition is possible 1 > Z ≥ 0.5 An excellent assay Dose-response acquisition is possible 0.5 > Z > 0 A double assay More suitable for primary screening
0 A "yes/no" type assay Primary screening
< 0 Screening essentially impossible
Formula of Z’-factor:
Z’-factor = [|μneg – μpos| - 3(σneg + σpos)]/|μneg – μpos| = 1 – [3(σneg + σpos)/|μneg – μpos|], where μpos/μneg are the mean of positive/negative controls and σpos/σneg are the standard deviation of positive/negative controls. Components of the formula of Z’-factor are visualized on Figure 6.
Based on Table 1, screens with a simple yes/no answer as an output are acceptable if the Z’-factor is above 0. To be able to obtain dose-response curves, better quality assays have to be used, where the Z’-factor is above 0.5. As apparent from the formula and from Figure 6, Z’-factor reports the proportion of the assay dynamic range that is not overlapping with either the positive or negative controls’ data variability band (which
28
cover 99.7 % of all the possible positive and negative control signals if normal distribution is assumed). For example a Z’-factor of 0.6 reports from an assay where 60 % of the assay dynamic range is not overlapping with the data variability bands.
Accordingly, robust measurements have wider separation band size, while overlapping data variability bands of positive and negative controls would refer to unreliable assays.
Nevertheless, if there are a few extreme values (outliers) in either the positive or negative controls, standard deviation will increase and it can affect the Z’-factor, potentially leading to an apparently unfavorable Z’-value, even when the assay would perform well [135].
Figure 6. Graphical definition of Z’-factor. Z’-factor calculation is based on the measured mean and deviation of the positive and negative controls, which return the lowest and highest values that can possibly be measured. Z’-factor is the ratio of the separation band and the assay dynamic range. (The formula consist the assay dynamic range in an absolute value as depending on the assay type, either positive or negative controls can return the highest/lowest possible signal.)
1.4.6. Hit identification by assays based on fluorescent protein expression
Besides finding the active substances from a screen, exclusion of false positive hits (not truly active substances) and false negative hits (missed active substances) are also part of the hit identification process. While with an appropriate Z’-factor it is possible to keep the number of false hits low, there are assay specific factors, which can disturb the integrity of the data. In the case of fluorescent protein expressing cell lines, disturbance of compound screening might derive from unspecific gene expression change due to the applied DNA transfection procedures, or from the usage of inherently fluorescent compounds. Thus, it is advisable to use a counter assay in the follow-up studies for at least the best hit compounds, and when possible, to use repeats during the screen [136]
[137] [138].
29
2. Objectives
Overcoming P-gp-mediated cancer multidrug resistance is still a serious obstacle. A possible solution could be the application of so called MDR-selective agents, which target P-gp overexpressing tumor cells. However, proof-of-concept in vivo studies are still missing, the attempts reported inactivity of compounds, which is plausibly due to the unfavorable pharmacokinetics and the low MDR-selectivity of the tested agents. Thus, our overall aim was to establish a screening platform for the robust and high throughput identification of MDR-selective compounds at the scale of an academic research group, to find drug-like candidates for iterative lead optimization. Identification of novel MDR- selective compounds would broaden our knowledge on the nature of the P-gp potentiated MDR-selective mechanism, which would supply SAR models intended to predict even more potent, pharmacologically active candidates.
Objective #1. Establishment of a standardized cytotoxicity testing system amenable for high throughput screening of compound libraries
#1A. Design of a 3-step compound screening system including primary, confirmatory and secondary screening.
#1B. Introduction of a reagent free, fluorescent protein based cytotoxicity assay measuring growth inhibition.
#1C. Robotization of the screening procedure and automated data evaluation implemented for both 96 well and 384 well plate experiments to increase compound throughput.
Objective #2. Identification and validation of MDR-selective compounds guided by literature data
#2A. Verifying the putative MDR-selective toxicity of compounds reported to preferentially kill P-gp overexpressing MDR cell lines.
#2B. Systematic identification of novel MDR-selective compounds from the NCI DTP drug repository database.
#2C. Defining chemotypes linked to MDR-selective cytotoxicity, based on #2A and #2B.
Objective #3. Screening of focused libraries designed to investigate the chemical space around MDR-selective chemotypes
30
3. Materials and Methods
3.1. NCI DTP database and in silico data mining
The in silico data mining was performed using the NCI-60 Cell Line Screen database released in December, 2010, which is available at the DTP website [94]. The algorithm we used was the same that our group used before on an earlier release [73] [98]. Briefly, we determined the Pearson’s coefficient between the pGI50 values of each DTP chemical entity measured against the NCI-60 cell line panel and the mRNA expression of ABCB1 of the NCI-60 cell lines. We filtered out uninformative drug profiles, where >50% of the 60 possible values were either missing or indicated inactivity, and collected the in silico hits with a coefficient higher than 0.4, thus when high drug sensitivity was accompanied with high ABCB1 expression, which is characteristic of the P-gp mediated MDR- selective compounds.
3.2. Compounds and chemicals
Unless otherwise stated, chemicals were purchased from Sigma Aldrich (Merck). NSC compounds were acquired from DTP's drug repository, except NSC733435, which was purchased from ChemBridge Corp. Desmosdumotin analogues were synthesized by Szintekon Ltd. Pluronic P85 was a kind gift from Dr. R. Mészáros (ELTE University, Hungary). Tariquidar was a kind gift from Dr. S. Bates (NCI, NIH). KP772 was synthesized by our colleague, Veronika F.S. Pape as described by Hart and Laming with slight modifications [139]. Compounds of the protoflavone library was synthesized and provided by the group of Dr. Attila Hunyadi (SZTE, GYTK, Szeged). Compounds of the library containing flavonoids and thiosemicarbazones were synthesized and provided by Ahcène Boumendjel (Univ. Grenoble Alpes, Département de Pharmacochimie Moléculaire, France). Library of the thiosemicarbazones and their analogues was designed by Veronika F.S. Pape, who also synthesized several substances of the library, while other compounds were either obtained from DTP or were purchased from commercial sources.
Dissolved compounds of the liquid library were stored in 1.1 ml tubes in 96 position racks, where tubes could be collected for the experiments individually, while mother plates (96 well polypropylene trays) had fixed layouts with 36 compounds in 2 concentrations per plate in 100 μl.
31
Structure of compounds were sketched by Marvin (ChemAxon Ltd.). 2D structural clustering was performed with PubChem’s Chemical Structure Clustering Tool [140], which uses the Single Linkage algorithm, and draws the dendograms based on the 2D Tanimoto similarity index.
3.3. Cell lines and culture conditions
The following cell lines were used in the experiments:
MES-SA uterine sarcoma cell line and its doxorubicin selected derivative MES- SA/Dx5 (referred only as Dx5 from here) were purchased from ATCC. MES-SA mCherry and Dx5 mCherry cell lines were created using lentiviral transduction by Creative Cell Ltd., Budapest. Cells that were expressing mCherry stably were sorted with a Beckton Dickinson FACS Aria cell sorter.
A431 human skin-derived, epidermoid carcinoma cell line was purchased from ATCC. The retrovirally transduced A431-B1 and A431-G2 cells were established earlier [141] [142].
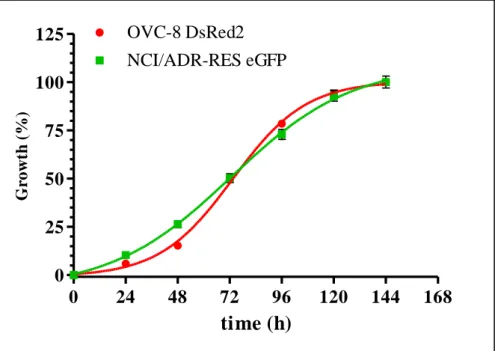
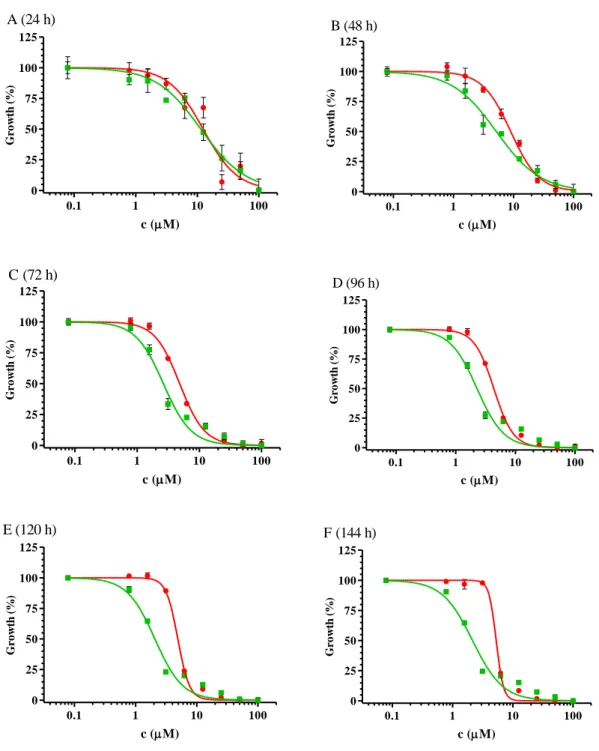
OVCAR-8 (OVC-8) DsRed2 and NCI/ADR-RES eGFP ovarium carcinoma cell lines were a kind gift from Dr. Michael M. Gottesman (National Institutes of Health, US). The respective expression vectors encoding the fluorescent proteins DsRed2 and eGFP were transfected by Lipofectamin2000 reagent.
KB-3-1 cervix carcinoma cell line and its vinblastine selected derivative KB-V1 were a gift from Dr. Michael M. Gottesman (National Institutes of Health, US).
MDCK II (Madin-Darby canine kidney cell line) was obtained from ATCC. MDCK II B1 cell line stably expressing the human wild-type ABCB1 was created by the Sleeping Beauty transposon-based gene delivery system, using the 100 × hyperactive SB transposase [143].
HCT-15 cell line was obtained from DTP (DCTD Tumor Repository, National Cancer Institute at Frederick, US).
KB (nasopharyngeal carcinoma) and KB-VIN (vincristine-resistant KB subline) cell lines were a generous gift of Dr. Y.-C. Cheng, Yale University, US.
DMS 114 small cell lung carcinoma and the nintedanib resistant DMS 114-NIN cells were granted by Dr. Walter Berger (Medical University of Vienna) for the experiments.
![Figure 3. Structure of P-gp, based on molecular dynamics simulation [54]. Green: lipid bilayer, red: aqueous phase](https://thumb-eu.123doks.com/thumbv2/9dokorg/1365232.111447/12.892.141.745.738.1069/figure-structure-molecular-dynamics-simulation-green-bilayer-aqueous.webp)