glutathione system and its regulatory genes by zeolite
BENJ AMIN K OVESI €
1, SZABINA KULCS AR
1,3,
M ATY AS CSERH ATI
2, M ARTA ERD ELYI
1, ZSOLT ANCSIN
1, ERIKA Z ANDOKI
3, MIKL OS M EZES
1,3pand
KRISZTI AN BALOGH
1,31Department of Nutrition, Szent Istvan University, Pater K. u. 1, H-2103 G€od€oll}o, Hungary
2Department of Environmental Safety and Ecotoxicology, Szent Istvan University, G€od€oll}o, Hungary
3MTA-KE-SZIE Mycotoxins in the Food Chain Research Group, Kaposvar University, Kaposvar, Hungary
Received: 20 October 2020 • Accepted: 11 January 2021 Published online: 24 March 2021
ABSTRACT
The purpose of the present study was to use oxidative stress markers for investigating the effect of zeolite (315 mg/kg of complete feed) in the case of aflatoxin B1contamination (92mg/kg complete feed).
In a 21-day feeding trial with broiler chickens, oxidative stress parameters such as conjugated dienes, conjugated trienes, malondialdehyde, reduced glutathione content and glutathione peroxidase activity were not changed significantly by supplementation with this mycotoxin absorbent. The relative gene expression of transcription factorsKEAP1andNRF2was not modified by the absorbent either. Still, the expression of GSS, GSR and GPX4 genes increased significantly due to the aluminosilicate supple- mentation. The results suggest that zeolite reduced lipid peroxidation in the blood plasma but not in the red blood cell haemolysate or the kidney. The relative expression of the genes encoding the glutathione redox system also changed as a result of zeolite supplementation, but these changes were not found at the protein level.
KEYWORDS
aflatoxin B1, glutathione redox system, broiler chickens, lipid peroxidation, gene expression, zeolite
INTRODUCTION
Aflatoxins (AFs), produced primarily by Aspergillus flavus and Aspergillus parasiticus, are unavoidable natural contaminants of feedstuffs and basic foods (Abrar et al., 2013). The most important AF in terms of toxic potency and occurrence is aflatoxin B1 (AFB1), which is mutagenic and carcinogenic to both humans and livestock and is classified as a Group I human carcinogen (IARC, 2002). Aflatoxin contamination in complete feeds in Europe showed high variation during the last decade. Between 2006 and 2007, the rate of AFB1- positive feed samples was 8%, with 47
m
g/kg as mean and 311m
g/kg as highest contamination (Binder et al., 2007). Between 2009 and 2011, the rate of AFB1-positive feed samples was 24.5%, with 3.5m
g/kg being the mean and 52m
g/kg the highest values (Rodrigues and Naehrer, 2012). In 2019, the rate of samples positive for AFB1was 8%, with 10m
g/kg as the mean and 237m
g/kg as the highest concentrations (BIOMIN, 2020).Poultry are sensitive to AF (Fink-Gremmels, 1999); however, the sensitivity to the acute effects of AFB1, expressed as LD50values, ranges from 0.4 mg/kg in day-old ducklings to 6.8 mg/kg in day-old chicks (Diaz and Murcia, 2019). The adverse effects caused by the
Acta Veterinaria Hungarica
69 (2021) 1, 23–30 DOI:
10.1556/004.2021.00002
© 2021 The Author(s)
RESEARCH ARTICLE
pCorresponding author. Tel.:þ36 28 410 735; fax:þ36 28 410 804.
E-mail:Mezes.Miklos@szie.hu
consumption of AFB1-contaminated feed include a reduc- tion in feed utilisation and efficiency, reduced growth rate, and changes in body and organ weights (Han et al., 2008).
Sirajudeen et al. (2011)reported that AFB1induced liver cell injury and increased peroxidation in the liver and kidney of chickens, accompanied by a significant decrease in total antioxidant capacity.
After entering the body, AFB1 is metabolised by the CYP450 enzyme system into a highly unstable AFB1-exo- 8,9-epoxide (AFBO) molecule which reacts with cellular macromolecules, including DNA, RNA, proteins and phos- pholipids, thus inducing various genetic, metabolic, signal- ling, and cell structure disruptions (Zhuang et al., 2016;
Rushing and Selim, 2017). Nevertheless, increasing evidence shows that the toxicity of AFB1 is due to the induction of reactive oxygen species (ROS) generation, which causes oxidative stress (Marin and Taranu, 2012). Although it re- mains unknown whether the mycotoxins promote lipid peroxidation directly through the enhancement of ROS formation or the enhancement of tissue sensitivity to per- oxidation results from compromised antioxidant defence, it appears that both processes are present in parallel (Yilmaz et al., 2017). Lipid peroxidation products have a long half- life; thus, they can diffuse into the lipid bilayer of mem- branes and cause oxidative damage even in cells far from their site of formation (Shen et al., 1994). However, our previous study revealed that aflatoxin B1 has no time- or dose-dependent effect on oxidative stress parameters and on the relative expression of genes encoding enzymes of the glutathione redox system in chicken liver. Conjugated dienes (CD) and conjugated trienes (CT), acting as markers of lipid peroxidation, showed higher values in chickens fed 182
m
gAFB1/kg of diet, while the amounts of thiobarbituric acid reactive substances (TBARS) were increased after feeding 17
m
g AFB1/kg of diet. Glutathione content was lower at day 14 in the group fed an AFB1-contaminated (92m
g/kg) feed.Glutathione peroxidase 4 activity was increased at days 7 and 21 in the 92
m
g AFB1/kg of diet group but decreased at day 14 in groups fed contaminated diets with 92 or 182m
gAFB1 levels per kg of feed. The GPX4 gene was down- regulated at day 7 in the 92
m
g/kg of feed group, but over- regulated at days 14 and 21 in the 182m
g AFB1/kg of feed group. Expression of theGSSgene was downregulated at day 14 in the 17m
g AFB1/kg of feed group but overregulated at day 21 in chickens fed 17 and 92m
g AFB1/kg of feed.Expression of the GSR gene was downregulated at days 7 and 21 in all treatment groups, but on day 14 an induction was observed in the group fed 182
m
g AFB1/kg of feed (K€ovesi et al., 2020).The activities of antioxidant enzymes, such as gluta- thione peroxidase (GPx), decreased as an effect of AFB1 exposure, which can be explained by the conversion of free radicals into less harmful or harmless metabolites. Simul- taneously, the amount of co-substrate, in this case reduced glutathione (GSH), also decreased, which might have resulted in lower enzyme activity, too (Kodama et al., 1990).
Malondialdehyde (MDA) is a significant meta-stable end product of lipid peroxidation, which is formed via the
degeneration of certain primary and secondary lipid per- oxidation products (Janero, 1990). A high MDA level was found in the liver and kidney of chicks given 150–300
m
g/kgof feed AFB1 for 21 days (Ozen et al., 2009). In another study with chickens given 300
m
g/kg of feed AFB1 for 21 days, increased levels of MDA and decreased levels of GSH were found in the liver and kidney (Karaman et al., 2010).Numerous feed additives are proposed for use against the toxic effects of aflatoxin B1 (Fouad et al., 2019). Among them, mycotoxin absorbents, such as charcoal (Yamauchi et al., 2014), zeolite and bentonite (Prasai et al., 2018) and calcium aluminosilicates (Chen et al., 2014) can prevent the absorption of aflatoxins from the gastrointestinal tract and their entry to the liver. Aluminosilicates, hydrated sodium calcium silicates, or yeast cell wall-derived glucomannan can prevent the adverse effects of aflatoxin B1in broiler chicken, including impairment of the production traits and some clinical and biochemical parameters of the blood plasma (Nazarizadeh and Pourreza, 2019). Several previous re- searches demonstrated the effect of different adsorbents on the level of ROS or lipid peroxidation parameters, such as MDA. For instance, aluminosilicate (bentonite) significantly decreased the ROS level in Japanese quail, as measured by 20-70-dichlorofluorescein assay, or MDA content in the liver and blood serum in a long-term (20-day) feeding trial with aflatoxin-contaminated feed (Migliorini et al., 2017).
The aim of this study was to investigate the effect of zeolite as mycotoxin absorbent on the changes of some lipid peroxidation and glutathione redox markers and on the relative expression of the GPX4 gene and several transcription factors of GSH synthesis as well as gluta- thione disulphide (GSSG) reduction, caused by aflatoxin B1
exposure. We hypothesised that aflatoxin B1 induces oxidative stress and, on the other hand, activates the antioxidant defence. These changes may be affected by feed supplementation with a mycotoxin absorbent, which was zeolite in this study.
MATERIALS AND METHODS
Birds and experimental design
A total of 60 Cobb 540 broilers were obtained from a commercial hatchery and were kept on deep litter with a natural light regimen (12 L/12 D). Chickens were randomly allocated to three experimental groups (control, AFB1 and AFB1 þzeolite (ZE);n 5 20 in each), resulting in similar average body weights. The experiment was started at 21 days of age, and the experimental diets were fed for 21 days.
The basal diet was a commercial chicken grower complete feed (Vitafort Ltd., Dabas, Hungary) without mycotoxin sequesters and coccidiostats. The basal diet contained afla- toxins at levels lower than the limit of quantification (LOQ) (0.1
m
g/kg for AFB1, 0.2m
g/kg for AFB2, 0.5m
g/kg for AFG1 and 0.5m
g/kg for AFG2). The nutrient content of the diet met the requirements for broiler chickens (Hungarian Feed Code, 2014). Before starting the feeding of experimentaldiets, feed deprivation of 12 h was applied. The mycotoxin absorbent was aluminosilicate (zeolite) containing 62% cli- noptilolite and 15% mordenite. The zeolite content of the diet was 315 mg/kg. The amount of zeolite selected was based on a previous study, which suggested that adverse effects can be found at high levels (5–10 mg/kg of feed), but none of the studies showed changes in the antioxidant status of the animals (Elliott et al., 2020).
Production of mycotoxin, artificial mycotoxin contamination of the feed and determination of mycotoxin content in feeds
AFs were produced by anAspergillusflavusstrain isolated by Dobolyi et al. (2013)on artificially infected corn substrate.
The strain was identified and deposited in the Microbio- logical Collection of the University of Szeged (SZMC) with the accession number SZMC 20750. The measured AFB1 concentration of the mould-infected corn substrate was 4.694 mg/kg of dry matter.
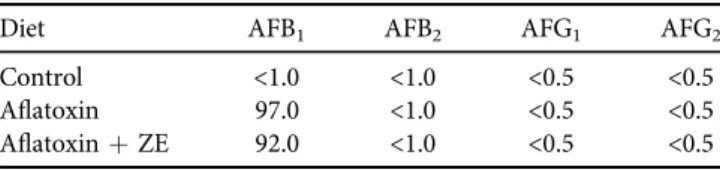
An appropriate amount of corn substrate containing AFs was mixed with the basal diet. The measured AF content of the diets is given in Table 1. The aflatoxin contamination level was calculated as the median of mean and highest values from the last decade in feed commod- ities in Europe, as it was previously mentioned, namely 47
m
g/kg mean and 311m
g/kg highest (Binder et al., 2007), 3.5m
g/kg mean and 52m
g/kg highest (Rodrigues and Naehrer, 2012) and 10m
g/kg mean and 237m
g/kg highest (BIOMIN, 2020).The AF content of the inoculate and the experimentally contaminated feeds was determined from three replicate samples (20 g each), which were taken from five different points of the batch (10 g each) and thoroughly homogenised before preparing the analytical samples. The samples were analysed after extraction with acetonitrile: water (9:1, v/v), immunoaffinity clean-up was done with Aflaprep®column (R-Biopharm, Darmstadt, Germany) and after reversed-
phase isocratic (acetonitrile: methanol: water; 8:27:65, v/v/v) HPLC method with fluorescence detection (Khayoon et al., 2010). The LOQ of the determination was 1.0
m
g/kg forAFB1, 1.0
m
g/kg for AFB2, 0.5m
g/kg for AFG1and 0.5m
g/kgfor AFG2.
Measurement of feed intake and mortality
Feed intake was measured daily in each group, and the average daily aflatoxin intake was calculated based on the AFB1 content of the feed. Mortality was checked daily in each experimental group.
Sampling and determination of lipid peroxidation and antioxidant parameters
At the start of the experiment, two birds each were taken out from each group. These six randomly selected birds were euthanised and served as absolute control (day 0). On days 7, 14 and 21 of mycotoxin exposure, 6 birds from each group were sampled. The birds were euthanised by cervical dislo- cation. Whole blood was collected on ice and, post mortem, liver and kidney were removed and collected on ice. The blood plasma was separated by centrifugation (2,500 g, 10 min), and red blood cells were haemolysed with a nine-fold volume of redistilled water. All samples were stored at70 8C until analysed. For gene expression studies, portions of the liver were frozen in liquid nitrogen immediately after sampling and stored at 70 8C until analysis to prevent RNA degradation.
The markers of lipid peroxidation (CD, CT and MDA), as well as the concentration of GSH and the activity of GPx, were determined from blood plasma, red blood cell hae- molysates, liver and kidney samples as described in our previous study (Balogh et al., 2019).
RNA isolation, reverse transcription and qPCR
RNA isolation, reverse transcription and qPCR measure- ments were performed as described previously (K€ovesi et al., 2019). Briefly, total RNA extraction was performed with Nucleozol Reagent (Macherey-Nagel, Duren, Germany)€ from 10 mg liver tissue homogenate based on the in- structions of the manufacturer. RNA samples were treated with DNase I (Thermo Fisher Scientific, San Jose, CA, USA) to avoid genomic DNA contamination. Agarose gel elec- trophoresis was performed to check the quality and integrity of RNA, and the absorption ratio of 260:280 nm higher than Table 1.Aflatoxin content of the experimental diets (mg/kg)
Diet AFB1 AFB2 AFG1 AFG2
Control <1.0 <1.0 <0.5 <0.5
Aflatoxin 97.0 <1.0 <0.5 <0.5
AflatoxinþZE 92.0 <1.0 <0.5 <0.5 ZE: zeolite.
Table 2.Primers of target (GPX4,GPX3,GSS,GSR,NRF2,KEAP1) and endogenous housekeeping (GAPDH) genes
Gene Forward (5030) Reverse (5030) GenBank accession number
GAPDH TGACCTGCCGTCTGGAGAAA TGTGTATCCTAGGATGCCCTTCAG NM_204305.1
KEAP1 CATCGGCATCGCCAACTT TGAAGAACTCCTCCTGCTTGGA XM_025145847.1
NRF2 TTTTCGCAGAGCACAGATAC GGAGAAGCCTCATTGTCATC NM_205117.1
GPX4 AGTGCCATCAAGTGGAACTTCAC TTCAAGGCAGGCCGTCAT NM_001346448.1
GSS GTACTCACTGGATGTGGGTGAAGA CGGCTCGATCTTGTCCATCAG XM_425692.6
GSR CCACCAGAAAGGGGATCTACG ACAGAGATGGCTTCATCTTCAGTG XM_015276627.2
2.0 was accepted. cDNA production was implemented with RevertAID Reverse transcriptase (Thermo Fisher Scientific, San Jose, CA, USA) based on a standard protocol.
The primers (Table 2) used for the quantification of relative mRNA transcription ofGPX4,GSS,GSR, Kelch-like ECH-Associated Protein 1 (KEAP1), and Nuclear Factor Erythroid 2 p45-Related Factor 2 (NRF2), and the house- keeping gene glyceraldehyde 3-phosphate dehydrogenase (GAPDH) were as described previously (Balogh et al., 2019).
GAPDHcan be used as a housekeeping gene because some previous studies with mycotoxins in broiler chickens (Yarru et al., 2009; Salem et al., 2018) did not show an effect on its relative expression in oxidative stress.
The threshold cycle (Ct) of the target genes (NRF2, KEAP1, GPX4, GSS and GSR) and the endogenous house- keeping control gene (GADPH) was determined by StepO- neÔ/StepOnePlusÔSoftware v2.2 (Thermo Fisher Scientific, San Jose, CA, USA). The delta Ct values (ΔCt), delta-delta Ct values (ΔΔCt) and relative quantification (RQ 5 2ΔΔCt) values were calculated by the formula described byLivak and Schmittgen (2001).
Statistical analyses
The normality of distribution was confirmed by the Sha- piro–Wilk test, and homogeneity of variance was tested with Bartlett and Browne–Forsythe tests. Data with these condi- tions were analysed by one-way ANOVA. The significance of differences between groups was evaluated using apost-hoc Tukey test (P < 0.05). Analyses were performed with GraphPad Prism 7.0 (GraphPad Software, San Diego, CA, USA). All data are presented as mean±standard deviation (SD).
Ethical issues
The experiment was carried out in conformity with the Hungarian Animal Protection Act and according to the relevant EU rules. The experimental protocol was authorised by the Department of Food Chain Safety, Land Register, Plant and Soil Protection, and Forestry of the Pest County Government Office (Hungary) with the permission number PE/EA/1964-7/2017.
RESULTS
There were no clinical signs of toxicity and mortality in the trial. The average daily AFB1intake calculated from the feed intake was nearly the same in the groups fed aflatoxin- contaminated or aflatoxin-contaminated and mycotoxin absorbent containing diets (Table 3).
Markers of the initial phase of lipid peroxidation, CD and CT did not change significantly in the liver as an effect of the treatments (data not shown). The termination marker of lipid peroxidation processes, TBARS expressed as MDA, was significantly lower in the blood plasma on day 7 but significantly higher on days 14 and 21 of AFB1treatment as compared to the control. On the 21st day of exposure, the MDA level was significantly lower in the AFB1þmycotoxin adsorbent group than in the AFB1-treated one (Table 4). As the effect of AFB1treatment, MDA content in red blood cell haemolysates showed significantly lower values on day 21 than in the control and the AFB1 þ mycotoxin adsorbent group. In the liver, only trend-level changes were observed during the experiment (data not shown). In contrast, the MDA content of the kidney showed significantly higher
Table 4.Effect of AFB1and AFB1þzeolite containing diets on malondialdehyde content in blood plasma, red blood cell haemolysates and kidney homogenates (mean±SD;n56)
Test parameter Sample matrix Experimental group Day 0 Day 7 Day 14 Day 21
Malondialdehyde Blood plasmap Control 5.81±0.93 7.21b±1.73 5.62a±0.76 4.43a±0.46 Aflatoxin 5.09a±0.98 6.58b±0.33 6.48b±1.23 AflatoxinþZE 6.26ab±0.33 6.24ab±0.45 4.28a±0.68 Red blood cell haemolysatep Control 11.45±0.94 11.78±2.07 8.88±0.73 8.37b±0.49
Aflatoxin 10.94±0.61 9.91±0.51 6.93a±0.91
AflatoxinþZE 12.31±0.73 8.89±1.25 8.44b±0.80 Kidneypp Control 43.85±4.12 59.46±19.4 39.13±6.75 65.6ab±11.57
Aflatoxin 57.93±9.47 48.94±7.10 79.25b±11.26
AflatoxinþZE 61.83±12.08 38.40±7.36 54.48a±11.37 ZE: zeolite.
a,bDifferent superscripts in the same column indicate significant difference from the control atP< 0.05 level.pmmol/ml;ppmmol/g wet weight tissue.
Table 3.Effect of diets containing aflatoxin B1or aflatoxin B1and zeolite on the average daily AFB1intake of chickens (mg/day)
Group Days 1–7 Days 8–14 Days 15–21
Control <1.00 <1.00 <1.00
Aflatoxin 13.87 13.16 12.32
Aflatoxinþzeolite 11.50 10.86 11.22
values in the AFB1 group than in the AFB1 þ mycotoxin adsorbent group (Table 4).
The concentration of GSH in the blood plasma decreased significantly in the group fed the AFB1 þ mycotoxin adsorbent containing diet compared to the control and the AFB1-treated group on day 14 of exposure. Also, lower values were measured in the 10,000gsupernatant fraction of kidney homogenates in the group fed the AFB1þmycotoxin adsorbent containing diet compared to the AFB1-treated group on the 14th day of exposure (Table 5). There were trend-level but not significant changes in the GSH content of red blood cell haemolysates and liver homogenates (data not shown).
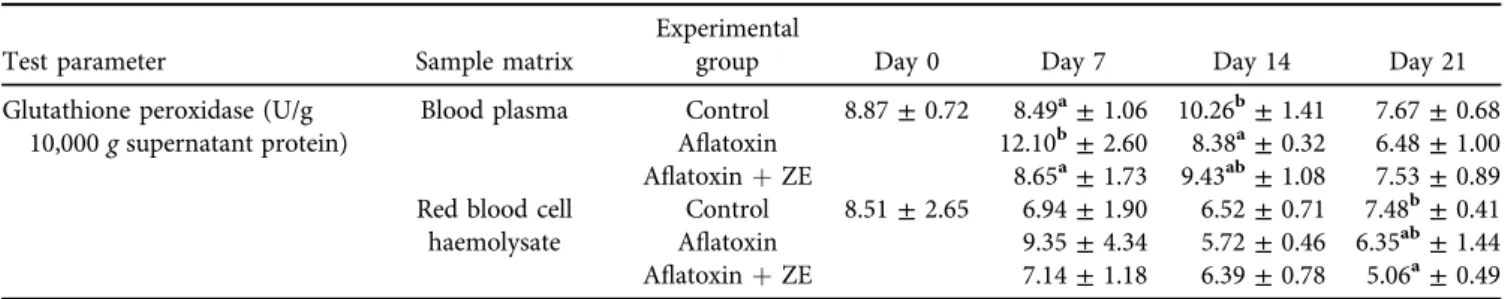
No significant differences were found in GPx activity in the 10,000 g supernatant fraction of liver and kidney ho- mogenates (data not shown). In the blood plasma, signifi- cantly higher values were measured on day 7 of AFB1 exposure than in the control and the AFB1 þ mycotoxin adsorbent group. However, significantly lower values were measured as an effect of AFB1treatment on day 14 than in the control. One week later, on day 21, there were no sig- nificant differences. However, on day 21, regarding the red blood cell haemolysates, significantly lower values were observed in the AFB1þmycotoxin adsorbent group than in the control (Table 6).
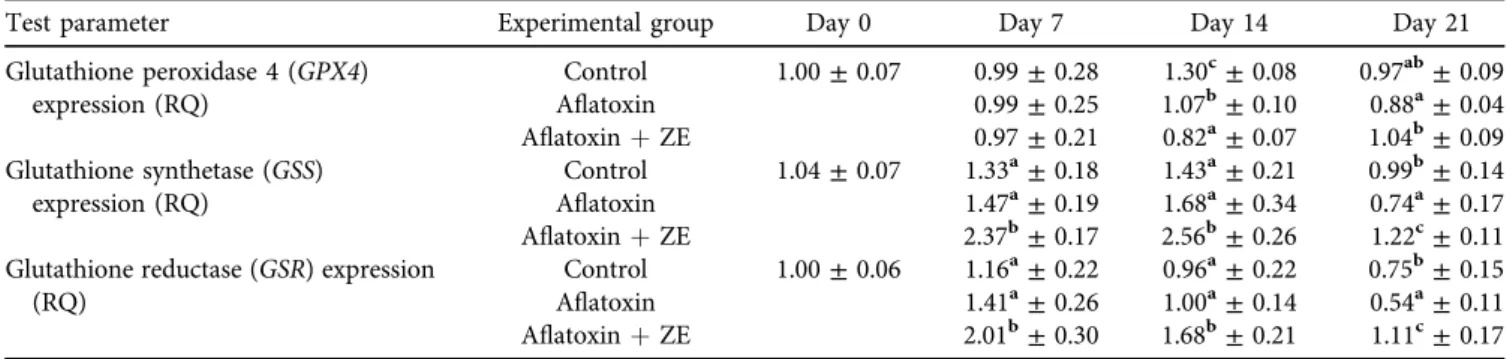
The relative expression of the GPx4 gene was signifi- cantly lower in both treatment groups than in the control on day 14 of exposure. Later, on day 21, there was no difference between the treatment groups and the control group; how- ever, GPx4 expression in the AFB1-treated group was
significantly lower than in the AFB1þmycotoxin adsorbent group (Table 7).
GSSand GSRgene expression showed the same statisti- cally significant differences. The gene expression was significantly higher in the AFB1 þ mycotoxin adsorbent treatment group on days 7, 14 and 21. Still, significantly lower values were measured in the AFB1-treated group than in the control for bothGSSandGSRon day 21 (Table 7).
The relative expression of KEAP1 was significantly higher in both treatment groups than in the control on day 7, but later no changes were observed. On day 7,NRF2gene expression was significantly higher in both treatment groups than in the control but on day 14 it was significantly lower, and then no changes were found on day 21 (Table 8).
DISCUSSION
Changes in the markers of the initial phase of lipid peroxi- dation (CD and CT values) suggest that the lipid peroxi- dation processes in the examined tissues, due to long-term aflatoxin exposure, were in their termination phase.
MDA content of the blood plasma showed significantly higher values on days 14 and 21 in the AFB1-treated group than in the control, but it was significantly lower in the AFB1
þzeolite group than in the AFB1-treated one. In contrast, on day 21 the MDA content in the red blood cell haemo- lysates showed significantly lower values in the AFB1-treated group than in the control and the AFB1 þ zeolite group.
There were no significant changes in the MDA content of
Table 6.Effect of AFB1and AFB1þzeolite containing diets on glutathione peroxidase activity in blood plasma and red blood cell haemolysates (mean±SD;n56)
Test parameter Sample matrix
Experimental
group Day 0 Day 7 Day 14 Day 21
Glutathione peroxidase (U/g 10,000gsupernatant protein)
Blood plasma Control 8.87±0.72 8.49a±1.06 10.26b±1.41 7.67±0.68 Aflatoxin 12.10b±2.60 8.38a±0.32 6.48±1.00 AflatoxinþZE 8.65a±1.73 9.43ab±1.08 7.53±0.89 Red blood cell
haemolysate
Control 8.51±2.65 6.94±1.90 6.52±0.71 7.48b±0.41 Aflatoxin 9.35±4.34 5.72±0.46 6.35ab±1.44 AflatoxinþZE 7.14±1.18 6.39±0.78 5.06a±0.49 ZE: zeolite.
a, bDifferent superscripts in the same column indicate significant difference from the control atP< 0.05 level.
Table 5.Effect of AFB1and AFB1þzeolite containing diets on reduced glutathione concentration in blood plasma and kidney homogenates (mean±SD;n56)
Test parameter Sample matrix Experimental group Day 0 Day 7 Day 14 Day 21
Reduced glutathione Blood plasmap Control 8.44±0.99 8.99±0.56 7.96b±0.90 7.62±0.83
Aflatoxin 10.10±1.88 7.65b±0.54 7.48±0.98
AflatoxinþZE 8.59±0.81 6.61a±0.47 7.19±0.69
Kidneypp Control 6.28±0.36 4.84±1.00 5.64ab±0.52 4.87±0.67
Aflatoxin 6.04±2.25 6.00b±0.41 5.37±0.80
AflatoxinþZE 5.24±1.22 5.25a±0.27 5.08±0.59
ZE: zeolite.
a, bDifferent superscripts in the same column indicate significant difference from the control atP< 0.05 level.pmmol/g protein content;
ppmmol/g 10,000gsupernatant protein.
the liver among the treatment groups. In contrast, on day 21 the MDA content of the kidney was significantly lower in the AFB1þzeolite group than in the case of AFB1treatment alone. Changes in the blood plasma and kidney MDA levels suggest that the effect of mycotoxin absorbent becomes more pronounced by day 21, which suggests that less mycotoxin is absorbed from the intestine, possibly due to the longer transit time of feed particles in the intestine, resulting in more efficient binding. The decrease in MDA content in red blood cell haemolysate may be related to the changes induced by AFB1 exposure in erythrocyte number and function (Wang et al., 2015). However, MDA concentration in the kidney increased by day 21, which may be caused by the inadequate antioxidant defence. In contrast, the MDA content of the liver did not increase, probably due to the effect of the glutathione redox system, which counter- balanced the lipid peroxidation-inducing effect of aflatoxin exposure.
The changes in lipid peroxidation processes in the liver were similar to those observed in theKEAP1gene but were opposite to the changes found in NRF2 gene expression.
This result suggests that the redox changes caused by the absorbed aflatoxins did not induce the same changes at the gene expression level. Zeolite addition generated a more robust Nrf2 response at the gene expression level in the 3rd week. This may be due to the decreasedKEAP1expression detected in the 2nd week. Under normal conditions, Nrf2 is sequestered in the cytoplasm by Keap1, ubiquitinated, and degraded in the proteasomes (Clarke et al., 2016). Under
oxidative stress conditions, reactive cysteine residues in Keap1 undergo redox modification (Bryan et al., 2013), inhibiting the Keap1-mediated degradation of Nrf2, result- ing in accumulation of Nrf2 in the nucleus, and increasing the transcription of genes of antioxidant responsive elements (AREs) in their promoter regions (Hayes and Dinkova- Kostova, 2014). The mode of action of zeolite on the Keap1–
NrF2–ARE pathway remains unclear and requires further investigations.
GSH content in the blood plasma decreased as a result of aflatoxin exposure, which may be due to a decrease in the synthetic capacity of the liver, which is the primary site of GSH biosynthesis (Shelly and Lu, 2013), and reduced GSH efflux from the liver cells, which could be a cause of GSH depletion in the blood plasma. On the other hand, the kidney had the lowest amount of GSH due to the effect of zeolite on day 14, which may be related to decreased renal GSH synthesis and oxidation. The exact mechanism is not known yet. However, the GSH content was not correlated with the expression of GSS at the same time because the increase of the latter did not cause a change in the GSH content of the liver. The expression of the GSR gene encoding the enzyme catalysing the reduction of glutathione disulphide (GSSG) changed with the GSH content, sug- gesting that the trend-level increase in GSH content in the liver may have increased the reduction of glutathione disulphide by day 14. Also, our results on GSS expression suggest that the changes in mRNA levels do not imply a simultaneous increase in the intensity of protein synthesis Table 7.Effect of AFB1and AFB1þzeolite containing diet on the relative expression ofGPX4,GSRandGSSgenes in the liver of broiler
chickens (mean±SD;n56 in a pool, equal amounts of cDNA per individual)
Test parameter Experimental group Day 0 Day 7 Day 14 Day 21
Glutathione peroxidase 4 (GPX4) expression (RQ)
Control 1.00±0.07 0.99±0.28 1.30c±0.08 0.97ab±0.09
Aflatoxin 0.99±0.25 1.07b±0.10 0.88a±0.04
AflatoxinþZE 0.97±0.21 0.82a±0.07 1.04b±0.09
Glutathione synthetase (GSS) expression (RQ)
Control 1.04±0.07 1.33a±0.18 1.43a±0.21 0.99b±0.14
Aflatoxin 1.47a±0.19 1.68a±0.34 0.74a±0.17
AflatoxinþZE 2.37b±0.17 2.56b±0.26 1.22c±0.11
Glutathione reductase (GSR) expression (RQ)
Control 1.00±0.06 1.16a±0.22 0.96a±0.22 0.75b±0.15
Aflatoxin 1.41a±0.26 1.00a±0.14 0.54a±0.11
AflatoxinþZE 2.01b±0.30 1.68b±0.21 1.11c±0.17
ZE: zeolite.
a, b, cDifferent superscripts in the same column indicate significant difference from the control atP< 0.05 level.
Table 8.Effect of AFB1and AFB1þzeolite containing diet on the relative expression ofKEAP1andNRF2genes in the liver of broiler chickens (mean±SD;n56 in a pool, equal amounts of cDNA per individual)
Test parameter Experimental group Day 0 Day 7 Day 14 Day 21
Kelch-like ECH-Associated Protein 1
(KEAP1) expression (RQ) Control 1.03±0.06 1.18a±0.08 1.16±0.10 0.70±0.07
Aflatoxin 1.41b±0.11 1.19±0.17 0.69±0.06
AflatoxinþZE 1.86c±0.16 1.14±0.08 0.69±0.07
Nuclear Factor-Erythroid 2 p45-Related
Factor 2 (NRF2) expression (RQ) Control 1.00±0.03 1.20a±0.07 1.63c±0.20 0.92±0.10
Aflatoxin 1.53b±0.10 1.05b±0.09 0.91±0.12
AflatoxinþZE 1.52b±0.14 0.85a±0.12 0.96±0.13
ZE: zeolite.
a, b, cDifferent superscripts in the same column indicate significant difference from the control atP< 0.05 level.
because they are influenced by other factors, such as microRNAs (Ambros, 2004). Based on our results, the changes in the expression of GSS and GSR genes are not correlated with NRF2 expression either, suggesting that activation of the Nrf2–ARE transcription pathway pre- supposes the presence of Nrf2 protein. However, the alter- ations observed in the group with the mycotoxin adsorbent suggest that the effect of the absorbed aflatoxin on the oxidative stress processes in the liver changes with age, and zeolite affects the glutathione synthesis and/or reduction at the gene expression level, possibly by its effect on the amount of absorbed AFB1 during the experiment.
The GSH content of the tissues is also influenced by GPx activity; however, this association was only partially detected in the blood plasma and the red blood cell haemolysate.
Hepatic and renal GPx activity changed only moderately during the study period. In the case of the liver, this may be due to a decrease inGPx4gene expression in week 2, which is presumably related to a decrease in Nrf2gene expression over the same period, also at the protein synthesis level, so the Nrf2 protein did not activate ARE, including transcrip- tion of the GPx4 gene. Subsequently, however, the expres- sion ofGPx4showed an increase during the entire period of aflatoxin exposure in the case of mycotoxin absorbent sup- plementation, although this effect was not detectable in the activity of the GPx enzyme. A relationship between plasma and renal GPx activity can also be hypothesised because plasma GPx3 is synthesised in the renal tubular cells (Avissar et al., 1994). On day 7, the effect of aflatoxin was associated with an increase in GPx activity in the kidney and the blood plasma at the same time; however, on day 14, there was no change in renal GPx activity concomitant with the decrease of GPx activity in the blood plasma.
In conclusion, the results revealed that the applied amount of aflatoxin B1 caused only moderate oxidative stress, which was reduced further by the use of zeolite as a mycotoxin adsorbent, possibly due to the lower amount of mycotoxin absorbed. The effect of zeolite was more marked in the relative gene expressions of the GSS, GSR and GPx genes than at protein (GPx4 activity) or GSH level. The exact mechanism of this process is not known yet, and it requires further investigations.
ACKNOWLEDGEMENTS
The present study was supported by the EFOP-3.6.3- VEKOP-16-2017-00008 project, co-financed by the Euro- pean Union and the European Social Fund, and the NVKP_16-1-2016-0009 project financed by the National Research, Development and Innovation Office of Hungary.
REFERENCES
Abrar, M., Anjum, F. M., Butt, M. S., Pasha, I., Randhawa, M. A., Saeed, F. and Waqas, K. (2013): Aflatoxins: biosynthesis,
occurrence, toxicity, and remedies. Crit. Rev. Food Sci. Nutr.
53, 862–874.
Ambros, V. (2004): The functions of animal microRNAs. Nature 431, 350–355.
Avissar, N., Ornt, D. B., Yagil, Y., Horowitz, S., Watkins, R. H., Kerl, E. A., Takahashi, K., Palmer, I. S. and Cohen, H. J. (1994):
Human kidney proximal tubules are the main source of plasma glutathione peroxidase. Am. J. Physiol.266, C367–C375.
Balogh, K., K€ovesi, B., Zandoki, E., Kulcsar, S., Ancsin, Z., Erdelyi, M., Dobolyi, C., Bata-Vidacs, I., Inotai, K., Szekeres, A., Mezes, M. and Kukolya, J. (2019): Effect of sterigmatocystin or afla- toxin contaminated feed on lipid peroxidation and glutathione redox system and expression of glutathione redox system reg- ulatory genes in broiler chicken. Antioxidants8, 201.
Binder, L. M., Tan, L. J., Chin, J., Handl, J. and Richard, E. M.
(2007): Worldwide occurrence of mycotoxins in commodities, feeds and feed ingredients. Anim. Feed Sci. Technol.137, 265–
282.
BIOMIN (2020): World Mycotoxin Survey Annual Report No. 16.
https://www.biomin.net/solutions/mycotoxin-survey/(Accessed 03.08.2020).
Bryan, H. K., Olayanju, A., Goldring, C. E. and Park, B. K. (2013):
The Nrf2 cell defence pathway: Keap1-dependent and -inde- pendent mechanisms of regulation. Biochem. Pharmacol. 85, 705–717.
Chen, X., Horn, N. and Applegate, T. (2014): Efficiency of hydrated sodium calcium aluminosilicate to ameliorate the adverse effects of graded levels of aflatoxin B1 in broiler chicks. Poult.
Sci.93, 2037–2047.
Clarke, J. L., Murray, J. B., Park, B. K. and Copple, I. M. (2016):
Roles of Nrf2 in drug and chemical toxicity. Curr. Opin. Tox- icol.1, 104–110.
Diaz, G. J. and Murcia, H. W. (2019): An unusually high produc- tion of hepatic aflatoxin B1-dihydrodiol, the possible explana- tion for the high susceptibility of ducks to aflatoxin B1. Sci. Rep.
9, 8010.
Dobolyi, Cs., Seb}ok, F., Varga, J., Kocsube, S., Szigeti, G., Baranyi, N., Szecsi, A., T oth, B., Varga, B., Kriszt, B., Szoboszlay, S., Krifaton, C. and Kukolya, J. (2013): Occurrence of aflatoxin producing Aspergillus flavus isolates in maize kernel in Hungary. Acta Aliment.42, 451–459.
Elliott, C. T., Connolly, L. and Kolawole, O. (2020): Potential adverse effects on animal health and performance caused by the addition of mineral adsorbents to feeds to reduce mycotoxin exposure. Mycotoxin Res.36, 115–126.
Fink-Gremmels, J. (1999): Mycotoxins: their implications for hu- man and animal health. Vet. Quart.21, 115–120.
Fouad, A. M., Ruan, D., El-Senousey, H. A. K., Chen, W., Jiang, S.
and Zheng, C. (2019): Harmful effects and control strategies of aflatoxin B1 produced by Aspergillus flavus and Aspergillus parasiticusstrains on poultry: Review. Toxins11, 176.
Han, X. Y., Hung, Q. C. and Li, W. F. (2008): Changes in growth performance, digestive enzyme activities and nutrient di- gestibility of Cherry Valley ducks in response to aflatoxin B1 levels. Livest. Sci.119, 216–220.
Hayes, J. D. and Dinkova-Kostova, A. T. (2014): The Nrf2 regu- latory network provides an interface between redox and inter- mediary metabolism. Trends Biochem. Sci.39, 199–218.
Hungarian Feed Code (2014): Nutrient Requirements of Farm Animals. Vol.II/II. OMMI, Budapest. [in Hungarian].
IARC–International Agency for Research on Cancer (2002): IARC Monographs on the Evaluation of Carcinogenic Risks to Humans: Traditional Herbal Medicines, Some Mycotoxins, Naphthalene and Styrene. International Agency for Research on Cancer, IARC Scientific Publication, Lyon, No. 82.
Janero, D. R. (1990): Malondialdehyde and thiobarbituric acid- reactivity as diagnostic indices of lipid peroxidation and per- oxidative tissue injury. Free Radic. Biol. Med.9, 515–540.
Karaman, M., Ozen, H., Tuzcu, M., Cigremis, Y., Onder, F. and Ozcan, K. (2010): Pathological, biochemical and haematological investigations on the protective effect of alpha-lipoic acid in experimental aflatoxin toxicosis in chicks. Br. Poult. Sci. 51, 132–141.
Khayoon, W. S., Saad, B., Yan, C. B., Hashim, N. H., Ali, A. S. M., Salleh, M. I. and Salleh, B. (2010): Determination of aflatoxins in animal feeds by HPLC with multifunctional column clean- up. Food Chem.118, 882–886.
Kodama, M., Inoue, F. and Akao, M. (1990): Enzymatic and non- enzymatic formation of free radicals from aflatoxin B1. Free Radic. Res. Commun.10, 137–142.
K€ovesi, B., Cserhati, M., Erdelyi, M., Zandoki, E., Mezes, M. and Balogh, K. (2019): Long-term effects of ochratoxin A on the glutathione redox system and its regulation in chicken. Anti- oxidants8, 178.
K€ovesi, B., Cserhati, M., Erdelyi, M., Zandoki, E., Mezes, M. and Balogh, K. (2020): Lack of dose- and time-dependent effects of aflatoxin B1 on gene expression and enzymes associated with lipid peroxidation and the glutathione redox system in chicken.
Toxins12, 84.
Livak, K. J. and Schmittgen, T. D. (2001): Analysis of relative gene expression data using real-time quantitative PCR and the 2(-Delta Delta C(T)) method. Methods25, 402–408.
Marin, D. E. and Taranu, I. (2012): Overview on aflatoxins and oxidative stress. Toxin Rev.31, 32–43.
Migliorini, M. J., Da Silva, S. A., Santurio, J. M., Bottari, N. B., Gebert, R. R., Reis, J. H., Volpato, A., Morsch, V. M., Baldissera, M. D., Stefani, L. M. and Boiago, M. M. (2017): The protective effects of an adsorbent against oxidative stress in quails fed aflatoxin contaminated diet. Acta Sci. Vet.45, 1–7.
Nazarizadeh, H. and Pourreza, J. (2019): Evaluation of three mycotoxin binders to prevent the adverse effects of aflatoxin B1 in growing broilers. J. Appl. Anim. Res.47, 135–139.
Ozen, H., Karaman, M., Cigremis, Y., Tuzcu, M., Ozcan, K. and Erdag, D. (2009): Effectiveness of melatonin on aflatoxicosis in chicks. Res. Vet. Sci.86, 485–489.
Prasai, T., Walsh, K., Midmore, D. and Bhattarai, S. (2018):
Effect of biochar, zeolite and bentonite feed supplements on egg yield and excreta attributes. Anim. Prod. Sci. 58, 1632–
1641.
Rodrigues, I. and Naehrer, K. (2012): A three-year survey on the worldwide occurrence of mycotoxins in feedstuffs and feed.
Toxins4, 663–675.
Rushing, B. R. and Selim, M. I. (2017): Structure and oxidation of pyrrole adducts formed between aflatoxin B2a and biological amines. Chem. Res. Toxicol.30, 1275–1285.
Salem, R., El-Habashi, N., Fadl, S. E., Sakr, O. A. and Elbialy, Z. I.
(2018): Effect of probiotic supplement on aflatoxicosis and gene expression in the liver of broiler chicken. Environ. Toxicol.
Pharmacol.60, 118-127.
Shelly, C. and Lu, M. D. (2013): Glutathione synthesis. Biochim.
Biophys. Acta1830, 3143–3153.
Shen, H. M., Shi, C. Y., Lee, H. P. and Ong, C. N. (1994): Aflatoxin B1-induced lipid peroxidation in rat liver. Toxicol. Appl.
Pharmacol.127, 145–150.
Sirajudeen, M., Gopi, K., Tyagi, J. S., Moudgal, R. P., Mohan, J. and Singh, R. (2011): Protective effects of melatonin in reduction of oxidative damage and immunosuppression induced by afla- toxin B1-contaminated diets in young chicks. Environ. Toxicol.
26, 153–160.
Wang, C., Peng, X., Cui, H. and Fang, J. (2015): Effects of aflatoxin B1 on the erythrocyte count, the content of hemoglobin, and the immune adherence function of erythrocytes in chickens.
Med. Weter.71, 758–762.
Yamauchi, K., Manabe, N., Matsumoto, Y., Takenoyama, S. I. and Yamauchi, K. E. (2014): Increased collagen III in culled chicken meat after feeding dietary wood charcoal and vinegar contributes to palatability and tenderness. Anim. Sci. J. 85, 468–480.
Yarru, L. P., Settivari, R. S., Antoniou, E., Ledoux, D. R. and Rot- tinghaus, G. (2009): Toxicological and gene expression analysis of the impact of aflatoxin B1 on hepatic function of male broiler chicks. Poult. Sci.88, 360–371.
Yilmaz, S., Kaya, E. and Kisacam, M. A. (2017): The effect on oxidative stress of aflatoxin and protective effect of lycopene on aflatoxin damage. In: Abdulra’Uf, L. (ed.) Aflatoxin: Control, Analysis, Detection and Health Risks. InTech, Rijeka. pp. 67–
89.
Zhuang, Z., Lohmar, J. M., Satterlee, T., Cary, J. W. and Calvo, A. M. (2016): The master transcription factor mtfA governs aflatoxin production, morphological development and pathogenicity in the fungus Aspergillus flavus. Toxins 8, 29.
Open Access. This is an open-access article distributed under the terms of the Creative Commons Attribution 4.0 International License (https://creativecommons.org/
licenses/by/4.0/), which permits unrestricted use, distribution, and reproduction in any medium, provided the original author and source are credited, a link to the CC License is provided, and changes–if any–are indicated. (SID_1)