International Journal of
Molecular Sciences
Article
Human Somatostatin SST 4 Receptor Transgenic Mice:
Construction and Brain Expression Pattern Characterization
Balázs Nemes1,2, Kata Bölcskei1,2, Angéla Kecskés1,2 , Viktória Kormos1,2 , Balázs Gaszner3 , Timea Aczél1,2, Dániel Hegedüs3, Erika Pintér1,2,4,5,† , Zsuzsanna Helyes1,2,4,5,*,†and Zoltán Sándor1,†
Citation: Nemes, B.; Bölcskei, K.;
Kecskés, A.; Kormos, V.; Gaszner, B.;
Aczél, T.; Hegedüs, D.; Pintér, E.;
Helyes, Z.; Sándor, Z. Human Somatostatin SST4Receptor Transgenic Mice: Construction and Brain Expression Pattern
Characterization.Int. J. Mol. Sci.2021, 22, 3758. https://doi.org/10.3390/
ijms22073758
Academic Editor: Timofey S.
Rozhdestvensky
Received: 29 March 2021 Accepted: 31 March 2021 Published: 4 April 2021
Publisher’s Note:MDPI stays neutral with regard to jurisdictional claims in published maps and institutional affil- iations.
Copyright: © 2021 by the authors.
Licensee MDPI, Basel, Switzerland.
This article is an open access article distributed under the terms and conditions of the Creative Commons Attribution (CC BY) license (https://
creativecommons.org/licenses/by/
4.0/).
1 Department of Pharmacology and Pharmacotherapy, University of Pécs Medical School & Centre for Neuroscience, H-7624 Pécs, Hungary; balazs.nemes@aok.pte.hu (B.N.); kata.bolcskei@aok.pte.hu (K.B.);
angela.kecskes@aok.pte.hu (A.K.); viktoria.kormos@aok.pte.hu (V.K.); aczel.timea@pte.hu (T.A.);
erika.pinter@aok.pte.hu (E.P.); zoltan.sandor@aok.pte.hu (Z.S.)
2 János Szentágothai Research Centre, University of Pécs, H-7624 Pécs, Hungary
3 Research Group for Mood Disorders, Department of Anatomy, University of Pécs Medical School & Centre for Neuroscience, H-7624 Pécs, Hungary; balazs.b.gaszner@aok.pte.hu (B.G.); hedani93@gmail.com (D.H.)
4 PharmInVivo Ltd., H-7629 Pécs, Hungary
5 Algonist Biotechnologies Gmbh, 1030 Wien, Austria
* Correspondence: zsuzsanna.helyes@aok.pte.hu; Tel.: +36-72-501-500/29043
† These authors contributed equally to this work.
Abstract:Somatostatin receptor subtype 4 (SST4) has been shown to mediate analgesic, antidepres- sant and anti-inflammatory functions without endocrine actions; therefore, it is proposed to be a novel target for drug development. To overcome the species differences of SST4receptor expression and function between humans and mice, we generated an SST4humanized mouse line to serve as a translational animal model for preclinical research. A transposon vector containing thehSSTR4 and reporter gene construct driven by thehSSTR4regulatory elements were created. The vector was randomly inserted inSstr4-deficient mice.hSSTR4expression was detected by bioluminescent in vivo imaging of the luciferase reporter predominantly in the brain. RT-qPCR confirmed the expression of the human gene in the brain and various peripheral tissues consistent with the in vivo imaging.
RNAscope in situ hybridization revealed the presence ofhSSTR4transcripts in glutamatergic excita- tory neurons in the CA1 and CA2 regions of the hippocampus; in the GABAergic interneurons in the granular layer of the olfactory bulb and in both types of neurons in the primary somatosensory cortex, piriform cortex, prelimbic cortex and amygdala. This novel SST4humanized mouse line might enable us to investigate the differences of human and mouse SST4receptor expression and function and assess the effects of SST4receptor agonist drug candidates.
Keywords:somatostatin;Sstr4KO mice;SSTR4humanized mice; PiggyBac (PB) transposon vector;
ligation-mediated PCR; RNAscope in situ hybridization
1. Introduction
Somatostatin is a cyclic neuropeptide, which inhibits the secretion of several excitatory and inhibitory mediators, such as somatotropin, glucagon, insulin, acetylcholine, glutamate and gamma-aminobutyric acid (GABA) [1]. It regulates a range of physiological functions like sleep, motor activity, sensory functions, emotions, learning and memory, as well as different pathological conditions like pain, inflammation [2–5], neurodegeneration [6–9], anxiety and depression [10–13]. In the central nervous system, there are long protruding and short proximal somatostatin-containing GABAergic interneurons [14–16]. In the periphery, activated capsaicin-sensitive peptidergic sensory nerves were observed to release somatostatin and induce systemic anti-inflammatory and analgesic effects, which was termed “sensocrine” action [17,18]. Five Gi-protein-coupled receptors, designated SST1- SST5, mediate the actions of somatostatin. Previous work provided evidence that the SST4
Int. J. Mol. Sci.2021,22, 3758 2 of 21
receptor activation produces analgesic, anti-inflammatory, anti-amyloid, anti-anxiety and antidepressant effects without influencing hormone secretion [2,19–23].
Previous studies usedSstr4knockout (KO) and wild-type (WT) mice, since no SST4 receptor specific antagonist is commercially available. Investigating Sstr4KO mouse models and the synthetic SST4receptor agonist J-2156, we and other workgroups provided evidence that the SST4receptor is a unique novel drug target for the treatment of chronic pain and depression [2,4,20,24–27].
The presently available drugs for these conditions are often not efficacious enough and cause serious side effects upon long-term use [28]. Thus, the SST4receptor has recently come into the focus of interest of drug development, and pharmaceutical companies have started to develop non-peptide SST4agonists [29]. The agonist design has been greatly enhanced by the in silico 3D modeling of the human receptor structure [30,31].
Humanized mice are predominantly generated by engrafting human cells, tissues and tumors and used extensively for immunological and oncological research [32–37], but genetic modification is also an increasingly applied method [38–41]. Human receptor expressing mouse models are useful in translational drug research, providing more pre- dictive results relevant for the human diseases and more relevant platforms for testing drug candidates [42,43]. For example, Fox et al. replaced the native bradykinin B1receptor gene in mouse with its human B1 receptor gene to investigate the human B1receptor- specific antagonist NVP-SAA164 in vivo after the successful in vitro results. NVP-SAA164 showed an anti-hyperalgesic function in these humanized mice, but not in WT nor in KO mice [44]. Jackson et al. found functional differences between mouse and human melanocortin receptor using MC1R humanized mice, such as the high ligand dependent eumelanogenesis in humanized mice. Mouse Mc1r receptor in WT mice in vivo, and both mouse and human melanocortin receptors in transfected cell lines in vitro showed ligand independent signaling [45].
The mouse SST4expression and function is relatively well-characterized in the brain [46], but little is known about the human receptor.
Therefore, our aims were to produce humanized mice by using a transposon vector containing thehSSTR4gene with its regulatory elements, locate the random insertion sites and characterize the distribution pattern and the neuron populations expressing the transgene in the brain, as well as select the most useful mouse line for further functional research.
2. Results
2.1. Vector Construction and Transgenesis
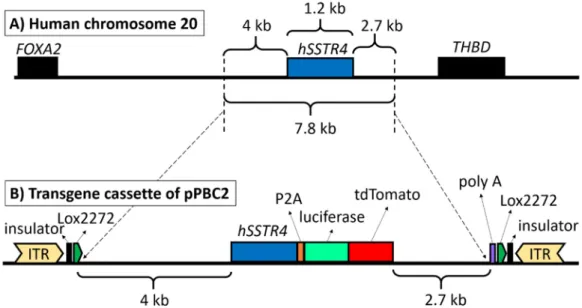
The final construct pPBC2 plasmid contained the full-lengthhSSTR4gene with a 4-kb upstream and 2.7-kb downstream region of the human chromosome 20 to include every known regulatory element (Figure1A). At the end of thehSSTR4coding sequence, luciferase and the tandem dimer Tomato (tdTomato) coding sequence were inserted, sepa- rated from the receptor by the P2A self-cleaving site, but the reporters were expected to be translated as a fusion protein. At the end of the downstream chromosomal region, a polyadenylation signal (polyA) sequence was added for transcription termination. The entire transgene cassette was flanked at both ends by Lox2272 Cre recombinase recognition sites as an option for conditional KO by insulators to inhibit position effects and by Piggy- Bac (PB) transposon inverted terminal repeats (ITR) as specific recognition sites for the PB transposase enzyme (Figure1B).
Int. J. Mol. Sci.2021,22, 3758 3 of 21
Int. J. Mol. Sci. 2021, 22, x FOR PEER REVIEW 3 of 22
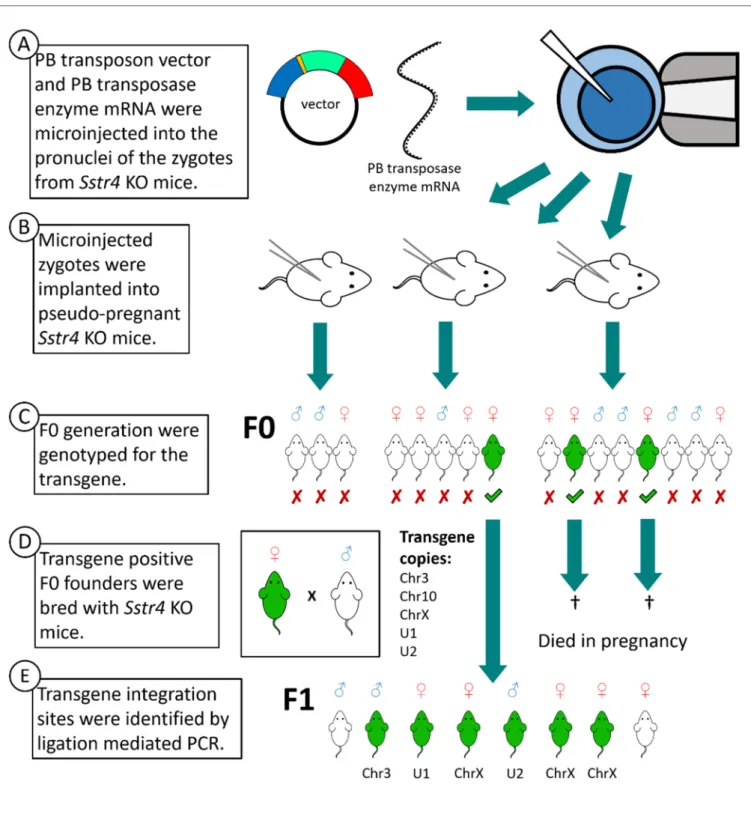
were verified by PCR carrying the PB transposon without the plasmid backbone (Figure 2C). These transgene positive mice were crossbred with Sstr4 KO mice. Two females died in late pregnancy. The third female produced 8 offspring (F1 generation), but it also died during its second pregnancy (Figure 2D). In this founder mouse, the PB transposon integration sites were located by ligation‐mediated polymerase chain reaction (LM‐PCR) (Figure 2E). From the F1 generation onwards, all mouse lines carried a single copy of the transgene, and none of those lines manifest a harmful phenotype based on viability, fertility and behavior. There were no differences between the litter sizes of the mouse lines (WT: 6.2 ± 0.4, KO: 5.8 ± 0.3, Chr3: 6.5 ± 0.4, U1: 6.0 ± 0.4, and U2: 5.9 ± 0.4).
Figure 1. The structure of the PiggyBac (PB) transposon. Human chromosome 20 showing the full‐length hSSTR4 coding sequence with up‐ and downstream regulatory elements (7.8 kb) as copied fragments and the neighboring genes (FOXA2 and THBD) (A). PB transposon vector carrying the upstream regulatory elements (4 kb) and human SSTR4 coding sequence followed by the P2A self‐cleaving peptide sequence, luciferase and tdTomato coding sequences downstream SSTR4 regulatory elements (2.7 kb) and polyadenylation signal sequence (poly A). The entire transgenic cassette (12.7 kb) was flanked by the PB transposon inverted terminal repeats (ITR), insulators and Lox2272 Cre recombinase recognition sites (B).
2.2. Integration Sites of the hSSTR4 Transgene
The LM‐PCR detected multiple insertion loci of the transgene in the F0 founder female. By sequencing of the LM‐PCR products, three distinct integration sites were identified in chromosomes 3, 10 and X (copies were named Chr3, Chr10 and ChrX, respectively). The transgene inserted in the chromosome 10 did not pass onto the F1 generation (Figure 2). The transgene in the chromosome 3 was inserted between the Sis and Otol1 genes, coding on the negative strand of the chromosome (Figure 3). The PB transposase inserted the transposon while duplicating the TTAA recognition site, which started in the original position of 70,039,120 [47] (Figure 3). The transgene inserted in the chromosome 10 in the position of 67,335,940 [48], coding on the positive strand. The transgene inserted in the chromosome X at the position of 32,102,395 [49], coding on the positive strand. There were two mouse lines in which we were unable to locate the insertion site of the transgene (named U1 and U2) (Figure 2).
To keep track of the transgene in the mouse lines, we designed site‐specific genotyping assays for each copy in a known location, and we could differentiate hetero‐
and homozygotes. In the case of U1 and U2, we could only detect the presence of the transgene, but we could not distinguish the hetero‐ and homozygotes; therefore, we bred them strictly with Sstr4 KO mice to obtain only heterozygous mice for testing.
Figure 1.The structure of the PiggyBac (PB) transposon. Human chromosome 20 showing the full-lengthhSSTR4coding sequence with up- and downstream regulatory elements (7.8 kb) as copied fragments and the neighboring genes (FOXA2 andTHBD) (A). PB transposon vector carrying the upstream regulatory elements (4 kb) and humanSSTR4coding sequence followed by the P2A self-cleaving peptide sequence, luciferase and tdTomato coding sequences downstreamSSTR4 regulatory elements (2.7 kb) and polyadenylation signal sequence (poly A). The entire transgenic cassette (12.7 kb) was flanked by the PB transposon inverted terminal repeats (ITR), insulators and Lox2272 Cre recombinase recognition sites (B).
The vector was verified by sequencing as successfully constructed before it was injected into 56Sstr4KO zygotes, along with the PB transposase mRNA (Figure2A). After injection, the intact zygotes were implanted into three pseudo-pregnantSstr4KO mice (Figure2B). Sixteen mice were born in the F0 generation, out of which three female mice were verified by PCR carrying the PB transposon without the plasmid backbone (Figure2C).
These transgene positive mice were crossbred withSstr4KO mice. Two females died in late pregnancy. The third female produced 8 offspring (F1 generation), but it also died during its second pregnancy (Figure2D). In this founder mouse, the PB transposon integration sites were located by ligation-mediated polymerase chain reaction (LM-PCR) (Figure2E).
From the F1 generation onwards, all mouse lines carried a single copy of the transgene, and none of those lines manifest a harmful phenotype based on viability, fertility and behavior.
There were no differences between the litter sizes of the mouse lines (WT: 6.2±0.4, KO:
5.8±0.3, Chr3: 6.5±0.4, U1: 6.0±0.4, and U2: 5.9±0.4).
2.2. Integration Sites of the hSSTR4 Transgene
The LM-PCR detected multiple insertion loci of the transgene in the F0 founder female.
By sequencing of the LM-PCR products, three distinct integration sites were identified in chromosomes 3, 10 and X (copies were named Chr3, Chr10 and ChrX, respectively). The transgene inserted in the chromosome 10 did not pass onto the F1 generation (Figure2).
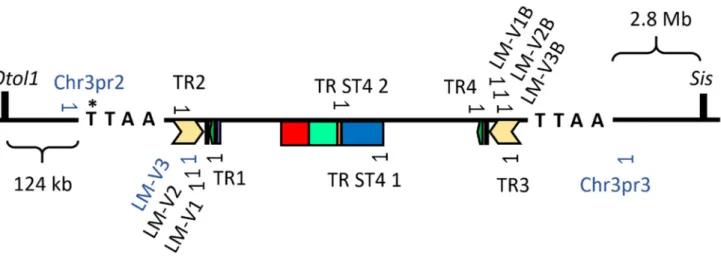
The transgene in the chromosome 3 was inserted between theSisandOtol1genes, coding on the negative strand of the chromosome (Figure3). The PB transposase inserted the transposon while duplicating the TTAA recognition site, which started in the original position of 70,039,120 [47] (Figure3). The transgene inserted in the chromosome 10 in the position of 67,335,940 [48], coding on the positive strand. The transgene inserted in the chromosome X at the position of 32,102,395 [49], coding on the positive strand. There were two mouse lines in which we were unable to locate the insertion site of the transgene (named U1 and U2) (Figure2).
Int. J. Mol. Sci.2021,22, 3758 4 of 21
Int. J. Mol. Sci. 2021, 22, x FOR PEER REVIEW 4 of 22
Figure 2. Steps of transgenesis by PB transposon vector. Schematic generation of hSSTR4 transgenic mice (A–E). White mice symbolize Sstr4 knockout (KO) mice lacking hSSTR4 transgene, green mice symbolize the correctly inserted hSSTR4 transgene. The transgene copies are named Chr3, Chr10 and ChrX (located in chromosomes 3, 10 and X, respectively) and U1 and U2 (the two copies in an unknown location).
Figure 2.Steps of transgenesis by PB transposon vector. Schematic generation ofhSSTR4transgenic mice (A–E). White mice symbolizeSstr4knockout (KO) mice lackinghSSTR4transgene, green mice symbolize the correctly insertedhSSTR4 transgene. The transgene copies are named Chr3, Chr10 and ChrX (located in chromosomes 3, 10 and X, respectively) and U1 and U2 (the two copies in an unknown location).
To keep track of the transgene in the mouse lines, we designed site-specific geno- typing assays for each copy in a known location, and we could differentiate hetero- and homozygotes. In the case of U1 and U2, we could only detect the presence of the transgene, but we could not distinguish the hetero- and homozygotes; therefore, we bred them strictly withSstr4KO mice to obtain only heterozygous mice for testing.
Int. J. Mol. Sci.2021,22, 3758 5 of 21
Int. J. Mol. Sci. 2021, 22, x FOR PEER REVIEW 5 of 22
Figure 3. The insertion site of the PB transposon in chromosome 3 of the Sstr4 KO mouse genome, along with the primers used for genotyping. Mouse chromosome 3 showing the location of the transgene insertion in the PB transposase recognition site (TTAA) at the original position of 70,039,120th base pair (*), which was located between the neighboring genes (Otol1 and Sis). Primer sites are shown in the transgene, which integrated in the chromosome 3 used for the first genotyping test of the F0 generation (TR1‐4), for verifying the sequencing of the hSSTR4 coding sequence (TR ST4 1–2), for ligation‐mediated PCR (LM‐V primers) and for present routine genotyping PCR (LM‐V3 and Chr3pr2‐3, marked with blue).
2.3. Distinct Expression Pattern of the hSSTR4‐Related Luciferase by Luminescent In Vivo Optical Imaging in Various Mouse Lines
First, we characterized the expression of the transgene by measuring the signals of the co‐expressed reporter fusion protein: the luminescence of the luciferase and the fluorescence of the tdTomato. Luciferase activity was visualized in the whole body (Figure 4A) and quantified in regions of interest (ROI) in the area of the brain (Figure 4B) by IVIS Lumina III. No luciferase activity was detected either in Sstr4 KO mice or in hemizygote male or homozygote female ChrX hSSTR4‐positive mice. Therefore, we excluded the ChrX line from later research, since the transgene was not expressed. Copies in unknown loci (U1 and U2) showed similar expression patterns: weak signal in the extremities and tail, medium signal strength in the area of cerebrum and the caudal part of the brain and strongest signal in the area of olfactory bulb (OB). Chr3 mice showed the strongest signal in the area corresponding to the cerebral hemispheres. Chr3 homozygous mice had nearly exactly double the signal intensity compared to Chr3 heterozygous mice. Chr3 Het mice had significantly stronger signal than U1 and U2 (also heterozygous) mice (Figure 4B). In the periphery, the luminescent signal was weaker and variable, with the highest levels in the lower abdomen and pelvis, regardless of the chromosomal location of the copy of the transgene. Fluorescence of tdTomato linked to hSSTR4 was not detectable in vivo by optical imaging (image is not shown).
Figure 3.The insertion site of the PB transposon in chromosome 3 of theSstr4KO mouse genome, along with the primers used for genotyping. Mouse chromosome 3 showing the location of the transgene insertion in the PB transposase recognition site (TTAA) at the original position of 70,039,120th base pair (*), which was located between the neighboring genes (Otol1 andSis). Primer sites are shown in the transgene, which integrated in the chromosome 3 used for the first genotyping test of the F0 generation (TR1-4), for verifying the sequencing of thehSSTR4coding sequence (TR ST4 1–2), for ligation-mediated PCR (LM-V primers) and for present routine genotyping PCR (LM-V3 and Chr3pr2-3, marked with blue).
2.3. Distinct Expression Pattern of the hSSTR4-Related Luciferase by Luminescent In Vivo Optical Imaging in Various Mouse Lines
First, we characterized the expression of the transgene by measuring the signals of the co-expressed reporter fusion protein: the luminescence of the luciferase and the fluores- cence of the tdTomato. Luciferase activity was visualized in the whole body (Figure4A) and quantified in regions of interest (ROI) in the area of the brain (Figure4B) by IVIS Lumina III. No luciferase activity was detected either inSstr4KO mice or in hemizygote male or homozygote female ChrXhSSTR4-positive mice. Therefore, we excluded the ChrX line from later research, since the transgene was not expressed. Copies in unknown loci (U1 and U2) showed similar expression patterns: weak signal in the extremities and tail, medium signal strength in the area of cerebrum and the caudal part of the brain and strongest signal in the area of olfactory bulb (OB). Chr3 mice showed the strongest signal in the area corresponding to the cerebral hemispheres. Chr3 homozygous mice had nearly exactly double the signal intensity compared to Chr3 heterozygous mice. Chr3 Het mice had significantly stronger signal than U1 and U2 (also heterozygous) mice (Figure4B). In the periphery, the luminescent signal was weaker and variable, with the highest levels in the lower abdomen and pelvis, regardless of the chromosomal location of the copy of the transgene. Fluorescence of tdTomato linked tohSSTR4was not detectable in vivo by optical imaging (image is not shown).
Int. J. Mol. Sci.2021,22, 3758 6 of 21
Int. J. Mol. Sci. 2021, 22, x FOR PEER REVIEW 6 of 22
Figure 4. In vivo bioluminescent imaging of the luciferase reporter protein co‐expressed with the hSSTR4 gene.
Representative images show the differences of expression pattern and luminescence intensity of luciferase in the different mouse lines (A). Scatter plot with bars show the means ± SEM with the individual data points of the luminescence intensity in equal size areas of the head corresponding to the brain (B). One‐way ANOVA, * p < 0.0001, N = 6–19/genotype.
2.4. hSSTR4 Expression Level Assessed by RT‐qPCR
In every inspected organ, with the exception of the lungs, Chr3 showed a higher expression of hSSTR4 than the mouse Sstr4 expression in the WT mice. Chr3 showed the highest hSSTR4 expression in the nervous system: cerebral cortex, olfactory bulb (OB), trigeminal ganglia (TG), cerebellum and brain stem, and also a relatively high expression in the epididymis. In comparison, the mouse Sstr4 expression in the WT mice was the highest in the cerebral cortex, lungs, OB, epididymis and TG but much lower in the brain Figure 4.In vivo bioluminescent imaging of the luciferase reporter protein co-expressed with thehSSTR4gene. Representa- tive images show the differences of expression pattern and luminescence intensity of luciferase in the different mouse lines (A). Scatter plot with bars show the means±SEM with the individual data points of the luminescence intensity in equal size areas of the head corresponding to the brain (B). One-way ANOVA, *p< 0.0001,N= 6–19/genotype.
2.4. hSSTR4 Expression Level Assessed by RT-qPCR
In every inspected organ, with the exception of the lungs, Chr3 showed a higher expression ofhSSTR4than the mouseSstr4expression in the WT mice. Chr3 showed the highesthSSTR4expression in the nervous system: cerebral cortex, olfactory bulb (OB), trigeminal ganglia (TG), cerebellum and brain stem, and also a relatively high expression in the epididymis. In comparison, the mouseSstr4expression in the WT mice was the highest in the cerebral cortex, lungs, OB, epididymis and TG but much lower in the brain stem and cerebellum than the humanized mice. Generally, U1 and U2 showed lower expression
Int. J. Mol. Sci.2021,22, 3758 7 of 21
levels ofhSSTR4in every organ, with the exception of the lungs, compared to Chr3 mice.
(Figure5).
Int. J. Mol. Sci. 2021, 22, x FOR PEER REVIEW 7 of 22
stem and cerebellum than the humanized mice. Generally, U1 and U2 showed lower expression levels of hSSTR4 in every organ, with the exception of the lungs, compared to Chr3 mice. (Figure 5).
Figure 5. Relative mouse Sstr4 and human SSTR4 mRNA expression levels in wild‐type (WT) and humanized (Chr3, U1 and U2) mice, respectively. The diagram shows RT‐qPCR results (2−ΔCt) relative to the beta actin (Actb) mRNA reference gene in the tested organs. Cortex, OB and TG stand for cerebral cortex, olfactory bulb and trigeminal ganglion, respectively. Each column shows the mean ± SEM. The significant differences between the WT and Chr3 mice are indicated with an asterisk above the Chr3 column. Kruskal‐Wallis test with Dunn’s post‐test; * p < 0.01; N = 3–7/genotype.
2.5. Expression of hSSTR4 mRNA in Different Types of Neurons in the Brain
Since the hSSTR4‐related tdTomato fluorescence was not detectable in native brain sections either (data not shown), and there is no reliably specific anti‐SST4 antibody on the market, in situ hybridization of the hSSTR4 mRNA was performed to explore its expression pattern. In brain samples of the hSSTR4 Chr3 homozygous mice, the hSSTR4 transcript showed a moderate expression level. Within the primary somatosensory cortex (S1), the highest level of expression was found in layers II and III (Figure 6A,B). The highest hSSTR4 expression was detected in the CA2 field of the hippocampus and in the piriform cortex (Figure 7). Other areas of the brain, such as the granular layer of the OB, Figure 5.Relative mouseSstr4and humanSSTR4mRNA expression levels in wild-type (WT) and humanized (Chr3, U1 and U2) mice, respectively. The diagram shows RT-qPCR results (2−∆Ct) relative to the beta actin (Actb) mRNA reference gene in the tested organs. Cortex, OB and TG stand for cerebral cortex, olfactory bulb and trigeminal ganglion, respectively.
Each column shows the mean±SEM. The significant differences between the WT and Chr3 mice are indicated with an asterisk above the Chr3 column. Kruskal-Wallis test with Dunn’s post-test; *p< 0.01;N= 3–7/genotype.
2.5. Expression of hSSTR4 mRNA in Different Types of Neurons in the Brain
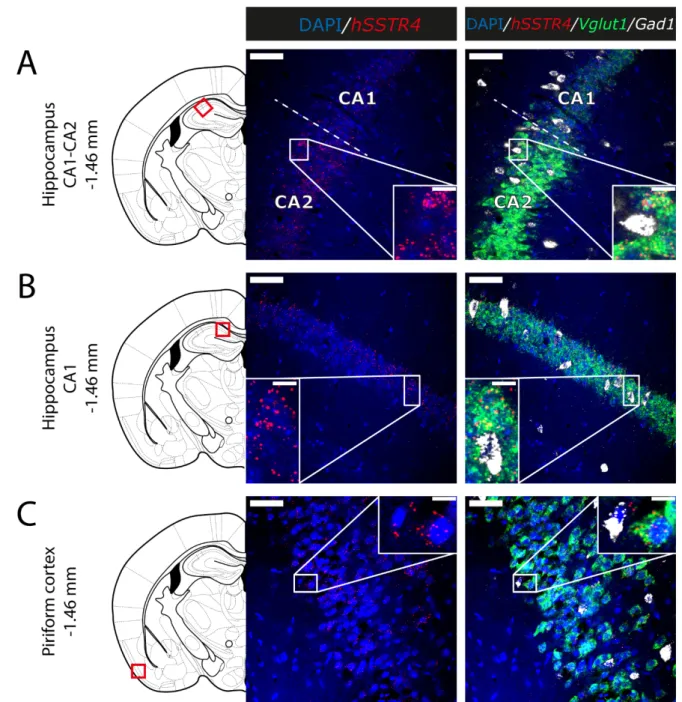
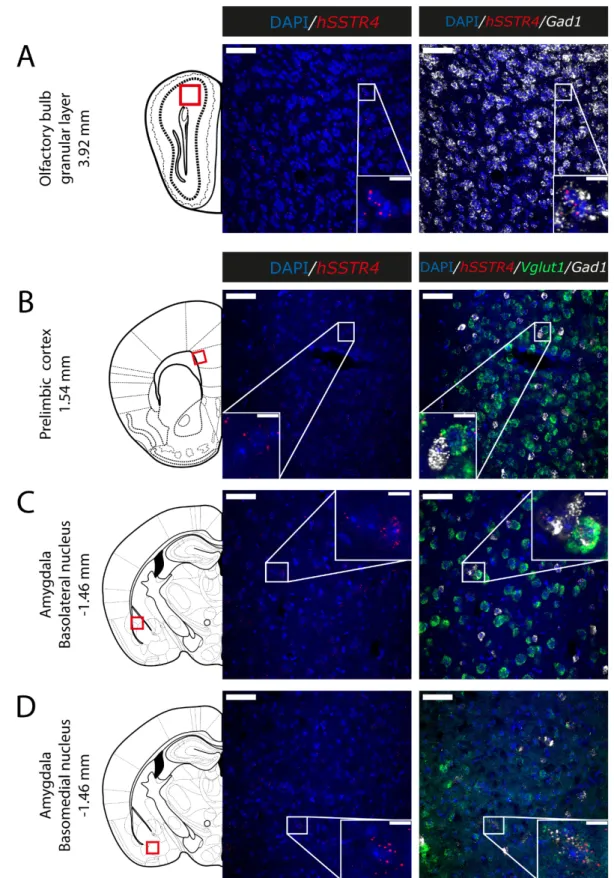
Since thehSSTR4-related tdTomato fluorescence was not detectable in native brain sections either (data not shown), and there is no reliably specific anti-SST4antibody on the market, in situ hybridization of the hSSTR4mRNA was performed to explore its expression pattern. In brain samples of thehSSTR4Chr3 homozygous mice, thehSSTR4 transcript showed a moderate expression level. Within the primary somatosensory cortex (S1), the highest level of expression was found in layers II and III (Figure6A,B). The highest hSSTR4expression was detected in the CA2 field of the hippocampus and in the piriform cortex (Figure7). Other areas of the brain, such as the granular layer of the OB, the prelimbic cortex, the basolateral (BLA) and the basomedial (BMA) nucleus of the amygdala, showed low, but still considerablehSSTR4expression levels (Figure8).
Int. J. Mol. Sci.2021,22, 3758 8 of 21
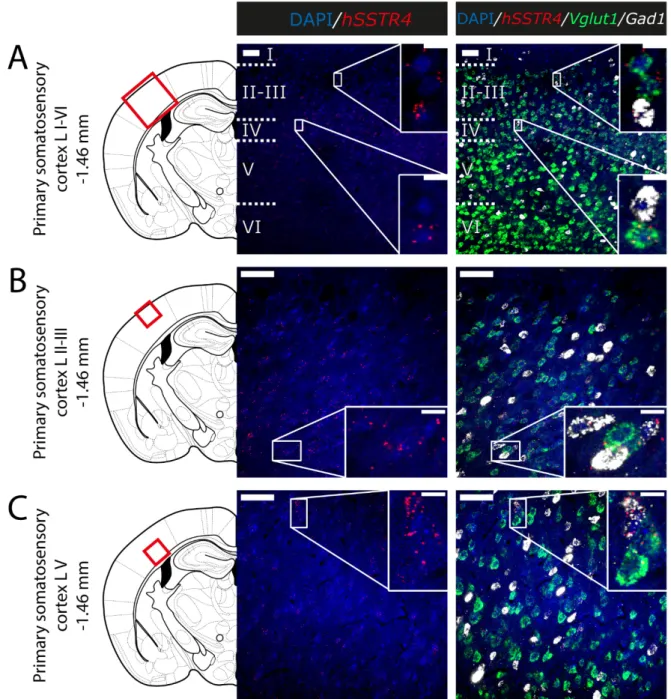
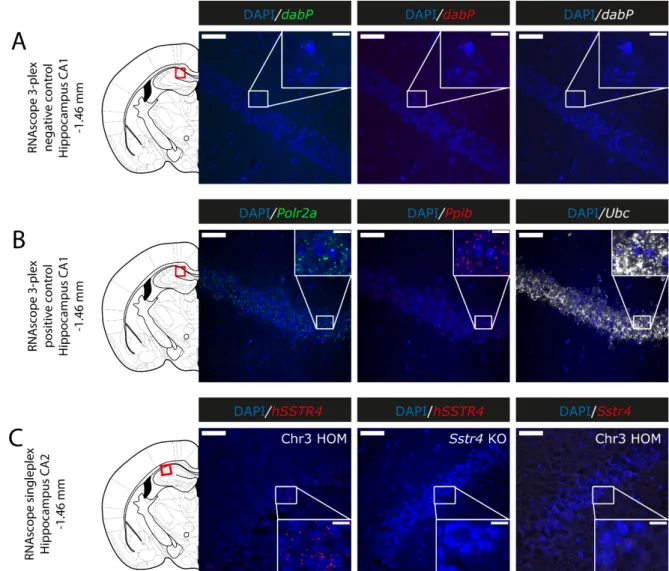
hSSTR4was predominantly localized on glutamatergic excitatory neurons (Vglut1) with inconsistent cases in the GABAergic interneurons (Gad1) in the primary somatosensory cortex (Figure6), piriform cortex (Figure7C), prelimbic cortex (Figure8B), BLA (Figure8C) and BMA (Figure8D). In the hippocampus, CA1 and CA2hSSTR4were localized in the glutamatergic excitatory neurons (Figure7A,B). In the granular layer of the OB,hSSTR4 transcripts were detected in the GABAergic interneurons (Figure8A). See the control samples in AppendixA(FigureA1).
Int. J. Mol. Sci. 2021, 22, x FOR PEER REVIEW 8 of 22
the prelimbic cortex, the basolateral (BLA) and the basomedial (BMA) nucleus of the amygdala, showed low, but still considerable hSSTR4 expression levels (Figure 8). hSSTR4 was predominantly localized on glutamatergic excitatory neurons (Vglut1) with inconsistent cases in the GABAergic interneurons (Gad1) in the primary somatosensory cortex (Figure 6), piriform cortex (Figure 7C), prelimbic cortex (Figure 8B), BLA (Figure 8C) and BMA (Figure 8D). In the hippocampus, CA1 and CA2 hSSTR4 were localized in the glutamatergic excitatory neurons (Figure 7A,B). In the granular layer of the OB, hSSTR4 transcripts were detected in the GABAergic interneurons (Figure 8A). See the control samples in Appendix A (Figure A1).
Figure 6. Expression of the hSSTR4 mRNA in the mouse primary somatosensory cortex. Representative confocal images from Chr3 homozygote mice. Human SSTR4 (red), mouse Vglut1 (green) and mouse Gad1 (white) mRNA expressions counterstained with 4′,6‐diamidino‐2‐phenylindole (DAPI) (blue) were shown in the layer I‐VI (A), the layer II‐III (B) and the layer V (C) of the primary somatosensory cortex (S1, Bregma −1.46 mm). Scale bar: 50 μm, and inset scale bar: 10 μm.
Figure 6.Expression of thehSSTR4mRNA in the mouse primary somatosensory cortex. Representative confocal images from Chr3 homozygote mice. HumanSSTR4(red), mouseVglut1(green) and mouseGad1(white) mRNA expressions counterstained with 40,6-diamidino-2-phenylindole (DAPI) (blue) were shown in the layer I-VI (A), the layer II-III (B) and the layer V (C) of the primary somatosensory cortex (S1, Bregma−1.46 mm). Scale bar: 50µm, and inset scale bar: 10µm.
Int. J. Mol. Sci.2021,22, 3758 9 of 21
Int. J. Mol. Sci. 2021, 22, x FOR PEER REVIEW 9 of 22
Figure 7. Expression of the hSSTR4 mRNA in the mouse hippocampus and piriform cortex. Representative confocal images from Chr3 homozygote mice. Human SSTR4 (red), mouse Vglut1 (green) and mouse Gad1 (white) mRNA expressions counterstained with DAPI (blue) were shown in the CA1‐CA2 region (Bregma −1.46 mm, (A)), CA1 region of the hippocampus (Bregma −1.46 mm, (B)) and the piriform cortex (Pir, Bregma −1.46 mm, (C)). Scale bar: 50 μm, and inset scale bar: 10 μm.
Figure 7.Expression of thehSSTR4mRNA in the mouse hippocampus and piriform cortex. Representative confocal images from Chr3 homozygote mice. HumanSSTR4(red), mouseVglut1(green) and mouseGad1(white) mRNA expressions coun- terstained with DAPI (blue) were shown in the CA1-CA2 region (Bregma−1.46 mm, (A)), CA1 region of the hippocampus (Bregma−1.46 mm, (B)) and the piriform cortex (Pir, Bregma−1.46 mm, (C)). Scale bar: 50µm, and inset scale bar: 10µm.
Int. J. Mol. Sci.2021,22, 3758 10 of 21
Int. J. Mol. Sci. 2021, 22, x FOR PEER REVIEW 10 of 22
Figure 8. Expression of the hSSTR4 mRNA in the mouse olfactory bulb, prelimbic cortex and amygdala. Representative confocal images from Chr3 homozygote mice. Human SSTR4 (red), mouse Vglut1 (green) and mouse Gad1 (white) mRNA expressions counterstained with DAPI (blue) were shown in the granular layer of the olfactory bulb (OB, Bregma +3.92 mm, (A)), prelimbic cortex (PrL, Bregma +1.54 mm, (B)), basolateral (BLA, (C)) and basomedial (BMA, (D)) nucleus of the amygdala (Bregma −1.46 mm). Scale bar: 50 μm, and inset scale bar: 10 μm.
Figure 8.Expression of thehSSTR4mRNA in the mouse olfactory bulb, prelimbic cortex and amygdala. Representative confocal images from Chr3 homozygote mice. HumanSSTR4(red), mouseVglut1(green) and mouseGad1(white) mRNA expressions counterstained with DAPI (blue) were shown in the granular layer of the olfactory bulb (OB, Bregma +3.92 mm, (A)), prelimbic cortex (PrL, Bregma +1.54 mm, (B)), basolateral (BLA, (C)) and basomedial (BMA, (D)) nucleus of the amygdala (Bregma−1.46 mm). Scale bar: 50µm, and inset scale bar: 10µm.
Int. J. Mol. Sci.2021,22, 3758 11 of 21
3. Discussion
The main impacts of the present work are that we successfully generated the first hSSTR4transgenic mouse line via random insertion of a PB transposon vector and charac- terized the receptor-expressing neurons in pain and mood regulation-related brain regions.
These mice can be useful tools for preclinical research of the SST4receptor, which is a promising novel target for analgesic and antidepressant drug development [2,22,23].
We chose random insertion instead of the popular knock-in approach, because we aimed to avoid the influence of mouse regulatory elements of theSstr4gene on the trans- gene. We used a transposon vector with the intact human regulatory elements flanked by insulator regions to resemble the human receptor expression pattern. However, the disad- vantage of this technique is that the mapping of the integration sites can be problematic, and the insert may disrupt mouse genes [50,51].
The random insertion of the PB transposon resulted in multiple integration sites in the F0 mouse generation. We successfully located three copies of the transgene by LM- PCR [52]: Chr3, Chr10 and ChrX, but the insertion sites of two copies (U1 and U2) are still unknown. The unsuccessful attempts to locate the integration sites of U1 and U2 suggest that they were inserted in repeat regions of the genome that makes mapping of the transgene difficult. Due to the known location of the transgene in the Chr3 mouse line, we could design site-specific genotyping assay to distinguish hetero- and homozygous mice.
All three transgenic mice in the F0 generation experienced complications during pregnancy and delivery and eventually died. This might have been due to the multicopy insertion of the transgene and the consequent overexpression of SST4, because this prob- lem never occurred again in the offspring carrying a single copy. This observation also supports a role of SST4in embryonal growth regulation, since it was demonstrated to be the predominant somatostatin receptor in the human placenta [53,54].
Bioluminescent in vivo optical imaging showedhSSTR4-linked luciferase expression pattern in different organs, and quantification showed that the luminescent signal was the strongest in the area corresponding to the brain. Chr3 mice showed a high expression in the area of the cerebrum, whereas U1 and U2 showed a lower expression here but a higher expression in the area of the OB and the caudal part of the brain. RT-qPCR supported these results, as it also showed the highesthSSTR4expressions in the cerebral cortex and the OB. The mouseSstr4expression was somewhat lower but similar to the hSSTR4expression in Chr3 mice, with the exception of the lungs, where it was much higher, and the cerebellum and brain stem, where it was much lower. These findings are in agreement with previous data obtained in large-scale expression studies of both the human and mouse receptors [46,54–56]. In both luciferase IVIS and RT-qPCR, U1 and U2 showed some similarities inhSSTR4expression for both the pattern and level, suggesting that these two mouse lines carry a copy in the same integration site, but this needs further investigation. Each mouse showed individually different luciferase activity for both the intensity and pattern in the areas of the abdomen and the pelvis. The databases demonstrate variable SST4expression levels (from not detected to moderate) in both human and mouse gastrointestinal and reproductive systems [57–61]. The Chr3 RT-qPCR results showing the relatively highhSSTR4expression in the epididymis support this data, but the lower expression in the stomach and the intestine does not. Chr3 had the strongest luciferase signal in the area of the brain (roughly three times as much as observed in U1 and U2), and unlike U1 and U2, we could distinguish and compare the hetero- and homozygous mice. This showed a strong positive association: the double the gene, the double the signal intensity. Therefore, we selected Chr3 as the most useful mouse line and characterized the hSSTR4expression by RNAscope.
The tdTomato fluorescence was not detectable in any of the mouse lines either in vivo or in the histological sections, probably due to the low expression level of thehSSTR4 transgene. TdTomato is usually driven by a strong viral promoter like the human cy- tomegalovirus or the promoter of a mammalian housekeeping gene like elongation factor-1 alpha, to be expressed at high level for a strong fluorescent signal [62]. Furthermore, while
Int. J. Mol. Sci.2021,22, 3758 12 of 21
the tdTomato has been considered more tolerant of N-terminal fusion than the mRFP1 it was derived from [63], we observed its fluorescence to be greatly diminished in the luciferase-tdTomato fusion protein compared to the native tdTomato protein (data not shown), probably due to the disrupted folding or tetramerization of the tdTomato [64,65].
ThehSSTR4had the most prominent signal in the hippocampus (CA1 and CA2) and the cerebral cortex (Pir, S1 and PrL), which corresponds to the mouse and human databases [57–61]. RNAscope in the brain of the Chr3 mice showshSSTR4predominantly to be expressed inVglut1-positive glutamatergic excitatory neurons similarly to theSstr4 receptor in wild-type mice, although at a visibly lower expression level.hSSTR4was also expressed in GABAergic interneurons in the same regions, whereas, previously, the mouse Sstr4mRNA was detected in GABAergic neurons only in the core of the central amygdala.
In S1,hSSTR4had a higher expression in layer V than in layers II-IV, as opposed to the mouseSstr4expression [46]. In a previous study, in the OB of the wild-type mice,Sstr4 was expressed in the glomerular layer but not in the granular cell layer [66], whereas, in transgenic mice, thehSSTR4was expressed mostly in the granular layer of the OB.
Differences in the expression pattern between humanSSTR4and mouseSstr4might be due to species differences but can also result from limitations of the humanized mouse model, such as the positional effect of the integration site [51]. Therefore, these differences need to be further investigated.
We concluded that the Chr3hSSTR4mouse line showed measurablehSSTR4expres- sion, mainly in excitatory glutamatergic neurons of pain- and mood regulation-related brain regions, with several similarities and, also, some differences compared to the mouse Sstr4expression. Therefore, after confirming the receptor function, this transgenic mouse line can be a suitable translational research tool to determine the potential of SST4as an analgesic, antidepressant and anti-inflammatory drug target and to test the SST4agonist candidates during preclinical development.
4. Materials and Methods 4.1. PiggyBac Transposon Vector
Vector pPBC2 was constructed as follows: The 4 kb sequence upstream of thehSSTR4 coding region containing the promoter and putative regulatory sequences was obtained in two PCR reactions on human genomic DNA. The first segment was amplified by the forward primer 50-ATC CTC ATT CAC TAT CCT GGG AAG T-30 and reverse primer 50-CCT GGA ATC TTT CCT GTG CCT ACT T-30resulting in a 2082-bp-long fragment. The second segment containing the beginning of thehSSTR4coding region, and the immediate upstream sequence was amplified by using forward primer 50TCC TGG AAG CAC TAG CTG TTT ATC A-30and reverse primer 50-TTC ACC AGC GTC TTC TGT CTC ACC-30, producing a 2580-bp-long fragment. The two PCR fragments were cloned together at the SphI restriction site in the overlapping section, and a XhoI-SmaI fragment of it was incorporated into the construct containing the beginning of theSSTR4 coding region and 3968 bp upstream sequence. The rest of thehSSTR4coding sequence was cloned from vector pcDNA3.1(+)/SSTR4(Cat# SSTR400000; Guthrie Research Institute, Sayre, PA, USA) and fused to the previously described fragment at the unique SmaI site in the hSSTR4coding sequence. In the final construct, the coding region contains four single- nucleotide polymorphisms (SNP) compared to the humanSSTR4reference sequence [67].
These high-frequency SNPs are rs3746726 850T > G, rs2567609 897T > C, rs3746728 924C
> T and rs2567608 962T > C. The 2645-bp-long downstream genomic region behind the hSSTR4coding sequence was obtained by genomic PCR using forward primer 50-GGA GCC CTT CCC CTA CCC A-30 and reverse primer 50-TGG GTA GGG GAA GGG CTC C-30. The fragment coding the luciferase-tdTomato marker protein was cloned from vector pcDNA(+)/Luc2 = tdT (Cat#32904; Addgene, Watertown, MA, USA). The sequence coding the P2A peptide was constructed from oligonucleotides and inserted between thehSSTR4 and luciferase-tdTomato sequences. Lox2273 sites and the artificial polyA site was also assembled from oligonucleotides and inserted into the appropriate positions. Finally, the
Int. J. Mol. Sci.2021,22, 3758 13 of 21
whole construct was inserted into the pB007 PiggyBac vector (Ref# SPB-007; Transposagen, Lexington, KY, USA) to obtain the pPBC2 vector that was used for transgenesis.
4.2. Animals
B6.129P2-Sstr4tm1Szo(Sstr4KO) mice [2,22,23] were used for the transgenesis (both the zygotes and the pseudo-pregnant females), for the early breeding of transgenic mice and, later, as control animals in experiments. Distinct mouse lines were created by breeding, each containing a single copy of the transgene. The proposed name of the humanizedSSTR4 expressing mouse strain is B6.129P2-Sstr4tm1Szo-TgTn(pb-SSTR4-P2A-luc-tdTomato)1Sazo.
Animals were bred and kept in the animal house of the Department of Pharmacology and Pharmacotherapy, University of Pécs Medical School at a temperature of 22±2◦C and a 12-h light–dark cycle. Standard rodent chow and water were provided ad libitum.
4.3. Transgenesis
The transgenesis was made in commission by BioTalentum Ltd. (Gödöll˝o, Hungary).
ThehSSTR4transgene vector (pPBC2) and the super piggyBac transposase mRNA (Ref#
SPB-003; Transposagen, Lexington, KY, USA) were microinjected into the pronuclei of 56 zygotes fromSstr4KO mice, and the transfected zygotes were implanted into pseudo- pregnantSstr4KO mice that resulted in 16 transfected mice (F0 generation). These mice were genotyped by PCR for both thehSSTR4transgene and the vector backbone. Primers for thehSSTR430region: primer TR1: CTT TGC TCA TCC CTC CAT CT and primer TR2:
GTC GCT GTG CAT TTA GGA CA (product size: 883 bp). For thehSSTR450region: TR ST4 3: TTG ACG CAT GTG TTT TAT CG and TR ST4 4: ATC CTG GTA CCC ACC CAG AC (product size: 717 bp). For the plasmid origin (vector backbone 1): Cole1Ori-F: ATC GAC GCT CAA GTC AGA GG and Cole1Ori-R: CCG GAT CAA GAG CTA CCA AC (product size: 475 bp). For the Ampicillin resistance gene (vector backbone 2): Backbone ctrl Forward: GTG TCG CCC TTA TTC CCT TT and Backbone ctrl Reverse: AAC TTT ATC CGC CTC CAT CC (product size: 623 bp).
ThehSSTR4transgene without the plasmid backbone integrated into only 3 female mice from the F0 generation, and all of them were backcrossed withSstr4KO males.
4.4. Ligation-Mediated PCR
We followed the protocol and Y-linker sequences from Bryda et al. [52]. Genomic DNA was extracted from tail biopsies using the Thermo Scientific Phire Tissue Direct PCR Master Mix kit (Thermo Fisher Scientific, Waltham, MA, USA). Digestion was performed with different 30overhang creator restriction endonucleases separately: TaiI, PstI and HhaI.
Three transgene specific nested primers were designed to both 50and 30end regions of the transgene using Primer-BLAST (NCBI, Rockville Pike, Bethesda MD, USA). The nested primers were oriented to the outward of the transgene, where the Y-linker is expected to be attached, and the primers were arranged accordingly (primer 1 is furthest from the end of the transgene, and primer 3 is the closest). 50end specific primers: LM-V1B: CTA TTC AAA TTA ATA AAT AAA CCT CG, LM-V2B: TAA ACC TCG ATA TAC AGA CCG and LM-V3B:
CGA TAA AAC ACA TGC GTC AA. 30end specific primers: LM-V1: AGC TCC AGC TTT TGT TCC CTT, LM-V2: ACG ACT CAC TAT AGG GCG AAT and LM-V3: GGC GAA TTG GGT ACC GGG. The Y-linker consists of 2 partially complementary oligo DNA fragments:
Y-linker A: GTG CAG CCT TGG GTC GCC GTG T/3InvdT/(nonexpendable base end) and Y-linker E: GCA AAC GAT AAA TGC GAG GAC GGT ACA GGC CGA CCC AAG GCT GCA CT [52]. The Y-linker-specific nested PCR primers: Y-linker primer D: GCA AAC GAT AAA TGC GAG GAC GGT and Y-linker primer G: ATG CGA GGA CGG TAC AGG CCG ACC. All primers and the Y-linker were synthesized by Integrated DNA Technologies (IDT;
Coralville, IA, USA). The Y-linker was prepared by the annealing of Y-linker A and Y-linker E. The first (single round) PCR was performed with digested DNA, Taq DNA polymerase enzyme (50overhang synthesizing tendency) and transgene specific primer 1 (LM-V1 and LM-V1B in separate reactions). The Y-linker was ligated with the product of the first PCR
Int. J. Mol. Sci.2021,22, 3758 14 of 21
by T4 DNA ligase and then was amplified by 2 consecutive PCRs with nested primer pairs.
The second PCR was made with the product of ligation, Y-linker primer D and transgene specific primer 2 (LM-V2 or LM-V2B, matching to the primer 1 used in the first PCR) and the third PCR was made with the product of the second PCR, Y-linker primer G and transgene specific primer 3 (LM-V3 or LM-V3B, matching to the primer 1 and 2 used in the previous PCRs). Each was made with Phire Tissue Direct PCR Master Mix. Products of the third PCR were separated by gel electrophoresis, and all detected bands were isolated using the GeneJET Gel Extraction Kit (Thermo Fisher Scientific, Waltham, MA, USA). The nucleotide sequence of each product of the third PCR was acquired by Sanger sequencing in the commissioned BIOMI Ltd. (Gödöll˝o, Hungary). The acquired sequences were analyzed by National Center for Biotechnology Information (NCBI) Nucleotide-BLAST.
For verification of the identified loci, mouse chromosome specific (near the insertion site of the transgene) primers were designed to be paired with a LM-V3 transgene specific primer: ChrXpr1: AAC TCC TTT ACC CGC TTG CTC for chromosome X, Chr3pr2: CTG GTT CCG AGT CTC TGA GG for chromosome 3 and Chr10pr2: ATA ATG CCC CTG GCA TAG CTT TC for chromosome 10. Chr3hSSTR4mice are since genotyped routinely by LM-V3 forward primer, Chr3pr2 reverse primer and a secondary forward primer Chr3pr3:
TCA GGA GCA AGA GAG GAA GA, resulting in PCR products in the size of 527 bp for wild-type chromosomes and 683 bp for the insertedhSSTR4transgene, allowing the identification of Chr3 homozygotes and heterozygotes (Figure3).
4.5. Detecting hSSTR4 Expression by In Vivo Optical Imaging of the Luciferase Enzyme and tdTomato
For the in vivo imaging of luciferase, 8–10-week-old male animals were injected with 300 mg/kg D-luciferin sodium salt (Goldbio, St. Louis, MO, USA) intraperitoneally (i.p.) and then anaesthetized with ketamine-xylazine (100 and 5 mg/kg i.p.). The fur was removed with a fine electrical shaver. Bioluminescent imaging was performed 30 min after D-luciferin administration with the IVIS Lumina III imaging system (PerkinElmer, Waltham, MA, USA) with the following settings: exposure time 5 min and, binning 4. The bioluminescent signal of the brain was quantified as a total flux (photons/s) in equal-size regions of interest (ROI) corresponding to the top of the skull. Fluorescent optical imaging of tdTomato expression was also performed with the IVIS Lumina III imaging system. For tdTomato detection, excitation filters of 500, 520, 540 and 560 nm for spectral unmixing and an emission filter of 620 nm, auto exposure and a binning of 2 were used. After imaging, animals were placed onto a heating pad and monitored until they recovered from anesthesia.
4.6. Investigating hSSTR4-Linked tdTomato Expression in the Mouse Brain by Confocal Microscopy
After luminescent optical imaging, the animals were deeply anesthetized with an over- dose of urethane (2.4 g/kg i.p.) and perfused transcardially with 30 mL of 4% paraformalde- hyde in Millonig’s phosphate buffer. Dissected brains were postfixed for 24 h at room temperature (RT), rinsed in 1x phosphate-buffered saline (PBS) and sectioned (by 30µm) using a vibrating microtome (VT1000S, Leica Biosystems, Wetzlar, Germany). Sections were mounted on Superfrost Ultra Plus slides (Thermo Fisher Scientific, Waltham, MA, USA), air-dried for 3 h at RT and the sections were counterstained with 40,6-diamidino-2- phenylindole (DAPI) and mounted with ProLong Diamond Antifade Mountant (Thermo Fisher Scientific, Waltham, MA, USA) for confocal imaging.
Fluorescent images of PrL, BLA, S1, CA1, CA2 and Pir, according to Paxinos and Franklin [48], were acquired using an Olympus Fluoview FV-1000 laser scanning confocal microscope and FluoView FV-1000S-IX81 image acquisition software system (Olympus, Tokyo, Japan). The confocal aperture was set to 80µm. The analog sequential scanning was performed using a 40x objective lens (NA: 0.75). The optical thickness was set to 1µm, and the resolution was 1024×1024 pixels. The excitation time was set to 4µs per pixel. Virtual colors were selected to depict fluorescent signals: blue for DAPI and red for tdTomato).
Int. J. Mol. Sci.2021,22, 3758 15 of 21
Images of the two respective channels were stored both individually and superimposed to evaluate the colocalization of fluorescent signals.
4.7. Measuring Organ-Specific hSSTR4 Expression by RT-qPCR
Total RNA was extracted from WT (C57BL/6), Sstr4KO, Chr3, U1 and U2 8–10- week-old male mice from the following 14 mouse organs: bladder, brain stem, cerebellum, cerebral cortex, epididymis, heart, ileum, kidney, liver, lungs, OB, spleen, stomach and TG. TRI Reagent (Molecular Research Center, Inc., Cincinnati, OH, USA) and Direct-Zol RNA isolation kit (Zymo Research, Irvine, CA, USA) were used for total RNA extrac- tion. The concentration of the RNA samples was measured by a NanoDrop ND-2000 spectrophotometer (NanoDrop Technologies. Wilmington, DE, USA). Genomic DNA con- tamination in the RNA samples was fully digested by DNase I (Zymo Research, Irvine, CA, USA). Reverse transcription of the RNA samples was made by Maxima First Strand cDNA Synthesis Kit for RT-qPCR (Thermo Scientific, Waltham, MA, USA). Incubation for DNA digestion, DNase I heat inactivation and reverse transcription PCR were performed in a Biometra TAdvanced Twin 48/48 G3(Analitik Jena, Jena, Germany). Quantitative PCR was performed in an Applied Biosystems QuantStudio 5 Real-Time PCR System (Thermo Fisher Scientific, Waltham, MA, USA). Each reaction contained 20 ng of cDNA sample, 1X Luminaris Color HiGreen Low ROX qPCR Master Mix (Thermo Scientific, Waltham, MA, USA), 1µM of each primers and additional nuclease-free water to a total reaction volume of 20µL. The following primer pairs were used: for thehSSTR4cDNA: hSSTR4 new F:
TGG AAG GTG CTG GAG GT and hSSTR4 new R: GTT CTG GTT GCA GGG CTT; for the mouseSstr4cDNA: mSSTR4gfor: GCC CTG GTC ATC TTC GTG AT and mSSTR4grev:
ATG AAG AGC TCA TCG GCG AC and for the reference gene beta actin (Actb) cDNA:
mBACTIN F: GTC GAG TCG CGT CCA CC and mBACTIN R: GTC ATC CAT GGC GAA CTG for endogenous control. These primers were tested on KO mice (data not shown) and RT-qPCR amplification and the melting curve analysis indicated that both the human SSTR4and mouseSstr4primers are specific to their respective genes. Water control was used to check the reactions for contamination. Real-time qPCR was performed under the following conditions: 95◦C for 10 min, followed by 40 cycles of 95◦C for 30 s, 60◦C for 30 s and 72◦C for 1 min. Each reaction was carried out in a duplicate. Signal specificity was ensured by melt curve analysis. Relative expression ratios were calculated using the∆Ct method and linearized by 2ˆ-∆Ct, in which thehSSTR4expression level was compared to theActbreference gene.
4.8. Characterizing hSSTR4 Expressing Neurons in the Mouse Brain by RNAscope In Situ Hybridization
RNAscope ISH were performed on 3 to 4-month-old maleSstr4 KO andhSSTR4 Chr3 Hom mice (n= 4). Animals were deeply anesthetized with an overdose of urethan (2.4 g/kg) and perfused transcardially with 30 mL of 4% paraformaldehyde in Millonig’s phosphate buffer. Dissected brains were postfixed for 72 h at 4◦C, rinsed in 1x PBS and sectioned (by 30µm) using a vibrating microtome (VT1000S, Leica Biosystems, Wetzlar, Germany). Sections were stored in 1x PBS with 0.01% Na-azide (Merck KGaA, Darmstadt, Germany).
RNAscope assay was performed on 30-µm-thick vibratome-sliced brain sections using RNAscope Multiplex Fluorescent Reagent Kit v2 (Advanced Cell Diagnostics, Newark, CA, USA), according to the manufacturer’s protocols. Tissue pretreatment was performed by treatment with 1v/v% H2O2solution in PBS for 30 min. After PBS washes, sections were mounted on Superfrost Ultra Plus slides (Thermo Fisher Scientific, Waltham, MA, USA). Sections were air-dried for 3 h at RT and incubated at 60◦C for 60 min. After 2×10-min washes in Milli-Q (MQ) water, slides were incubated in 10% neutral buffered formalin solution (NBF, Merck KGaA) at 4◦C for 2 min. After 3×10 min MQ water rinses, sections were digested in proteinase K solution at 37◦C for 15 min (0.01 mg/ml proteinase K (EO0491, Thermo Fisher Scientific, Waltham, MA, USA) in 0.1 M Tris/HCl, pH = 8 and 0.05 M EDTA, pH = 8 buffer. After rinsing in MQ water, slides were treated with 10% NBF
Int. J. Mol. Sci.2021,22, 3758 16 of 21
at 4◦C for 2 min, followed by 3×10-min washes in MQ water. Sections were hybridized with probes specific to humanSSTR4and mouseSstr4,Vglut1andGad1, in parallel with RNAscope 3-plex mouse positive and negative control probes. Signal amplification, channel development and mounting were performed according to the manufacturer’s protocols.
Sections were counterstained with 40,6-diamidino-2-phenylindole (DAPI) and mounted with ProLong Diamond Antifade Mountant (Thermo Fisher Scientific, Waltham, MA, USA) for confocal imaging. Fluorescent images of PrL, BLA, S1, CA1, CA2 and Pir, according to Paxinos and Franklin [68], were acquired using an Olympus Fluoview FV-1000 laser scanning confocal microscope and FluoView FV-1000S-IX81 image acquisition software system (Olympus, Tokyo, Japan). The confocal aperture was set to 80µm. The analog sequential scanning was performed using a 40x objective lens (NA: 0.75). The optical thickness was set to 1µm, and the resolution was 1024×1024 pixels. The excitation time was set to 4µs per pixel. Virtual colors were selected to depict the fluorescent signals:
blue for DAPI, green for fluorescein (Vglut1mRNA), red for Cyanine 3 (hSSTR4and mSstr4mRNA) and white for Cyanine 5 (Gad1mRNA). Images of the respective four channels were stored both individually and superimposed to evaluate the co-localization of fluorescent signals.
Author Contributions:Conceptualization, Z.S., B.N., K.B., A.K., E.P. and Z.H.; methodology, Z.S., B.N., K.B., A.K., V.K. and B.G.; formal analysis, B.N., Z.S., K.B. and A.K.; investigation, B.N., Z.S., A.K., K.B., V.K., T.A., B.G. and D.H.; resources, B.N., Z.S., K.B., A.K. and V.K.; writing—original draft preparation, B.N., Z.S., A.K. and K.B.; writing—review and editing, A.K., K.B., Z.S., V.K., B.G., T.A., D.H., E.P. and Z.H.; visualization, B.N., A.K., K.B., V.K., B.G. and Z.S.; supervision, Z.S., Z.H. and E.P. and funding acquisition, Z.S., E.P. and Z.H. All authors have read and agreed to the published version of the manuscript.
Funding:This research was supported by the National Brain Research Program 2017-1.2.1-NKP-2017- 00002 (NAP-2; Chronic Pain Research Group), GINOP-2.3.2-15-2016-00050 (Peptidergic Signaling in Health and Disease; PEPSYS), EFOP 3.6.2-17-2017-00008 N (2017-2019), EFOP-3.6.1-16-2016-00004, EFOP-3.6.2-16-2017-00006, FIKPII-17886-4/23018/FEKUTSTRAT and NKFIH-OTKA-K 134214. A.K.
was sponsored by the János Bolyai Research Scholarship of the Hungarian Academy of Sciences. B.N.
was sponsored by the Talentum Fundation Scholarship of the Gedeon Richter Plc. V.K. was supported by a research grant from Medical School, University of Pécs (KA-2019-12) and by the New National Excellence Program of the Ministry for Innovation and Technology from the source of the National Research, Development and Innovation Fund (ÚNKP-20-4-II-PTE-874). Project no. TKP2020-IKA-08 has been implemented with the support provided from the National Research, Development and Innovation Fund of Hungary, financed under the 2020-4.1.1-TKP2020 funding scheme to BG.
Institutional Review Board Statement:The study was designed and conducted according to Euro- pean legislation (Directive 2010/63/EU) and Hungarian Government regulation (40/2013., II. 14.) on the protection of animals used for scientific purposes. The study was approved by the Animal Welfare Committee of the University of Pécs and the National Scientific Ethical Committee on Animal Experimentation of Hungary and licensed by the Government Office of Baranya County on 14 March 2019 (license No. BA02/2000-10/2019).
Informed Consent Statement:Not applicable.
Data Availability Statement: The data presented in this study are available on request from the corresponding author.
Acknowledgments:The authors are thankful to Miklós Kecskés for his useful suggestions for data interpretation and further functional studies, Nikolett Szentes for collecting and processing mouse organs for RT-qPCR, Lilla Draskóczi for processing mouse organs for RT-qPCR, and Tünde Bíró-Süt˝o for processing the mouse brain samples for microscopy. The in vivo imaging experiments were performed in the Small Animal Imaging Core Facility of the Szentágothai Research Centre, University of Pécs, Hungary.
Int. J. Mol. Sci.2021,22, 3758 17 of 21
Conflicts of Interest:We declare no conflict of interest. Z.H. and E.P. are the founders of PharmInVivo Ltd., Pécs, Hungary. Z.H. and E.P. are stakeholders of ALGONIST Biotechnologies GmbH, Wien, Austria. The funders had no role in the design of the study; in the collection, analyses or interpretation of data; in the writing of the manuscript or in the decision to publish the results.
Abbreviations
BLA basolateral nucleus of the amygdala BMA basomedial nucleus of the amygdala
CA1 Cornu Ammonis 1 region of the hippocampus CA2 Cornu Ammonis 2 region of the hippocampus Ct value threshold cycle value (in RT-qPCR)
dabP gene of the bacterial D site of albumin promoter (albumin D-box) binding protein DAPI 40,6-diamidino-2-phenylindole, a blue-fluorescent DNA stain
DNA deoxyribonucleic acid
FOXA2 gene of the human forkhead box A2 GABA gamma-aminobutyric acid
Gad1 gene of the mouse glutamate decarboxylase 1
Het heterozygote/heterozygous, carrying different alleles of the gene Hom homozygote/homozygous, carrying identical alleles of the gene hSSTR4 gene of human somatostatin receptor subtype 4
i.p. intraperitoneally
KO knock-out, an artificially created nonfunctional variant of the gene LM-PCR ligation-mediated polymerase chain reaction
mRNA messenger ribonucleic acid
NCBI National Center for Biotechnology Information OB olfactory bulb
Otol1 gene of the mouse otolin 1
PB piggyBac, a type of transposon system PBS phosphate-buffered saline
pcDNA plasmid cloning DNA PCR polymerase chain reaction Pir piriform cortex
Polr2a gene of the mouse RNA polymerase II subunit A polyA polyadenylation signal sequence
Ppib gene of the mouse peptidylprolyl isomerase B PrL prelimbic cortex
RT room temperature
RT-qPCR reverse transcription quantitative polymerase chain reaction S1 primary somatosensory cortex
Sis gene of the mouse sucrase-isomaltase SNP single-nucleotide polymorphism SST1-5 somatostatin receptor subtype 1-5
Sstr4 gene of mouse somatostatin receptor subtype 4 SV seminal vesicle
tdTomato tandem dimer Tomato, a red fluorescent reporter protein TG trigeminal ganglion
THBD gene of the human thrombomodulin Ubc gene of the mouse ubiquitin C
Vglut1 gene of the mouse vesicular glutamate transporter 1
WT wild type
Int. J. Mol. Sci.2021,22, 3758 18 of 21
Appendix A
Int. J. Mol. Sci. 2021, 22, x FOR PEER REVIEW 19 of 22
Appendix A
Figure A1. Representative control conditions for the RNAscope (counterstained with DAPI). RNAscope 3‐plex‐negative control specific to the bacterial dabP gene shown in the CA1 of hSSTR4 homozygote mice (A). RNAscope 3‐plex‐positive control probes specific to mouse Polr2a, Ppib and Ubc mRNA targets shown in green, red and white, respectively, in the CA1 (Bregma ‐1.46 mm) of hSSTR4 Chr3 homozygous animals (B). Human SSTR4 singleplex control shown in the CA2 (Bregma ‐1.46 mm) of hSSTR4 homozygous mice ((C), left panel). As negative tissue controls (no human SSTR4 transcript was detected in Sstr4 KO mice ((C), middle panel). Additionally, no mouse Sstr4 signal was shown in hSSTR4 homozygote mice ((C), right panel). Scale bar: 50 μm, and inset scale: 10 μm.
References
1. Baraban, S.C.; Tallent, M.K. Interneuron Diversity Series: Interneuronal Neuropeptides—Endogenous Regulators of Neuronal Excitability. Trends Neurosci. 2004, 27, 135–142, doi:10.1016/j.tins.2004.01.008.
2. Helyes, Z.; Pinter, E.; Sandor, K.; Elekes, K.; Banvolgyi, A.; Keszthelyi, D.; Szoke, E.; Toth, D.M.; Sandor, Z.; Kereskai, L.; et al.
Impaired Defense Mechanism against Inflammation, Hyperalgesia, and Airway Hyperreactivity in Somatostatin 4 Receptor Gene‐Deleted Mice. Proc. Natl. Acad. Sci. USA 2009, 106, 13088–13093, doi:10.1073/pnas.0900681106.
3. Sándor, K.; Elekes, K.; Szabó, Á.; Pintér, E.; Engström, M.; Wurster, S.; Szolcsányi, J.; Helyes, Z. Analgesic Effects of the Somatostatin Sst4 Receptor Selective Agonist J‐2156 in Acute and Chronic Pain Models. Eur. J. Pharmacol. 2006, 539, 71–75, doi:10.1016/j.ejphar.2006.03.082.
4. Pintér, E.; Pozsgai, G.; Hajna, Z.; Helyes, Z.; Szolcsányi, J. Neuropeptide Receptors as Potential Drug Targets in the Treatment of Inflammatory Conditions. Br. J. Clin. Pharmacol. 2014, 77, 5–20, doi:10.1111/bcp.12097.
5. Matsuoka, N.; Maeda, N.; Yamaguchi, I.; Satoh, M. Possible Involvement of Brain Somatostatin in the Memory Formation of Rats and the Cognitive Enhancing Action of FR121196 in Passive Avoidance Task. Brain Res. 1994, 642, 11–19, doi:10.1016/0006‐
8993(94)90900‐8.
Figure A1.Representative control conditions for the RNAscope (counterstained with DAPI). RNAscope 3-plex-negative control specific to the bacterialdabPgene shown in the CA1 ofhSSTR4homozygote mice (A). RNAscope 3-plex-positive control probes specific to mousePolr2a,PpibandUbcmRNA targets shown in green, red and white, respectively, in the CA1 (Bregma−1.46 mm) ofhSSTR4Chr3 homozygous animals (B). HumanSSTR4singleplex control shown in the CA2 (Bregma−1.46 mm) ofhSSTR4homozygous mice ((C), left panel). As negative tissue controls (no humanSSTR4transcript was detected inSstr4KO mice ((C), middle panel). Additionally, no mouseSstr4signal was shown inhSSTR4homozygote mice ((C), right panel). Scale bar: 50µm, and inset scale: 10µm.
References
1. Baraban, S.C.; Tallent, M.K. Interneuron Diversity Series: Interneuronal Neuropeptides—Endogenous Regulators of Neuronal Excitability.Trends Neurosci.2004,27, 135–142. [CrossRef] [PubMed]
2. Helyes, Z.; Pinter, E.; Sandor, K.; Elekes, K.; Banvolgyi, A.; Keszthelyi, D.; Szoke, E.; Toth, D.M.; Sandor, Z.; Kereskai, L.; et al.
Impaired Defense Mechanism against Inflammation, Hyperalgesia, and Airway Hyperreactivity in Somatostatin 4 Receptor Gene-Deleted Mice.Proc. Natl. Acad. Sci. USA2009,106, 13088–13093. [CrossRef] [PubMed]
3. Sándor, K.; Elekes, K.; Szabó, Á.; Pintér, E.; Engström, M.; Wurster, S.; Szolcsányi, J.; Helyes, Z. Analgesic Effects of the Somatostatin Sst4 Receptor Selective Agonist J-2156 in Acute and Chronic Pain Models. Eur. J. Pharmacol. 2006,539, 71–75.
[CrossRef] [PubMed]
4. Pintér, E.; Pozsgai, G.; Hajna, Z.; Helyes, Z.; Szolcsányi, J. Neuropeptide Receptors as Potential Drug Targets in the Treatment of Inflammatory Conditions.Br. J. Clin. Pharmacol.2014,77, 5–20. [CrossRef] [PubMed]
5. Matsuoka, N.; Maeda, N.; Yamaguchi, I.; Satoh, M. Possible Involvement of Brain Somatostatin in the Memory Formation of Rats and the Cognitive Enhancing Action of FR121196 in Passive Avoidance Task.Brain Res.1994,642, 11–19. [CrossRef]