Contents lists available atScienceDirect
Urban Climate
journal homepage:www.elsevier.com/locate/uclim
Generating WUDAPT Level 0 data – Current status of production and evaluation
Benjamin Bechtel
a,⁎, Paul J. Alexander
b, Christoph Beck
c, Jürgen Böhner
a, Oscar Brousse
d, Jason Ching
e, Matthias Demuzere
f, Cidália Fonte
g, Tamás Gál
h, Julia Hidalgo
i, Peter Hoffmann
j, Ariane Middel
k, Gerald Mills
l, Chao Ren
m, Linda See
n, Panagiotis Sismanidis
o, Marie-Leen Verdonck
p, Guang Xu
q, Yong Xu
raUniversity of Hamburg, Inst. of Geography, Bundesstraße 55, 20146 Hamburg, Germany
bCentral Statistics Office (CSO), Census Geography, Swords, Dublin, Ireland
cUniversity of Augsburg, Institute of Geography, Alter Postweg 118, 86159 Augsburg, Germany
dKULeuven, Department of Earth and Environmental Sciences, Division of Geography, Celestijnenlaan 200E, 3001, Leuven, Belgium
eUniversity of North Carolina at Chapel Hill, Chapel Hill, NC, United States
fLaboratory of Hydrology and Water Management, Ghent University, Coupure Links 653, B-9000 Gent, Belgium
gUniversity of Coimbra, Department of Mathematics, P-3001-501 Coimbra, Portugal
hUniversity of Szeged, Department of Climatology and Landscape Ecology, Egyetem u. 2, H-6723 Szeged, Hungary
iNational Center of Scientific Research (CNRS), Interdisciplinary Laboratory Solidarities, Society, Territories (LISST), 5, allées Antonio Machado, 31058 Toulouse, France
jClimate Service Center Germany (GERICS), Fischertwiete 1, 20095 Hamburg, Germany
kSchool of Arts, Media and Engineering, School of Computing, Informatics, and Decision Systems Engineering, Arizona State University, Tempe, AZ 85281, United States
lUCD, School of Geography, Belfield, Dublin 4, Ireland
mFaculty of Architecture, The University of Hong Kong, Hong Kong SAR, China
nInternational Institute for Applied Systems Analysis, Ecosystems Services and Management Program, Schlossplatz 1, A-2361, Laxenburg, Austria
oNational Observatory of Athens, Institute for Astronomy, Astrophysics, Space Applications and Remote Sensing, Vas. Pavlou & I. Metaxa, 15236 Penteli, Greece
pGhent University, Laboratory of forest management and spatial information techniques, Coupure Link 653, B-9000 Gent, Belgium
qMonash University, School of Earth, Atmosphere and Environment, 9 Rainforest Walk, Clayton Campus Wellington Road Clayton, VIC 3800, Australia
rSchool of Civil Engineering, Purdue University, US
A B S T R A C T
The World Urban Database and Access Portal Tools (WUDAPT) project has grown out of the need for better information on the form and function of cities globally. Cities are described using Local Climate Zones (LCZ), which are associated with a range of key urban climate model parameters and thus can serve as inputs to high resolution urban climate models. We refer to this as level 0 data for each city.
The LCZ level 0 product is produced using freely available Landsat imagery, crowdsourced training areas from the community, and the open source SAGA software. This paper outlines the protocol by which LCZ maps generated by different members of the community are produced and evaluated. In particular, the quality assessment comprises cross-validation, review, and cross-comparison with other data sets.
To date, the results from the different quality assessments show that the LCZ maps are generally of moderate quality, i.e. 50–60% overall
https://doi.org/10.1016/j.uclim.2018.10.001
Received 4 December 2017; Received in revised form 31 August 2018; Accepted 6 October 2018
⁎Corresponding author.
E-mail addresses:benjamin.bechtel@uni-hamburg.de(B. Bechtel),paul.alexander@cso.ie(P.J. Alexander),
christoph.beck@geo.uni-augsburg.de(C. Beck),juergen.boehner@uni-hamburg.de(J. Böhner),oscar.brousse@kuleuven.be(O. Brousse), matthias.demuzere@ugent.be(M. Demuzere),cfonte@mat.uc.pt(C. Fonte),tgal@geo.u-szeged.hu(T. Gál),julia.hidalgo@univ-tlse2.fr(J. Hidalgo), peter.hoffmann@hzg.de(P. Hoffmann),ariane.middel@asu.edu(A. Middel),gerald.mills@ucd.ie(G. Mills),renchao@hku.hk(C. Ren), see@iiasa.ac.at(L. See),panosis@noa.gr(P. Sismanidis),marieleen.verdonck@ugent.be(M.-L. Verdonck),guang.xu@monash.edu(G. Xu), xu1129@purdue.edu(Y. Xu).
2212-0955/ © 2018 Elsevier B.V. All rights reserved.
T
accuracy (OA), but this is much higher when considering all built-up classes together or using weights that take the morphological and climatic similarity of certain classes into account. The training data contributed by researchers from around the world also vary in quality and in the interpretation of the landscape, which affects the final quality of the LCZ maps.
The acceptable level of quality needed will depend heavily on the application of the data. However, initial modelling studies that use the level 0 products as inputs showed improved performance in simulating the urban climate when replacing the default surface descriptions with the WUDAPT level 0 data. This is also promising for the application of level 0 data in regional and global climate and weather models and supports the assumption that the current level 0 products are already of sufficient quality for certain applications. Moreover, there are various ongoing developments to improve the methods used to produce LCZ maps and their accuracy.
1. Introduction
The World Urban Database and Access Portal Tools (WUDAPT) project has grown out of the need for better information on the form and function of cities globally (Mills et al., 2015). Developed as a bottom-up initiative from members of the urban climate community, cities are being classified using the Local Climate Zone (LCZ) scheme developed byStewart and Oke (2012). Consisting of 10 urban classes and 7 natural classes (seeFig. 1b), the LCZ classification provides a rich source of information about urban areas that is consistent and comparable across cities. Although data sets of urban or built-up areas exist, they either lack detail beyond urban/
non-urban classes, e.g. the Global Human Settlement Layer (GHSL) produced by the JRC (Pesaresi et al., 2013) and the Global Urban Footprint (GUF+) product of DLR (Esch et al., 2017), or they are not available globally, e.g. the Urban Atlas 2012, which is only available for EU cities with 50,000 inhabitants or more (EEA, 2012). In addition, each LCZ has an associated range of values for a number of key urban climate model parameters. Hence, an LCZ map can be used as an input to high resolution urban climate models.
This is highly relevant as the errors in modelled urban surface energy balance components tend to be dominated more by the choice of urban canopy parameters (UCPs) than by the physics and complexity of various urban land surface models (Demuzere et al., 2017).
In addition, recent work has shown that using UCPs derived from LCZ maps can lead to improved urban climate model results (Brousse et al., 2016;Wouters et al., 2016;Hammerberg et al., 2018).
LCZ maps of the city are referred to as the ‘level 0’ product as they represent the first level of information about urban areas.
Levels 1 and 2 represent more detailed and higher resolution information; the reader is referred toChing et al. (2018)for further details. The WUDAPT community provides a procedure for generating the LCZ level 0 product, which uses freely available Landsat imagery, Google Earth for creating the training areas (TA), and the open source SAGA software (Conrad et al., 2015), embedded in a workflow that is intended to be easy to follow so that community members around the world can produce LCZ maps of their own cities. However, there are other approaches for generating LCZ level 0 products, which can also lead to the more detailed level 1 and 2 data. One approach is to sample the urban landscape using fieldwork; this requires considerable expertise as shown byHouet and Pigeon (2011)andLeconte et al. (2015)for Toulouse and Nantes, France, respectively. In other cases, where the data are available, administrative data (on building footprints, heights, green spaces, etc.) and Geographic Information System (GIS) software can be used. Raster-based methods superimpose a standard grid over the urban landscape and information about selected variables (e.g.
building height, sky view factor) can be acquired at the scale of the individual cell. Each variable represents a layer and the gridded layers are then combined using rules to generate LCZ types. This method has been used to generate LCZ maps for Hong Kong (Zheng et al., 2017), for Nagpur in India (Kotharkar and Bagade, 2018), for three medium-sized Central European cities, Brno, Hradec
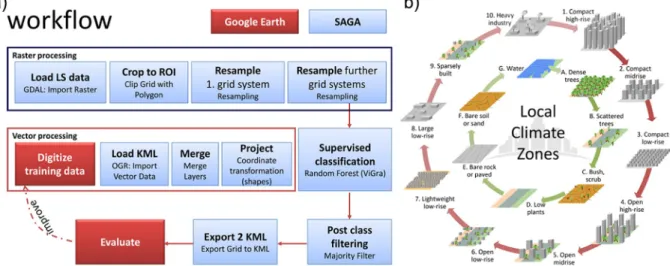
Fig. 1.a) The Local Climate Zone (LCZ) raster and vector data processing workflow (Bechtel et al., 2015). b) the LCZ types (Stewart and Oke, 2012;
Bechtel et al., 2017b).
Kralove, and Olomouc in the Czech Republic (Geletič and Lehnert, 2016) and for Bilbao in Spain (Acero et al., 2013). Vector-based methods capture the boundary of the LCZ neighbourhood and represent a more precise delineation of contiguous neighbourhood types as individual objects;Unger et al. (2014)andPerera and Emmanuel (2018)have used this method for Szeged and Colombo, respectively. Given that many different individuals are producing LCZ maps using different methods, they must go through a process of quality control before they can be uploaded to the WUDAPT portal (accessible from thewudapt.orgwebsite) for dissemination to the wider community of users (Mills et al., 2015;Ching et al., 2018).
The aim of this paper is to outline the processes by which LCZ maps generated by different members of the community are evaluated and to highlight ongoing developments in methods for improving the classification accuracy of LCZ maps. The next section gives a brief outline of the workflow for producing the WUDAPT level 0 LCZ products followed by a range of methods used in the quality control process. The paper then discusses ongoing developments in the improvement of the product and concludes with reflections on future developments of WUDAPT.
2. Production workflow
2.1. LCZ mapping and the level 0 production protocol
For LCZ mapping, a supervised machine learning approach with multispectral data from remote sensing and crowdsourced training data are used (Bechtel, 2011;Bechtel and Daneke, 2012). The universality of LCZs (Fig. 1b), coupled with their simplified representation of the urban landscape, allows users to easily identify them from satellite images using guidance provided on the WUDAPT website. To that end, the WUDAPT project aims to collect LCZ data sets for various cities around the world by involving volunteer local experts in satellite image classification. Open-access satellite imagery, such as Sentinel 2 or Landsat 8, supports the philosophy and initiative of the WUDAPT project and allows the consistent and effective application of WUDAPT's LCZ mapping scheme globally.
WUDAPT's standard LCZ classification workflow (Bechtel et al., 2015) shown inFig. 1a comprises three key operations: first the preprocessing of the satellite raster data (ideally several cloud-free images should be used that correspond to various seasons);
secondly the digitization and preprocessing of appropriate TA; and thirdly the application of the classification algorithm. To achieve the desired high quality, operations 2 and 3 should be performed iteratively until there is a good match between the classification output and the underlying urban landscape. In particular, the user should compare the classified LCZ map with the corresponding Google Earth imagery and then, based on observed inconsistencies, adjust the TAs accordingly or add additional ones. The user then re-applies the classification algorithm using the revised TA data. This iterative process should be performed as many times as needed in order to achieve a high quality LCZ map. The above three operations are performed in SAGA GIS (Conrad et al., 2015) and in Google Earth, while the satellite data are from Sentinel 2 or Landsat 8 OLI-TIRS.
The preprocessing of the Landsat 8 raster data is performed in SAGA GIS and includes the cropping of the data to the region-of- interest (ROI) boundaries and the resampling of the image data to a common-sized grid. Landsat 8 acquires data at the visible and near-infrared (VNIR), shortwave infrared (SWIR) and thermal infrared (TIR) regions of the electromagnetic spectrum. The ground sampling distance of the VNIR and SWIR bands is 30 m and 100 m for the TIR. After preprocessing, the Landsat 8 data are ready to be used in WUDAPT's LCZ classification algorithm.
The second input to the classification algorithm are the TA polygons. The required TA data are acquired by the volunteer local experts. They correspond to polygons representing continuous and homogenous LCZs over large enough patches (ideally about 1 km2) and are directly drawn in the form of vectorised KMZ files over satellite imagery provided in Google Earth. Even if LCZs are designed
Fig. 2.The LCZ production and quality assessment workflow.
as universal classes, their spectral signatures can differ across the world, across regions, or even across a city. Therefore, the TAs used should be city-specific and the users should take particular care in their selection. This is because they are the key to achieving a high LCZ classification accuracy.
After the initial selection of the TA data, the next step is the application of the LCZ classification algorithm. This operation is incorporated in SAGA GIS for the purpose of WUDAPT as discussed inBechtel et al. (2015). The classification algorithm re- commended for WUDAPT is a Random Forest classifier, which consists of integrated decision trees that classify each image pixel into one LCZ type. The random forest classifier has been selected due to its increased mapping and computational performance as de- monstrated inBechtel and Daneke (2012). Moreover, it is non-parametric which means it supports different appearances of the classes.
Once a volunteer has produced a map of sufficient high quality, the respective TA and Landsat data are submitted to the WUDAPT team. The submitted data is made available via the WUDAPT website but it is further processed in the WUDAPT production chain (Fig. 2) before inclusion in the database and portal. More specifically, whenever a training data or Landsat image file is created or modified, a hash value (a number of fixed size to identify unique data sets) is calculated and compared with the previously processed versions. If the file is new, the classification, postprocessing, and documentation process is started. This involves an automated quantitative quality assessment (see below), conversion into multiple file formats such as geoTIFF, and the creation of metadata factsheets. Finally, a manual review is done by experts (seesection 3.2). The LCZ maps are then included in the Database (DB). The LCZ maps and metadata are made accessible via the the WUDAPT portal (https://wudapt.cs.purdue.edu/), where several additional tools are available. Note that the WUDAPT portal facilitates users to utilize LCZ and related morphological and physical parameters (UCPs) for model applications using the various urban options in the Weather Research and Forecasting (WRF) modelling system (Ching et al., 2018).
3. Quality assessment
Quality assessment and control are critical for the success of WUDAPT. However, the question of how to define and measure the quality of an LCZ map is not straightforward and the appropriateness of a data set largely depends on the requirements of the applications in which the LCZ maps will be used. Fundamentally, two questions need consideration: what is the correct LCZ for a pixel and how do we best measure accuracy?
The first question is related to general matters of the appropriateness of LCZ mapping, which are discussed inBechtel et al. (2015) in detail. One problem is the fuzziness (or composite blend of typological building mixtures) that emerges from the discretisation of a multidimensional space of morphologies based on compactness, height and other properties, into discrete classes, where real neighbourhoods can have characteristics of several classes such as a mixture of high-, mid-, and low-rise buildings. Secondly, this
Fig. 3.Scale dependency of LCZ scheme; a) Centre of Berlin aerial image © Google Earth; b) building footprints from OpenStreetMap; compactness class according to the LCZ scheme at resolutions of c) 100 m, d) 250 m, e) 500 m and f) 1000 m.
depends on the spatial scale, as illustrated inFig. 3for the case of central Berlin, Germany. The building footprints from Open- StreetMap (OSM) were used to calculate the building fraction at different scales from 100 m to 1000 m, all of which fall into the range of scales given by the LCZ definition. The classes natural, sparse, open, and compact are one of the basic discriminators of the LCZ system, yet it can be seen that the results vary considerably with scale. In particular, the 1000 m scale might be the most appropriate in terms of the climatic definition of local scale, but it is too coarse to even detect central Berlin as a compact structure. On the other hand, the 100 m resolution might be the best representation but the resulting pattern is too noisy to represent homogenous local scale zones. In other words, the decision about which scale to use implies an intended level of generalisation and hence the “correct” value for a pixel also depends on its surroundings, which is inherent in the definition of a local scale zone.
The second question regarding how to measure accuracy is as challenging as the first one, since there is no global independent reference data (or ground truth) of LCZ types for urban areas. A systematic sampling of reference data would be very time consuming and counteract most of the benefits of the chosen approach, particularly in terms of efficiency. Moreover, the sampled reference data would inherit the same uncertainties in terms of human recognition of the classes or operator bias.
Therefore, three approaches are used in a combined quality assessment of the level 0 LCZ maps. The first two are cross-validation (section 3.1) and manual review (section 3.2). Together these two approaches determine whether a LCZ map is of acceptable quality and can be released openly on the WUDAPT portal. The third approach is cross-comparison with other data, which is described in more detail inSection 4.
3.1. Cross-validation
The first quality control process for the level 0 LCZ product uses an automated cross-validation approach on the original grid resolution of 100 m, which employs bootstrapping (Kaloustian and Bechtel, 2016;Bechtel et al., 2016b). The workflow is outlined inFig. 4. Boot- strapping means that a random sampling scheme is applied to estimate accuracy measures from a given sample – the TA – and control for their consistency and the stability of the results. Here a number of sub-samples are used to perform the machine learning and classification and the accuracy is evaluated with the non-used samples. Specifically, 25 different Random Forests are trained, applied, and evaluated, each using 50% of the training polygons for training (stratified by class) and the remaining 50% for testing. This sampling strategy by polygons is stricter than cross-validation by pixels, but less strict than cross-validation based on cities as used in domain adaptation and transferability experiments (Demuzere et al., in review;Yokoya et al., 2018). Thus, for mapping of single cities it is considered appropriate.
However it has to be kept in mind, that accuracies from the three types cannot be compared directly. In addition to the accuracy estimates this procedure also allows to map the percentage of runs resulting in the most frequently chosen (modal) LCZ type, which provides a spatial measure for the certainty of the results over the entire domain and not only the test polygons.
For each run, five accuracy measures are computed from the confusion matrix of the test data:
− overall accuracy (OA) for all polygons (percentage of correctly classified pixels);
− kappa, which is a standard measure accounting for accuracies of different classes;
− OA_urb, which is the OA on only the urban polygons, which is necessary since OA is often biased by large TA for natural classes (in particular water);
− OA_builtup, which is the OA of the classification in two classes only, i.e. urban and natural. LCZ E (bare rock or paved) is omitted, since it can be in both;
− weighted accuracy (WA), which is a metric that accounts for similarity and dissimilarity between classes (seeFig. 5b andBechtel et al. (2017b)for more details).
Fig. 4.Overview of the automated quality assessment workflow with bootstrapping.
Fig. 5a shows a boxplot of the distribution of these accuracies across the 25 runs for an LCZ map of Berlin. These accuracy measures are reported in the L0 meta-datasheets that accompany each LCZ map. A minimum average accuracy of 50% is required for each accuracy measure to pass the automated quality control before the product is reviewed and subsequently disseminated via the WUDAPT portal. If all accuracy measures reach a minimum level of 45%, the quality flag ‘warning’ is assigned to the data set (cf.
Fig. 4). These measures reflect the robustness of the training data but they do not indicate whether the TAs are semantically correct, only that they are consistent.
3.2. Manual review
The subsequent quality control involves a manual review of the LCZ maps, i.e. visual comparison of the map with very high resolution imagery from Google Earth. This method is used to find erroneous interpretations of the landscape by the operator and areas that are incorrectly classified and therefore need additional training data. A number of difficulties are common. These include the confusion of similar classes (such as LCZs 3 and 7, A and B, or 8, 10 and E); interpretation scales that do not match the 100 m resolution of the classifier (e.g. large areas without buildings labelled as LCZ 9); TA which are too small or too close to other LCZ types; and the use of non-persistent land covers as TA (e.g. tidal influence, rice paddies, construction sites labelled as sand (LCZ F), agricultural areas as bare soil (LCZ D). Moreover, some land cover types (e.g. green-houses) are currently not covered by the LCZ scheme or must be added to the class (e.g. snow). While some of these are actually addressed by the digitising guidelines but not always followed, others may need to be incorporated in future.
Hence, during the review the LCZ map and the TAs are carefully checked by an experienced operator against aerial imagery and auxiliary data, who then assigns one of the 3 labels to the TAs and the LCZ map: major, minor, or accept (Fig. 2). A major revision indicates that substantial disagreements were found in the interpretation of the landscape and the assignment of LCZ classes. A minor revision typically indicates a good map, which needs refinement in some classes or specific areas, while accept indicates that no improvements are required. Data sets with quality levels of minor or accept can be freely downloaded from the portal under the CC- BY-NC-SA license, while the others are currently only available upon request. However, all data sets may be revised and improved with time.
4. Comparison with other data sets
The cross-validation approach indicates consistency of the TAs but it does not evaluate the correctness of the LCZ classification. To reveal the presence of any systematic errors, the LCZ maps can be compared with other independent data sets. This section outlines a number of significant comparison activities that have been undertaken on an ad hoc basis; the purpose is to help reveal and inform improved quality control processes in the future.
4.1. GHSL
The Global Human Settlement Layer (GHSL) represents the first global and multi-decadal temporal assessment of artificial built- up surfaces (defined as containing a roof or a part of it), with built-up maps for 1975, 1990, 2000 and 2014 (Pesaresi et al., 2016).
The 2014 map was produced using 9089 Landsat 8 scenes mainly from high vegetation growing seasons. Moreover, the 2014 data set contains an experimental add-on called GHSL-LABEL, which represents a global, fine-scale multi-class urban map for better Fig. 5.a) Bootstrapping results for Berlin; b) similarity of LCZ types applied to a weighted accuracy measure. Source:Bechtel et al. (2017b).
description of the physical characteristics of human settlements and therefore a unique resource (Pesaresi et al., 2016). In GHSL- LABEL, the built-up areas are discretized into 19 types according to a set of rules, mainly considering vegetation and estimated building volume from digital surface models (Bechtel et al., 2018). The types are G-1: Other, G-2: Ice and snow, G-3: Bare soil and rocks, G-4: Shrubs and grassland, G-5: Mosaic croplands and Forest, G-6: Rain cropland, G-7: Irrigated cropland, G-8: Forest, G-9:
Occasionally water / land-water interface, G-10: Surface water, G-11: Roads, G-12: Highly reflecting roof, G-13: Very light im- pervious, G-14: Light impervious, G-15: Medium impervious, G-16: Low rise buildings, G-17: Medium rise buildings, G-18: High rise buildings, G-19: Very high rise buildings.
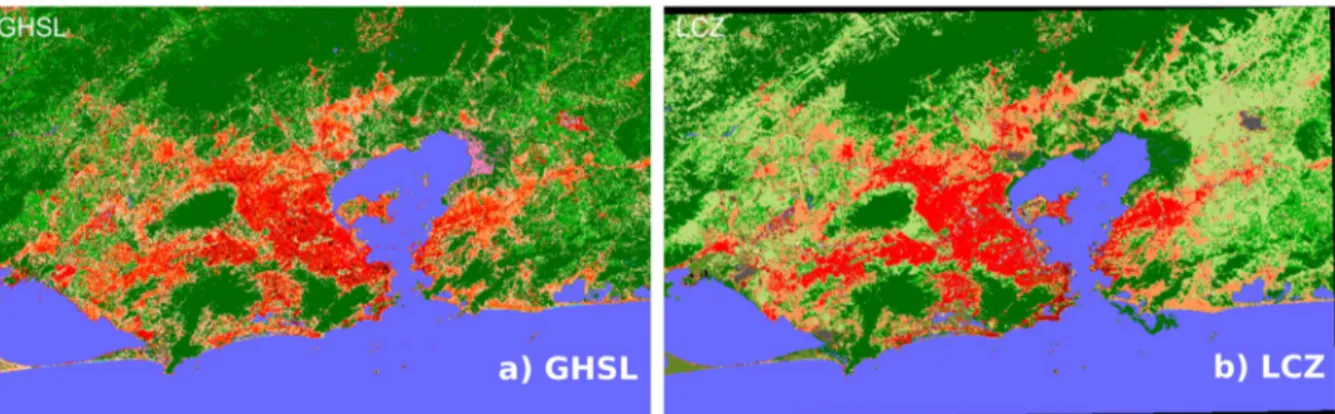
A first comparison between the GHSL-LABEL and WUDAPT-LCZ data sets was conducted inBechtel et al. (2016a)and a more comprehensive study using 50 cities on 5 continents is presented inBechtel et al. (2018). The results for Rio de Janeiro, Brazil, are shown inFig. 6andFig. 7. The comparison was conducted using aggregated class sets that account for the mismatch in scale and semantic discretisation between the two products. The LCZ maps were first projected to the GHSL-LABEL coordinate system and the corresponding tiles from the GHSL-LABEL were mosaicked to the same target grid system as the LCZ maps (Fig. 6). Both data sets were then reclassified using six aggregated classes for LCZs and four for the GHSL-LABEL product. Finally, the areal fraction occupied by each aggregated class was calculated at a 1 km resolution (Bechtel et al., 2018).
The aggregated classes for the LCZs areall built-up LCZs (1−10),no sparse(1–8,10),compact & open (1–6), compact (1–3),open (4–6),andcommercial LCZ (8)while the aggregated classes for the GHSL-LABEL areall built-up GHSL (G-1 – G-19),strong built-up (G- 16 – G-19),light-medium (G-13 – G-15),andcommercial GHSL (G-12). The correspondence between the two products was evaluated visually and quantitatively; for details seeBechtel et al. (2018).
Since the aggregated classes between the schemes do not match perfectly, they remain difficult to interpret visually, despite the use of similar colours inFig. 6. However, the scatterplots and the fraction maps reveal substantial agreement. In particular, set pairs full,built, andopen shown inFig. 7agree very well, while the correlation is high for set pair compactbut the LCZ shows higher fractions. There is a weak accordance between the two products for set paircommercial. Generally, the study showed good agreement between the all built-up aggregated classes of the GHSL-LABEL and WUDAPT-LCZ (in particular open and compact classes between both data sets), but no universal relation could be found. However, specific problems in LCZ maps typically result in lower agreement between the data sets. Therefore, the cross-comparison may become a part of the standard evaluation procedure in the future.
4.2. Comparison of pervious fraction UCP with EEA soil sealing
In addition to global data sets on urban built-up areas and their structure, the evaluation of an LCZ map can also be based on UCPs derived from these maps. However, there is currently a lack of consistent global data sets on such parameters. Yet if regional or national data sets do exist, then these can still be used to assess the quality of the UCPs derived from LCZ maps. A good reference for Europe is the EEA (European Environment Agency) soil sealing data set, which is freely available at a 20 m and 100 m resolution.
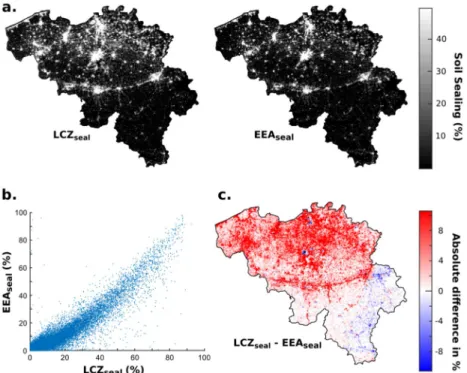
In this example, an LCZ map from Belgium (cf.Fig. 15) was evaluated using the 100 m resolution EEA soil sealing data set. The LCZ map was converted to UCPs using SAGA GIS. To derive the values per class, the average of the standard value range for the pervious fraction (PF) provided byStewart and Oke (2012)was taken for the urban classes, while for the natural classes, PF was set to 0% for rock and to 100% for all others. The soil sealing was then derived as 1 – PF. Both maps were then resampled to a common 1 km grid. The comparison of the LCZ derived soil sealing (left) and the EEA data is presented inFig. 8. It shows a good agreement and both patterns clearly show the urban footprint. The scatterplot confirms the high degree of agreement with a correlation R of 0.93.
However, it can be seen that the LCZ method slightly overestimates the soil sealing. In the difference map, it can be seen, that this bias has a spatial pattern. Generally, the soil sealing is overestimated in the North-West and underestimated in the South-East, which might be related to topography or surface characteristics and needs further investigation. In particular, the road network can be depicted, which is naturally neglected by the LCZ-based method. However, the agreement is very promising and could be improved by more specific UCP values for the area of interest. Given the enormous effort and cost to derive the EEA soil sealing product, the LCZ is seen as a very quick and efficient alternative.
Fig. 6.WUDAPT-LCZ and Global Human Settlement Layer (GHSL) LABEL maps for Rio di Janeiro, Brazil. a) the LCZ, b) GHSL-LABEL map.
Fig.7.Cross-comparisonofWUDAPT-LCZandGlobalHumanSettlementLayer(GHSL)LABELdata,fractionmapsandscatterplotsforselectedsetsofpairsofLCZandGHSL:full(GHSLallbuiltvs.LCZ allbuilt);built(GHSLallbuiltvs.LCZnosparse);compact(GHSLstrongbuiltvs.LCZcompact);open(GHSLlight-mediumvs.LCZopen);andcommercial(GHSLcommercialvs.LCZcommercial);see Bechteletal.,(2016a)fordetails.
4.3. City-specific evaluations
For some individual cities, quantitative detailed description of the morphologies, cover and UCPs are available. As a means to better evaluate the quality of WUDAPT level 0 data, selected city-specific comparisons have been performed and are presented in the sections that follow.
4.4. Dublin, Ireland
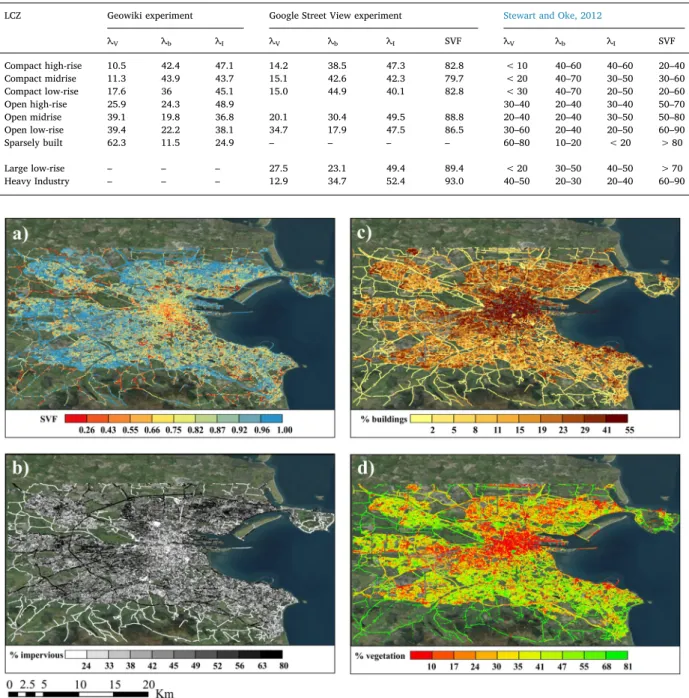
Simple techniques can also be used to generate land cover statistics to evaluate level 0 data.Mills et al. (2015)used Geo-Wiki (Fritz et al., 2012) to classify about 300,000 sample points across Dublin, Ireland into land cover types (Fig. 9). The point data were subsequently aggregated to 250 m cells and the fractional area obtained was compared against the equivalent ranges for the LCZ types assigned to that cell (Table 1). These sample data were also used to estimate the sampling density that would be hypothetically needed to derive land cover parameter values at a desired precision. A bootstrapping experiment was conducted that estimated the built and impervious fractions for each LCZ category. The results of this experiment showed that, while parameter values vary considerably with small samples, the values quickly stabilize at higher sample sizes and that most of the estimated fractions fall well within the parameter ranges given byStewart and Oke (2012).
Middel et al. (2018)andLukasczyk et al. (n.d.)developed a methodology to derive Sky View Factor (SVF), and other UCP for cities worldwide from Google Street View (GSV) imagery. They used a deep learning framework to segment 90-degree fields of view GSV image cubes into six surface type classes: buildings, trees, pervious surfaces, impervious surfaces, moving objects, and sky. The classified surfaces were then projected from the image cube onto a sphere where the fractions of each surface type were calculated. To compute SVF, the lateral and upward facing GSV images were projected onto a hemisphere, and the sky vs. non-sky pixels were evaluated using a modified Steyn method (Middel et al., 2017;Middel et al., 2018).
To assess WUDAPT level 0 data for Dublin, GSV images for 573,431 locations (complete spatial GSV coverage) were retrieved using the Google Maps API and processed. The sky and moving object fractions were removed from the 3D fraction composition, as they do not represent permanent surfaces; trees and pervious surfaces were aggregated into a vegetation class. The resulting frac- tional data for buildings, vegetation, impervious surfaces, and SVFs for Dublin were mapped (Fig. 10), and zonal averages were compared to LCZ ranges (Table 1). The surface type fractions generally fall well within the specified ranges except for heavy industry (LCZ 10) and large low-rise (LCZ 8). GSV imagery is mostly available on streets, and there were few GSV sample locations on the road network in those extensive areas so the images do not provide an accurate zonal representation. Average SVFs from GSV exhibit large deviations from LCZ parameter ranges in Dublin's compact urban areas, especially for the high-rise zone. This is most likely a classification error in the LCZ map, as European cities such as Dublin generally do not feature compact high-rise neighbourhoods with low SVFs as can be found in Manhattan or Hong Kong. This highlights the usability of Level 1 data for detecting errors in LCZ classifications.
Fig. 8.Soil sealing derived from the LCZ map for Belgium (seeFig. 15) compared to the EEA data: a) soil sealing for ROI (%) for LCZ approach (left) and EEA data (right); b) scatterplot; c) absolute difference in % soil sealing.
Fig.9.a)AerialimageofDublin©GoogleEarth;b)andc)forsubsetsoftheDublinsampledatacollectedusingGeo-Wiki(GW);d)theLCZmapforDublin;bothe)soilsealingfractionandc)builtfraction areestimatedfromtheGWsampledata.
Except for LCZ 5, which is quite rare in Dublin, the agreement between the Geowiki and GSV comparison approaches is very high.
The vegetation fraction of LCZ 5 as estimated from GSV is 19% lower than the corresponding fraction from Geo-Wiki, while the impervious fraction is 12.2% larger. This might be related to the GSV bias towards roads that underestimates horizontal pervious surfaces such as grass.
4.5. Hong Kong, China
Building height detection and extraction are well-known challenges, especially for high-density high-rise urban areas. Hong Kong Table 1
The plan fraction (%) of vegetation (λv), buildings (λb), impervious (λl) surface, and Sky View Factors (SVF) for the Dublin urban area based on the Geowiki and segmented Google Street View images along with ranges from the LCZ scheme.
LCZ Geowiki experiment Google Street View experiment Stewart and Oke, 2012
λV λb λI λV λb λI SVF λV λb λI SVF
Compact high-rise 10.5 42.4 47.1 14.2 38.5 47.3 82.8 < 10 40–60 40–60 20–40
Compact midrise 11.3 43.9 43.7 15.1 42.6 42.3 79.7 < 20 40–70 30–50 30–60
Compact low-rise 17.6 36 45.1 15.0 44.9 40.1 82.8 < 30 40–70 20–50 20–60
Open high-rise 25.9 24.3 48.9 30–40 20–40 30–40 50–70
Open midrise 39.1 19.8 36.8 20.1 30.4 49.5 88.8 20–40 20–40 30–50 50–80
Open low-rise 39.4 22.2 38.1 34.7 17.9 47.5 86.5 30–60 20–40 20–50 60–90
Sparsely built 62.3 11.5 24.9 – – – – 60–80 10–20 < 20 > 80
Large low-rise – – – 27.5 23.1 49.4 89.4 < 20 30–50 40–50 > 70
Heavy Industry – – – 12.9 34.7 52.4 93.0 40–50 20–30 20–40 60–90
Fig. 10.a) Sky View Factor; b) 3D impervious surface fraction; c) 3D building fraction; and d) 3D vegetation fraction as estimated from Google Street View imagery. Background image source (ArcGIS): Esri, DigitalGlobe, GeoEye, i-cubed, Earthstar, Geographics, CNES/Airbus DS, USDA, USGS, AEX, GEtmapping, Aerogrid, IGN, IGP, swisstopo, and the GIS User Community.
Fig.11.a)TheLCZmapforHongKong;b)TheaveragebuildingheightforHongKong.
has a particularly complicated urban morphology and inhomogeneous building heights, which rise up to hundreds of meters (Zheng et al., 2017). Thus, Hong Kong represents an interesting case for investigating the UCPs ranges in high-density urban scenarios.
First, a set of typical samples evenly distributed across the whole area using high resolution Google Street Map was selected. 3D urban morphological data were generated by using an innovative remote sensing technology and method (Xu et al., 2017a). This developed data was used to calculate the UCP ranges by LCZ for Hong Kong (Fig. 11). By aggregating the average building height information over the same LCZ sampling area, statistics for the building height for all LCZ categories were obtained (Table 2). These were compared with the standard LCZ ranges for the same parameter. The results generally agree with the standard value ranges proposed byStewart and Oke (2012). For example, LCZ 1 and LCZ 4 have the highest building height, and then LCZ 2 and LCZ 5, and LCZ 3 and LCZ 6, respectively, which is consistent with the standard scheme. The main difference is that the average building height for the areas classified as LCZ 6 in Hong Kong was above 10 m, which should belong to LCZ 5 according to the standard scheme. Also, it was observed that the average building heights for the same LCZ classes tend to be higher than the building heights under the standard scheme for European cities, which indicates that the standard scheme should be adapted to ensure that it is more suitable for some high-density urban areas. This finding also reflects the need to consider revisions to the Level 0 lookup tables or develop precise level 1 or 2 WUDAPT products for better urban applications at the city level.
4.6. Paris, Nantes and Toulouse, France
A 'bottom-up' approach based on administrative data and GIS was recently proposed to automaticallygenerate LCZ maps for French cities. A vector administrative data set was developed in the nationally-funded MApUCE project and is available at this address:http://mapuce.orbisgis.org/LCZ maps based on this databasewere obtained through a semi-automatic cluster classification method that takes regional variations intoaccount and allows for more precise definitions of the UCPs for each LCZ type (for more details seeHidalgo et al., 2018).
The classification method was tested on three cities, namely Paris, Nantes and Toulouse. These citieshave a typical European morphological structure with a denser city centre (mostly LCZ 2) surrounded bylarge urban suburbs of residential housing (LCZ 6).
The commercial and industrial developments (LCZ 8and 10) are mostly concentrated along certain axes, which mostly represent major traffic routes.However, there are also distinct differences. For example, the dense urban core of Paris is largecompared to the other two cities, while for Toulouse, a large extensive development can be seen, butadjacent to the town centre and patches of compact low-rise (LCZ 3) and open midrise (LCZ 5) can also befound.
The MApUCE maps were compared with those obtained using the ‘top-down’ approach proposed in theframework of WUDAPT level 0. WUDAPT maps were vectorized in order to obtain comparable polygonsto those of the MApUCE maps. A geographical analysis based on a comparison between MApUCE andWUDAPT for total and individual LCZ surfaces showed that although the city cores were quite wellrepresented in the WUDAPT approach in terms of urban extension, MApUCE had a better resolution forthose areas and the structure of town centres were consequently better captured. The main differencescould be found in small suburban areas with few buildings. These differences were mainly concentratedin LCZs 6, 8 and 9 but they were not homogeneous and strongly dependent on the city structure. The keydifferences were concentrated in LCZ 6 for Toulouse. For Paris, the biggest differences being found for LCZ 3 and LCZ 4 with a high over-representation by the WUDAPT methodology, 215% and 414% respectively.For Nantes, even though the classes were comparable, the built-up areas were particularlyunderrepresented (37%) in the WUDAPT data set compared to MApUCE.
4.7. Szeged, Hungary
Lelovics et al. (2014)presented a bottom-up approach to LCZ mapping using various databases and urban surface parameters. As a first step, all parameters that define the LCZ classes (Stewart and Oke, 2012) were collected on a spatial unit called lot area polygons (Gál and Unger, 2009). In the next step, the method decides on the first and second most likely LCZ category for each polygon.
Finally, the polygons are aggregated to achieve areas of adequate size, comparable to the source area of the temperature observations at 2 m height (Oke, 2004;Unger, 2009). The methodology requires many input data sets (e.g. 3D building database, Corine Land Cover, RapidEye satellite imagery, topographic maps, road database) to calculate the urban surface parameters, which is one of its main limitations; application of this method in other cities is, therefore, not a straightforward task. However, in the case of Szeged, it was possible to make a direct comparison between the bottom-up GIS method and the WUDAPT approach for creating an LCZ map.
In the WUDAPT method, the appearance of the LCZ map depends highly on the post-classification filter applied to the map. For Szeged, the optimal solution was to use a filter of 3 pixels (Fig. 12a). In the study area, LCZs 2, 3, 5, 6, 8, 9 are present from the built- up types while in the rural area, there are mainly LCZs 4 and 6 (Fig. 12a). With the GIS-based method, only the built up types can be examined, because this method is not suitable for detecting non-urban land cover types. The LCZ types and their spatial patterns are Table 2
Statistics for the mean building height (MBH) of relevant LCZs in Hong Kong.
MBH (m) LCZ_1 LCZ_2 LCZ_3 LCZ_4 LCZ_5 LCZ_6
Hong Kong 43 22 9 46 18 14
Standard (Stewart and Oke, 2012) > 25 10–25 3–10 > 25 10–25 3–10
mostly the same in the urban areas. However, there are few minor differences (Fig. 12b). The edges of the LCZs are sharper and more linearly shaped (Fig. 12b).
In total, 22% of the urban area were classified differently in the two approaches. In some places the surface materials caused differences. For example, a railroad station was identified as open low-rise in the WUDAPT method (Area 1 inFig. 12c) and as large low-rise in the GIS method. Area 2 inFig. 12c is an example that results from the post-classification filtering; the GIS method identified this area as open midrise while the WUDAPT method identified this area as large low-rise due to the surrounding areas.
Near the centre of Szeged (Area 3 inFig. 12c) an open midrise area was identified by the GIS method, but this area was filtered out by the WUDAPT method. Area 4 inFig. 12c was identified as open low-rise by the GIS method and open midrise by WUDAPT but this area is so complex that the correct class is open to interpretation.
Based on these results the highly data-intensive GIS method and globally applicable WUDAPT method produce largely consistent maps with slight differences, which can mostly be related to unique surface characteristics (e.g. railroads) or the post-classification filtering. Thus, by using the WUDAPT mapping protocol, a fairly accurate LCZ map can be produced. Hence the use of the data- intensive GIS method may not be worth the effort needed to collect all the necessary data layers.
4.8. Augsburg, Germany
Since the original intent of the LCZ scheme was informed planning and documentation of station networks, it is interesting to see if the classes depicted with the standard workflow do exhibit climatic differences. Therefore, a climatic evaluation of an LCZ map determined according to the WUDAPT standard LCZ classification workflow has been performed for Augsburg, Germany, and its surroundings.
The evaluations were based on air temperature measurements from a logger network including 80 sites and cover the period since December 2012 (varying among sites). Approximately 50 sites could be clearly assigned to specific LCZ classes that are present in the Augsburg region (LCZs 2, 5, 6, 8, A, B, D). Air temperature differences between each site and a rural reference station (Augsburg- Mühlhausen from Deutscher Wetterdienst) have been derived utilizing respective hourly mean data. Analyses of the air temperature Fig. 12.The LCZ map of Szeged obtained using a) the WUDAPT method using a post-classification filter of 3 pixels and b) the GIS method (Lelovics et al., 2014). c) Examples of differences between the WUDAPT and GIS methods are identified as described in the text.
differences have been performed stratified according to LCZ classes, season, time of the day and as well synoptic situation (as characterized by wind and cloudiness).
In general, distinct differences in air temperature among LCZ classes and with respect to the rural reference station were found. In particular positive temperature deviations appear – in decreasing order – for the built up categories compact midrise, open midrise, large lowrise and open lowrise. Concerning the natural categories air temperatures decrease from low plants to dense trees and scattered trees. For calm (windspeed 0 - 2 m/s) and clear (cloud cover 0–2 octas) conditions and over all seasons and times of the day the medians of the temperature differences between LCZs and rural reference station were 3.4 K (LCZ 2), 1.8 K (LCZ 5), 1.4 K (LCZ 6), 2.0 K (LCZ 8), 0.7 K (LCZ A), −0.1 K (LCZ B) and 1.0 K (LCZ D), which confirms the climatic relevance of the LCZ map of Augsburg.
More detailed information on the variations in temperature characteristics of LCZs according to season, time of the day and synoptic boundary can be found in (Beck et al., 2018) and are in good accordance with findings for other cities, e.g. Berlin, Germany (Fenner et al., 2017).
5. Ongoing developments 5.1. Evaluation of the human factor
In addition to the quality control processes described in the previous section, the HUMan Influence EXperiment (HUMINEX) was run in 2016 to evaluate the impact of individual perception and bias on the LCZ mapping accuracy of different cities around the world (Bechtel et al., 2017b). The overall aims were to (1) investigate the quality of LCZ maps produced by different individuals using the WUDAPT methodology; and (2) investigate how the mapping accuracy can be improved, e.g., by revision of the initial training data or by combining crowdsourced data from several operators to create a single LCZ map.
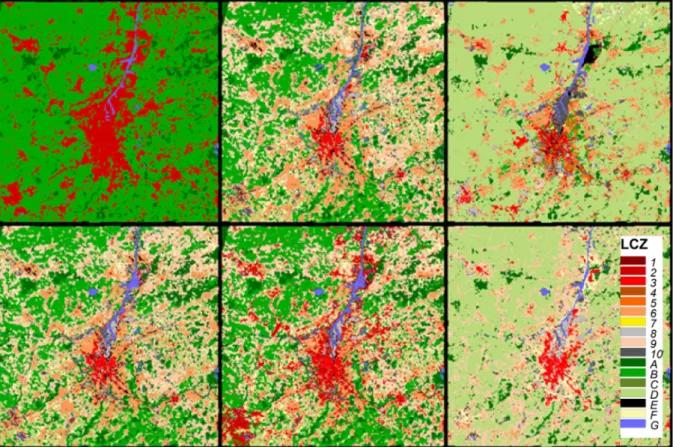
The results showed large differences between LCZ maps for a single city developed by different operators; seeFig. 13for an example of LCZ maps for Ghent, Belgium. The consistency and accuracy measures used to evaluate the quality indicated that both the quality of the TA data sets and the resulting LCZ maps were poor to moderate.
Often the duration of the exercise was too short to perform iterations until the classification results converged to an acceptable result. As such, the number of iterations was low, and sometimes only the final TA set was delivered. Due to inconsistencies in the number and type of classes present in the different study areas, region of interest etc., inter-city comparison was difficult if not impossible. Large discrepancies were found in the OA for different cities, e.g. in coastal cities, where high OAs are reached because
Fig. 13.Different LCZ maps for Ghent Each map was produced with training data from a different operator as part of the HUMan INfluence EXperiment (HUMINEX) (Bechtel et al., 2017b).
water can be classified correctly with greater ease compared to other urban LCZ types.
Secondly, the HUMINEX showed that it is more difficult for untrained operators to identify TAs correctly. Human interpretation is generally known to be difficult in remote sensing (Van Coillie et al., 2014) and crowdsourcing (See et al., 2013;See et al., 2016). The results also showed that the recommendations for delineating TAs are often neglected or forgotten, resulting in TAs that differ from the instructions regarding size, shape and distance from other LCZs. In summary, it can be stated that: (1) operator knowledge is critical and therefore in the second phase of the experiment, a driver's test will be provided to teach operators how to correctly delineate the TAs; and (2) independent controls are necessary. However, the results also showed that the quality of the classifications clearly improved with the number of iterations (Fig. 14), which indicates that the existing WUDAPT protocol is a valid approach for LCZ mapping, despite some difficulties in using untrained operators for gathering crowdsourced data.
Finally, considerable improvement in the LCZ maps can be achieved by combining multiple training data sets from different operators, which is evidence for the ‘wisdom of the crowd’. Using the mode of all available classifications or using multiple training data sets for one classification can produce higher accuracies than the mean accuracy of individual classifications of a city, especially for the urban LCZ types. The results showed, however, that after ten to fifteen TA sets, the increase in accuracy saturates and the LCZ map does not improve anymore. From these results, the HUMINEX concludes that at least ten individual TA sets from untrained operators should be used for one city to produce an LCZ map of good quality, although this aspect needs further investigation (Bechtel et al., 2017b).
5.2. Improvements in LCZ mapping
The quality approaches described in this paper are generally being applied to LCZ maps developed using the WUDAPT production workflow as described insection 2. However, there are many ongoing developments with respect to improving the actual method used to derive the LCZ maps (Bechtel et al., 2017a) and hence improve their overall quality. These include the transferability of TAs, the use of new data sets and features and new approaches to LCZ classification.
A global LCZ map database that has been derived from a uniform classification model is needed to perform standardized urban climate studies globally. However, TAs are not yet available for every city around the world. Hence it would be useful to determine whether TAs from one city can be used to create LCZ maps in another city where no training data exists. Due to different bio-physical backgrounds, altitudes, and image characteristics, classification models are not always effectively transferable, as discovered by Kaloustian et al. (2017)for Lebanon and Syria.
In order to overcome this problem, it is important to develop a robust generalized classification model. This was also the purpose of the 2017 Data Fusion Contest (Tuia et al., 2017a) run by the Image Analysis and Data Fusion Technical Committee (IADF TC) of the IEEE Geoscience and Remote Sensing Society. In this edition of the annual image analysis challenge, the teams were provided with a set of free and open data from Landsat 8, Sentinel 2, and OSM as well as training labels from a selection of training cities (Berlin, Rome, Paris, São Paulo, Hong Kong). In the second step, participants received the same data without the labels from a second set of cities (Amsterdam, Chicago, Madrid, and Xi'an) and the teams were invited to upload classified maps of the test cities to an evaluation server. > 500 teams from over 50 countries downloaded the data and a total of 857 sets of maps were uploaded, which is seen as a great success for the prominence of WUDAPT in the Image Analysis community. The best team reached an overall accuracy of 74.9%
(Tuia et al., 2017a), which is impressively high compared to the standard method used (as described insection 2). The best per- forming teams used a number of state of the art machine learning methods such as Random Forest (including Rotation Forests and decision tree approaches), Boosting, Deep Learning, and expert handcrafted features (seeYokoya et al., 2018, also for the detailed methods of the two winning teams).
Among the four winning teams, the WUDAPT team of CUHK proposed a co-training based approach to generate high-quality LCZ maps for new target cities without the need for training samples (Xu et al., 2017c). The approach included four main stages. First, a novel feature extraction approach was employed to generate spectral-spatial features from the original Landsat 8 and Sentinel 2 satellite data. Second, the spectral-spatial features derived from both satellite and land cover data were combined to train two
Fig. 14.HUMINEX results for different iterations for Leuven; a) boxplots; b) individual operators.
independent classifiers based on different combinations of features. Third, a co-training approach was designed to adapt the model to suit the target cities, in which two original classifiers were iteratively modified by adding new valid samples from target cities.
Finally, a combination of the co-training approach with other classifiers, such as a support vector machine (SVM), was used to further enhance the final classification accuracy.
The proposed approach has several advantages. First, multi-source satellite data are well integrated into a multi-view model to achieve improved LCZ classification results. Second, the classifiers based on source cities were iteratively adapted into the target cities by adding more valid samples. The experimental results showed that the proposed approach could derive LCZ maps for the four testing cities with an OA of about 70%, which is over 10% more accurate than conventional approaches with the same settings.
Compared with conventional approaches, the novel approach does not need prior knowledge about the target cities, and it can automatically generate worldwide LCZ maps to support urban-climate studies for cities in the world.
Incorporating more data sources in online processing platforms can also help to address the issue of transferability. This includes the use of different Earth observation data sets such as Sentinel 1, Sentinel 2 and the Defense Meteorological Program (DMSP) Operational Linescan System (OLS) night-time lights product. Such online processing platforms can also facilitate implementation of the online cross-validation bootstrapping procedure (seesection 3.1), and provide the ability to scale-up from single cities over countries to continents. The latter is illustrated inFig. 15, which provides an example LCZ map for Belgium processed using Google Earth Engine (Gorelick et al., 2017), which used seasonal Landsat 8 composites and TAs from Antwerp, Brussels, Ghent and Leuven (Verdonck et al., 2017;Bechtel et al., 2017b).
Considering the limitations of moderate resolution satellite images, other types of data sets should be included in LCZ mapping, such as ASTER, Sentinel 2, SAR (synthetic-aperture radar) data (e.g. from Sentinel 1), OSM and GSV images.Xu et al. (2017b)found that including textural information from Landsat and ASTER data can achieve much better results for LCZ mapping whileKaloustian et al. (2017)found that thermal or SAR data without multispectral data resulted in lower accuracies. Data from OSM have also been found to be helpful for the LCZ classification, especially for the natural land cover classes (A to F).Lopes et al. (2017)investigated the use OSM data to enhance the development of LCZs, complement the existing data sources, and improve the accuracy of the maps by a fuzzy logic approach and a weighted combination method and achieved improvements for some classes, in terms of accuracy and representation on the map. To obtain better prediction accuracy for urban types, Google Street View images have also proven to be helpful with the assistance of deep learning technology (Xu et al., 2018). Moreover, very high resolution aerial imagery obtained from commercial satellites and UAVs should be beneficial for accurate LCZ mapping but have not yet been explored in detail.
In addition to pixel-based supervised classification approaches, many other methods are being explored for better LCZ classifi- cation, such as object-based image recognition and the inclusion of neighbourhood information. For example,Casonne (2016)found that the object-based and pixel-based accuracies were comparable when using Landsat 8 data at a 30 m resolution whileVerdonck et al. (2017)found that a contextual classifier that included neighbourhood information showed improved discrimination, especially for the built-up classes. In another study,Tuia et al. (2017b)showed that a Markov model that captures spatial interactions between classes was beneficial for LCZ mapping. To better extract contextual information, deep learning technologies could also be further studied in the future to extract high level image features for improving the classification accuracy.
5.3. Application of level 0 data
One of the challenges in terms of model applications has been the description of urban areas in both meso- and micro-scale modelling frameworks. Traditionally, providing the requisite level of surface information for such models has restricted model applications to individual sites (Ward et al., 2016), or led to an oversimplification of the urban form within the models. One of the
Fig. 15.LCZ map of Belgium produced with Google Earth Engine.
Fig.16.UrbanCanopyparametersderivedfromtheLCZmapofMilan,Italy;a)Albedo;b)builtfractionin%;c)canopyheightinm;d)Davenportroughnessclass(DRC).
advantages of level 0 data has been to readily provide the required parameter information for urban climate models (Fig. 16) to enable intra-urban differentiation in terms of both surface fluxes and air temperatures (Hammerberg et al., 2018) for multiple cities.
For example, it has been demonstrated that level 0 data can be used to satisfactorily run urban-scale models (Alexander et al., 2015) without compromising significantly on the model's ability to simulate the urban energy budget, nor the ability of these models to differentiate between various urban densities, i.e. highly urban, suburban, and non-urban. This has the advantage of providing surface parameters in a consistent manner across domains, which enables inter-city comparisons to be undertaken in a consistent manner (Alexander et al., 2016). It was hence assumed that those parameters derived from the LCZ classification may be im- plemented in different urban canopy models embedded in different regional climate models (Demuzere et al., 2017).
A pioneering study over Madrid, Spain, byBrousse et al. (2016)demonstrated that the BEP-BEM model (Salamanca et al., 2011) within the WRF model (Chen et al., 2011) was sensitive to the heterogeneity of the landscape obtained from the LCZ mapping.
Indeed, an improvement of about 10% in the statistical indicators (RMSE and Mean Bias) for the air temperature in both summer and winter cases at a 333 m horizontal resolution was observed when compared with 30 official weather stations and CORINE land cover as an input. Researchers in Hong Kong have adopted the WUDAPT level 0 method to generate historical LCZ maps of the Pearl River Delta Region, which were used as input data to the WRF model. The results showed that the effects of local urbanization can be examined if historical urban morphological data are available (Ren et al., 2017). These results supported the idea that more trust- worthy results and new insights into urban climate impacts could be obtained by better defining the urban morphology in terms of form and function when compared with the use of simpler binary (i.e. urban/rural) or ternary (i.e. low density/high density/others) classifications.
Other work in this area includes investigation into the added value of detailed data sets and their impact on urban climate modelling performance. For example, some studies have made use of GIS techniques for mapping LCZs (Gál et al., 2015;Zheng et al., 2017), while a study in Vienna, Austria, tried to quantify the required detail needed for WRF modelling (Hammerberg et al., 2018).
The same protocol was applied and the model results were compared to a network of 150 stations coming out of official and personal
Fig. 17.Different LCZ morphological parameterisations of the city of Vienna, Austria in the BEP-BEM model, embedded in the WRF climate model, by source of parameters. A detailed building parameter GIS dataset is used for Vienna GIS and LCZs' ranges of parameters are used for WUDAPT. In the Vienna GIS case, heights are aggregated to 5 m intervals (the 5 m value represents heights from 0 to 5 m, etc.). See Hammerberg et al. (2018) for details.
weather station network measurements for different cases. One case made use of a detailed data set derived from GIS data (Fig. 17), accessible within the city boundary of Vienna, while the other was parameterized using an LCZ map created using the WUDAPT protocol and its related morphological parameters.
In the current state of regional and urban climate development, when looking at the biases of both runs, there was no tangible added value in using the detailed GIS data for mesocale urban climate modelling. Indeed, the overall RMSE for the five periods were 2.61 °C and 2.65 °C for the GIS and WUDAPT cases, respectively, while the mean biases were 0.56 °C and 0.62 °C. However, the two different urban structures resulted in model differences of up to 1 °C during summer time. This implies that the small differences in performance between the two structures is a result of multiple sources of errors, which are described in more detail inHammerberg et al. (2018). Therefore, the detail of urban morphological information in an LCZ map may already be sufficient for some model applications. Similarly, level 0 enables a first-pass assessment of the urban climate at sufficient detail to engage decision makers (Picone and Campo, 2015).
6. Conclusions
The WUDAPT initiative is producing LCZ maps for many cities around the world, contributed by a community of researchers interested in creating a global database of the form and function of cities for urban climate modelling and other applications. Before the LCZ maps are released to the wider community via the WUDAPT portal, they must undergo quality assessment and are then published with metadata related to the quality achieved. Different approaches used in the quality assessment process were high- lighted in this paper. In particular the bootstrapping cross-validation and the review were described, which are currently part of the standard LCZ quality assessment procedure. In addition, comparisons with independent data sets of urban structure and urban canopy parameters at country and city level were presented, where some of these additional approaches may become included in the standard quality assessment protocol in future.
To date, the results from the different quality processes show that the LCZ maps are generally of moderate quality, i.e. 50–60%
OA, but this is much higher when considering all built-up classes together or using weights that take the morphological and climatic similarity of certain classes into account. Currently the training data for the LCZs are contributed by researchers from around the world, which can be very different and can affect the final quality of the LCZ maps. One reason is that some LCZ classes are difficult to distinguish from satellite imagery and it requires expert knowledge or training to create a suitable TA set. Another reason is that people may have different opinions when interpreting LCZ types. The impact of the operators on the classification accuracy was found to be considerable based on experiences from the HUMINEX, which stresses the necessity of strict quality assessment and review.
Some classes are specifically challenging, i.e. LCZ 9 (sparsely built), which is a built type but has low build fraction.
What is considered an acceptable quality will depend upon the application. For example, the LCZ maps might be resampled to a coarser resolution for input into global atmospheric models and be less sensitive to accuracy at the 100 m resolution. Therefore, different accuracy measures are used which allows evaluation specific to the purpose. Experimentation will need to be undertaken to better understand the desirable and acceptable accuracies for different applications. Initial modelling studies, however, showed improved performance in simulating the urban climate when replacing standard surface descriptions by WUDAPT level 0 data, which is promising for its application in regional and global climate modelling experiments and weather forecasts but likewise supports the assumption of sufficient detail for certain model applications. Moreover, WUDAPT level 0 maps have been found to agree with observed temperature differences, which is also encouraging for their further use.
In parallel, there are ongoing developments to improve the methods used to produce LCZ maps and hence the accuracy, e.g.
through the addition of other types of data sources such as SAR images, very high resolution images, and ground level images such as Google Street View, as well as experimentation with other classification algorithms and deep learning techniques. Additional efforts to generate spatially precise UCPs, the so-called Level 1 and 2 data, are described elsewhere in this special issue.
Acknowledgements
Most of all we thank all WUDAPT contributors. This work was partly supported by the Cluster of Excellence ‘CliSAP’ (EXC177), University of Hamburg, funded through the German Science Foundation (DFG), the German Academic Exchange Service (DAAD) (Project ID 57320776), the research project ‘Cities in Change–Development of a multi-sectoral urban-development–impact model (UrbMod)’ (LFF-FV17), funded by the State of Hamburg, the EU FP7 funded ERC grant Crowdland (No. 617754), the Hungarian Scientific Research Fund (NKFI K 120346) and by the ÚNKP-17-4 New National Excellence Program of the Ministry of Human Capacities. Work on French cities was funded by the French National Research Agency (Agence Nationale de la Recherche) under grant #ANR-13-VBDU-004. Matthias Demuzere is funded by the Belgian Science Policy Office (BELSPO) in the framework of the STEREO III programme, project SAT-EX (SR/00/306). This study is partially supported by the Vice-Chancellor's One-off Discretionary Fund of The Chinese University of Hong Kong titled “World-wide Urban Data Bank on Physical Forms of Cities & Impact Studies of Urban Forms on Human Comfort, Health and Environment Well-being” and the General Research Fund Project Grants (Project No.:
RGC-GRF 14611015 & 14,643,816) of Hong Kong Research Grants Council.
References
Acero, J.A., Arrizabalaga, J., Kupski, S., Katzschner, L., 2013. Deriving an Urban climate Map in coastal areas with complex terrain in the Basque Country (Spain).
Urban Clim. 4, 35–60.https://doi.org/10.1016/j.uclim.2013.02.002.