Computers in Biology and Medicine 142 (2022) 105204
Available online 4 January 2022
0010-4825/© 2022 Elsevier Ltd. All rights reserved.
Understanding the bias in machine learning systems for cardiovascular disease risk assessment: The first of its kind review
Jasjit S. Suri
a,*, Mrinalini Bhagawati
b, Sudip Paul
b, Athanasios Protogeron
c,
Petros P. Sfikakis
d, George D. Kitas
e, Narendra N. Khanna
f, Zoltan Ruzsa
g, Aditya M. Sharma
h, Sanjay Saxena
i, Gavino Faa
j, Kosmas I. Paraskevas
k, John R. Laird
l, Amer M. Johri
m,
Luca Saba
n, Manudeep Kalra
oaStroke Diagnostic and Monitoring Division, AtheroPoint™, Roseville, CA, USA
bDepartment of Biomedical Engineering, North-Eastern Hill University, Shillong, India
cDepartment of Cardiovascular Prevention & Research Unit Clinic & Laboratory of Pathophysiology, National and Kapodistrian University of Athens, Greece
dRheumatology Unit, National Kapodistrian University of Athens, Greece
eArthritis Research UK Centre for Epidemiology, Manchester University, Manchester, UK
fDepartment of Cardiology, Indraprastha APOLLO Hospitals, New Delhi, India
gSemmelweis University, Budapest, Hungary
hDivision of Cardiovascular Medicine, University of Virginia, Charlottesville, VA, USA
iDepartment of CSE, International Institute of Information Technology, Bhubaneswar, India
jDepartment of Pathology, A.O.U., di Cagliari -Polo di Monserrato s.s, Cagliari, Italy
kDepartment of Vascular Surgery, Central Clinic of Athens, N. Iraklio, Athens, 14122, Greece
lCardiology Department, St. Helena Hospital, St. Helena, CA, USA
mDepartment of Medicine, Division of Cardiology, Queen’s University, Kingston, Canada
nDepartment of Radiology, University of Cagliari, Italy
oDepartment of Radiology, Massachusetts General Hospital, Boston, MA, USA
A R T I C L E I N F O Keywords:
Risk prediction Coronary artery disease Carotid ultrasound Artificial intelligence Bias
Gold standard And unseen data
A B S T R A C T
Background: Artificial Intelligence (AI), in particular, machine learning (ML) has shown promising results in coronary artery disease (CAD) or cardiovascular disease (CVD) risk prediction. Bias in ML systems is of great interest due to its over-performance and poor clinical delivery. The main objective is to understand the nature of risk-of-bias (RoB) in ML and non-ML studies for CVD risk prediction.
Methods: PRISMA model was used to shortlisting 117 studies, which were analyzed to understand the RoB in ML and non-ML using 46 and 32 attributes, respectively. The mean score for each study was computed and then ranked into three ML and non-ML bias categories, namely low-bias (LB), moderate-bias (MB), and high-bias (HB), derived using two cutoffs. Further, bias computation was validated using the analytical slope method.
Results: Five types of the gold standard were identified in the ML design for CAD/CVD risk prediction. The low- moderate and moderate-high bias cutoffs for 24 ML studies (5, 10, and 9 studies for each LB, MB, and HB) and 14 non-ML (3, 4, and 7 studies for each LB, MB, and HB) were in the range of 1.5 to 1.95. BiasML < Biasnon-ML by
~43%. A set of recommendations were proposed for lowering RoB.
Conclusion: ML showed a lower bias compared to non-ML. For a robust ML-based CAD/CVD prediction design, it is vital to have (i) stronger outcomes like death or CAC score or coronary artery stenosis; (ii) ensuring scientific/
clinical validation; (iii) adaptation of multiethnic groups while practicing unseen AI; (iv) amalgamation of conventional, laboratory, image-based and medication-based biomarkers.
1. Introduction
Cardiovascular disease (CVD) is one of the leading causes of
mortality with 18 million deaths worldwide [1]. The ultimate cause of CVD is atherosclerotic vascular disease and its formation in the heart’s coronary arteries [2]. The CVD risk worsens due to comorbidities like diabetes [3], chronic kidney disease [4,5], rheumatoid arthritis [6,7],
* Corresponding author. Stroke Monitoring and Diagnostic Division, AtheroPoint™, Roseville, CA, 95661, USA.
E-mail address: jasjit.suri@atheropoint.com (J.S. Suri).
Contents lists available at ScienceDirect
Computers in Biology and Medicine
journal homepage: www.elsevier.com/locate/compbiomed
https://doi.org/10.1016/j.compbiomed.2021.105204
Received 28 November 2021; Received in revised form 29 December 2021; Accepted 29 December 2021
hypertension [8], and high-lipids [9]. This puts patients with heart disease and stroke at greater risk, and therefore there is a need for early CVD risk detection.
There are popular calculators used for CVD risk assessment such as the QRISK3 calculator [10], Framingham risk score (FRS) [11], the systematic coronary risk evaluation score (SCORE) [12], the Reynolds risk score (RRS) [13], and the atherosclerosis cardiovascular disease (ASCVD) [14]. Typically, these calculators use conventional and indirect risk factors (or office-based biomarkers (OBBM)) and laboratory-based biomarkers (LBBM) [15,16]. These risk prediction algorithms follow specific guidelines such as the European Society of Cardiology (ESC) and the American College of Cardiology/American Heart Association (ACC/AHA) [17,18]. However, these CVD calculators offer challenges such as (i) being unable to handle the non-linear relationship between these risk factors (or covariates) and outcomes and (ii) lacking the CVD risk of granularity [19–21]. Thus, there is a clear need for a more ac- curate CVD risk assessment solution that can measure true atheroscle- rotic non-invasive plaque burdens along with OBBM and LBBM, rather than indirect risk factors.
Recent research suggests that coronary artery disease (CAD) risk prediction can be determined via the carotid artery framework. Because of the same genetic makeup in these two sets of arteries, this gives an added advantage of both CVD and stroke risk assessments [22–24].
Because of this, carotid artery imaging has been quite regularly adapted as a surrogate biomarker for CVD risk assessment [25–30]. Generally, the three major medical imaging modalities, such as magnetic resonance imaging (MRI) [31], computed tomography (CT) [32], and ultrasound (US) [33,34] have been adapted for screening the carotid artery [35].
Among these, B-mode carotid US offers several advantages such as small footprint, economic, superior ergonomics, easy access via neck window, and ability to produce high-resolution images (due to compound and harmonic image reconstruction) [36,37]. These imaging modalities can
be used for extracting carotid ultrasound image-based phenotypes (CUSIP), such as carotid intima-media thickness (cIMT), intima-media thickness variability (IMTV), maximum plaque height (MPH) [38], total plaque area (TPA) derived from common carotid artery or carotid bulb [39–41], which can be used for CVD risk computation [42–46].
These image-based CUSIP biomarkers, when fused with OBBM and LBBM further improve the reliability of the CVD risk assessment system as shown by AtheroEdge 2.0 (Roseville, CA, USA) [6,7,20,44,47–49];
however, these biomarkers do not address the non-linearity between the biomarkers and outcomes. Thus, we need a more advanced solution that can handle this challenge.
Artificial Intelligence (AI) has opened the door in all walks of life, particularly in the healthcare sector, and more precisely in medical imaging [50,51]. Machine learning (ML), the subcategory of AI has further dominated the field of the medical imaging industry and recently in diagnosing diabetes [52,53], and several types of cancers namely, liver [54–56], thyroid [57,58], coronary [48,59,60], prostate [61], ovarian [62], and skin [63,64]. Since the covariates and outcomes can handle the non-linearity, these ML models are more suited for CVD risk computations. Other applications of ML include plaque tissue charac- terization (PTC) for stroke risk, particularly for the classification of symptomatic vs. asymptomatic plaque [65–68]. These ML methods have shown higher classification accuracy or higher performance; however, they lack (a) robust outcome design (choice of the gold standard) and (b) the clinical delivery component while over-performing the accuracy of the ML system, which in turn leads to bias in ML.
This study analyzes the bias in these ML-based and non-ML-based studies for CVD risk assessment. We discovered five types of outcomes (gold standard) for ML design such as (i) death [69–72], (ii) coronary artery calcification (CAC) or coronary artery stenosis [73–79], (iii) different heart conditions like myocardial infarction, stroke, angina, and coronary artery syndrome (CAS) [80–86], (iv) chronic disease like Acronym table
Abb*Definition
ACC American College of Cardiology AHA American Heart Association ANOVA Analysis of variance
ASCVD Atherosclerotic cardiovascular disease AUC Area-under-the-curve
BMI Body mass index
CAC Coronary artery calcification CAD Coronary artery disease CAS Coronary artery syndrome
CCVRC Conventional cardiovascular risk cal#
CHD Coronary Heart Disease cIMT Carotid Intima-Media Thickness CKD Chronic kidney disease CT Computed Tomography
CUSIP Carotid ultrasound image phenotype CV Cross-validation
CVD Cardiovascular disease CVE Cardiovascular events DL Deep learning DM Diabetes mellitus
EEGS Event-equivalent gold standard ESC European Society of Cardiology FH Family history
FNR False-negative rate FPR False-positive rate FRS Framingham risk score GUI Graphical user interface
HTN Hypertension
IMTV Intima-media thickness variability IPN Intraplaque neovascularization LBBM Laboratory-based biomarker LSTM Long short-term memory network MedUSE Medication use
ML Machine learning MPH Maximum plaque height MRI Magnetic Resonance Imaging NPV Negative predictive value Non-ML Non-machine learning OBBM Office-based biomarker
PE Performance evaluation matrices PPV Positive predictive value PTC Plaque tissue characterization
QRISK3 QResearch cardiovascular risk algorithm RA Rheumatoid arthritis
RF Random forest RoB Risk of bias
ROC Receiver operating-characteristics RRS Reynolds risk score
SCORE Systematic coronary risk evaluation SMOTE Synthetic minority over-sampling technique SVM Support vector machine
TPA Total plaque area US Ultrasound
WHO World Health Organization Abb* Abbreviation
# Calculator
diabetes, hypertension, and chronic kidney disease (CKD) [87–89], and (v) event-equivalent gold standard (EEGS) [90–92], that acts as an in- direct measurement of outcomes. As part of the comparative study, we also compute the bias in non-ML studies [5,11,15,19,26,93–101], which computes CVD risk using (a) CUSIP such as AECRS 1.0 score [101–104]
and (b) the 10-year risk assessment strategies [97,98,105–107]. The bias cutoff is then determined, and the studies are ranked based on mean aggregate score, analyzed and finally, recommendations are presented to lower the risk of bias (RoB) in ML and non-ML systems. While we hypothesize that bias in ML is lower than non-ML, we further demon- strate this using the analytical slope method. We finally present a set of recommendations for lowering the RoB.
The layout of this study is as follows. Section 2 presents the PRISMA model for the selection of the citations. Along with this, the section discusses the statistical distributions of the AI parameters used in this study. Section 3 shows the ML architectures used for CVD risk assess- ment. The central component, of this study, involves the computation of bias in ML where the aggregate score is computed for all the ML-based studies, which is then used for determining the bias cutoff. This is shown in section 4. CVD risk analysis and comparison between ML vs.
non-ML is discussed in section 5. We demonstrate in section 6, the hy- pothesis that ML-based techniques are less biased compared to non-ML using the analytical slope method. Section 7 shows the distribution of bias by AI attributes in ML and recommendations for reduction in RoB.
The critical discussion is presented in section 8, and finally, the study concludes in section 9.
2. Search strategy and statistical distributions 2.1. PRISMA model
A PRISMA search was performed by using IEEE Xplore, PubMed,
Google Scholar, and Science Direct. The main keywords used for selecting studies were “CVD risk prediction using Artificial Intelligence”,
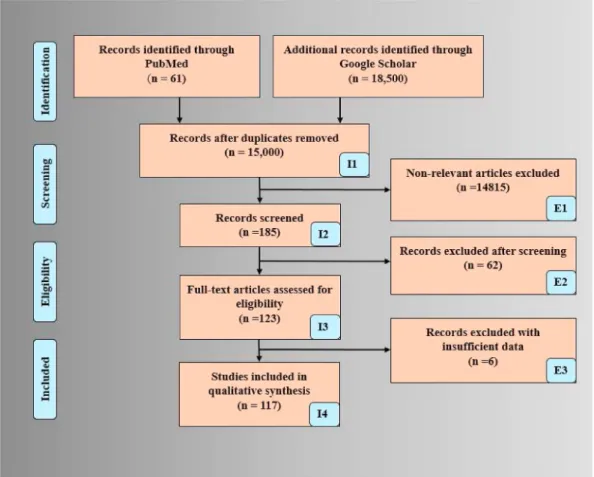
“CVD risk assessment in AI framework”, “CVD risk prediction using carotid”, “CVD risk prediction using ML”, “CVD risk prediction”. Fig. 1 shows the PRISMA model with all of the AI/ML studies used in this study. After an intensive search, a total of 18,561 studies were identi- fied, and duplicates studies were removed. After this systematic process, 15,000 studies were retained. There were three exclusion criteria (i) non-relevant articles, (ii) records excluded after screening of articles, and (iii) studies with insufficient data were excluded. After the appli- cation of the exclusion criteria, 14,815, 62, and 6 studies were excluded which are marked as E1, E2 (non-AI), and E3 in Fig. 1. The crucial and relevant information from these selected studies was extracted, and their statistical distributions were plotted and further linked to bias.
2.2. Statistical distributions
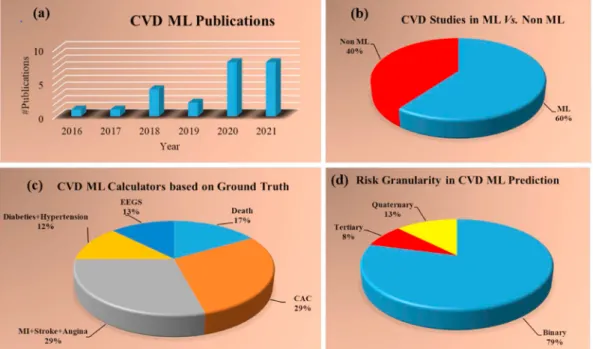
Fig. 2 shows the statistical distribution of (a) publication trend-by- year (b) ML vs. non-ML (c) types of outcomes or gold standard (d) risk granularity types (binary, tertiary, and quaternary). Fig. 2 (a) displays the trend of ML publications for CVD risk over the last 10-years. From 2016 it shows an increasing trend of publications till 2021 except for the year 2019, but there is no narrative review of the studies on the bias in ML for CVD risk prediction. Of all the selected 117 CVD-related articles, 24 were pure ML, and 14 were pure non-ML. Fig. 2 (b) shows the 60%
studies used ML [69–92] and 40% studies used non-ML studies [5,11,15, 19,26,93–101]. ML-based CVD calculators were analyzed based on the outcome (ground truth) design, which was divided into five clusters (Fig. 2 (c)) such as death 17% [69–72], coronary artery calcification (CAC), which was 24% [73–79], myocardial infarction (MI) along with stroke and angina which was 29% [80–86], diabetes along with hy- pertension which was 12% [87–89] and the event-equivalent gold
Fig. 1. PRISMA Analysis for selected studies.
standard (EEGS) which was 13% [90–92]. Since the outcomes of the CVD ML calculators play a crucial role in determining the reliability and stability of the ML design, it is therefore important to choose the outcome designs (gold standard) to have minimal impact on the bias of ML systems. Risk granularity (or type of classes) was also analyzed in the CVD ML prediction. Three classes were identified such as binary, ter- tiary, and quaternary. Fig. 2 (d) shows the contribution consisting of 77% binary [70–72,76,78–90,92], 9% tertiary [75,91] and 14% qua- ternary [69,74,77]. Even though granularity does not hamper the per- formance of the ML system directly, it could introduce a bias during the monitoring of statins on CVD patients. This is because multiclass CVD risk assessments are more effective since the drug delivery is more
refined. It is, therefore, necessary to have risk granularity as one of the attributes for overall bias in ML analysis.
The type of classifier determines the performance of the ML model.
Fig. 3 shows the distribution of (i) different classifiers, (ii) type of fea- tures, (iii) types of covariate clusters, and (iv) types of optimizations used in AI framework. Fig. 3 (a) shows the percentage distribution of the classifiers used in the ML framework consisting of 5% support vector machine (SVM) +synthetic minority oversampling technique (SMOTE) [72], 20% random forest (RF) [81,85,87,92], 5% K-nearest neighbour (KNN) [80], 10% decision tree [83], 5% neural network (NN) [92], 5%
principal component analysis (PCA) [91], 5% RF along with Adaboost [86], 10% ML [69,85], 10% deep learning (DL) [73,78], 5% stochastic Fig. 2.Statistical distribution (a) publication trend by year (b) ML vs. non-ML (c) types of outcomes or gold standard (d) risk granularity types (binary, tertiary, and quaternary). (For interpretation of the references to color in this figure legend, the reader is referred to the Web version of this article.)
Fig. 3. Statistical distribution (a) types of classifiers; (b) adaption of feature selection during ML; (c) types of risk factors (covariates); and (d) optimization applied to ML.
gradient [70], 5% Agatston classifier [74], 5% Gensiny score [76], 5%
ensemble boosting [75], and 5% self-organization map (SOM) [89]. The ML systems were also analyzed without and with feature selection. Fig. 3 (b) shows the percentage distribution, where 29% was without features [72,74,77,79,83,85,89,90] and 71% was with selected features [69–71, 75,76,80–82,84,86–88]. The statistical distribution of the covariates such as OBBM, LBBM, and CUSIP is shown in Fig. 3 (c). OBBM took 21%
[71,78,86,90,92], LBBM took 8% [82,83], CUSIP took 8% [70,74], OBBM along with LBBM took 59% [72,73,75–77,79,81,84,85,87–89, 91], OBBM, LBBM, and CUSIP all combined took 4% [69]. Fig. 3 (d) shows the characterization, where 33% of the ML studies were opti- mized [71,72,74,75,81,83,91,92] and 67% of the ML studies were not optimized [69,70,73,76–80,82,84–90,92]. Three out of four attributes (such as classifier types, selected features, and optimizations of ML systems) were the three legs of the stool that stabilizes the ML system design to prevent it from being biased in ML designs. It is therefore important to study these ML attributes for optimal performance. The clinical covariates such as OBBM, LBBM, CUSIP, and medications are equally important clusters for training the ML systems, therefore these covariates must be chosen appropriately to have minimal impact on the ML bias.
3. Machine learning architecture for CVD risk assessment The fundamental design in the ML system consists primarily of (a) model generation using the CVD risk factors on training cases and (b) prediction of risk labels (risk probabilities of the classes) on test cases. So these training models are based on (i) the choice of outcome (gold standard) designs, (ii) the type of the classifiers, (iii) the clusters of training covariates (risk factors), (iv) the objective of risk prediction for short term or long term (10-years), (v) the type of the cross-validation protocol (such as 10-fold or 5-fold), (vi) the scientific validation, and (vii) clinical evaluation. These factors play a crucial role in determining the overall performance and pitfalls leading to bias. Therefore, the objective of this section is to understand the different kinds of ML ar- chitectures keeping the above framework in mind.
Three architectures are presented in this section covering different aspects of the ML design and clinical delivery. Fig. 4 shows a typical ML architecture used for CVD risk prediction with the concept of data partition after pre-processing of the data using SMOTE algorithm. This was taken from AtheroEdge™ 3.0 system (AtheroPoint, CA, USA) [69].
It basically has two sections: (i) the offline training block and (ii) the online prediction of CVD risk. The block showing ten-fold cross-- validation divides the balanced datasets into two subsets (a) training
Fig. 4. The AtheroEdge 3.0 ML-system (Courtesy of AtheroPoint, Roseville, CA, USA) [69].
dataset and (b) testing dataset. The offline system consists of training model generation using the combination of training covariates (risk factors) and the gold standard (which could be a binary class or multiple classes). An example of a binary class is low- and high-risk labels, while in the case of the multiclass framework, one can take coronary angio- graphic score (CAS) consisting of four grades (low, moderate, mild, and high-risk). The model generation is accomplished using standardized classifiers such as XGBoost, support vector machine (SVM), random forest (RF), and neural networks (NN). The CVD risk is predicted during the online system by transforming the test risk factors (on test patients) by the training model coefficients (right side of Fig. 4). One can also adapt the benchmarking protocol where the CVD predicted risk from the ML system could be compared against the conventional calculators such as FRS, the SCORE, and ASCVD. Thus, we conclude that the classifiers’ design outcomes and choice play a vital role in the ML-based CVD sys- tems. Thus, these can be considered as ML attributes for computing the bias in ML.
Another category of architecture is when the experimental data and validation data are different. An example would be when the training is on data type A and testing on data type B, and vice-versa. A similar
paradigm was adopted in Ref. [72]. The architecture of a similar approach is shown in Fig. 5. The added benefit of this paradigm is the role of follow-up to predict the CVD risk at the 10th year, given the baseline of the current year. In this design, the authors use a dataset having 13-year follow-up information from the Multi-Ethnic Study of Atherosclerosis (MESA) data. This dataset consists of 6459 atheroscle- rotic CVD-free participants at baseline. Moreover, for validation, the Flemish Study of Environment, Genes, and Health Outcomes (FLE- MENGHO) cohort was used. Note that the system was data augmented by the use of NEATER, a technique for filtering oversampled data by the use of non-cooperative game theory as the system had unbalanced classes. The training system used an SVM classifier along with the outcome labels for model generation. The same classifier was used during the prediction model. Since this is a cross-validation paradigm, databases were swapped for the training and testing sets for unbiased results, followed by the mean computations of the predicted values.
Since the partition was randomly done, therefore one can use ten trials for better mean statistics. Thus, we conclude that (a) the design out- comes and (b) the choice of the classifiers play a vital role in ML-based CVD systems. One can therefore consider these as ML attributes for
Fig. 5. ML-system for 13 years follow-up CVD risk prediction (Courtesy of Journal of American Heart Association, Open Access) [72].
computing the bias in ML.
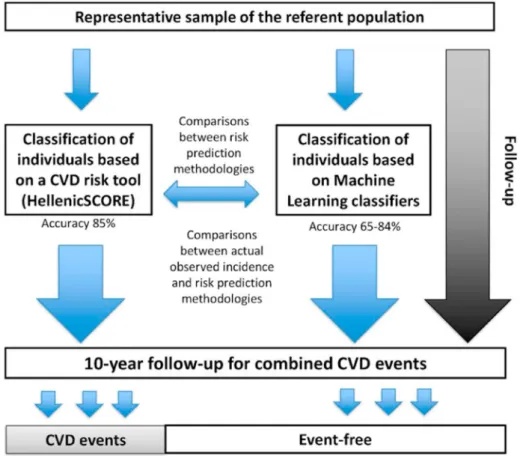
The next set of architecture (Fig. 6) predicts the 10-year CVD risk outcomes given the baseline covariates and benchmarking against the conventional CVD risk calculator such as HelenicSCORE. A set of three models was developed to distinguish a patient into high or low CVD risk groups by the use of different types of classifiers, namely k-NN, decision tree (DT), and RF [80]. Generally, the ML algorithms operate in two stages: (a) training of the model through a random set of data (training set), and (b) testing or evaluation of the model on the remaining data (testing set). The model should be trained by using a training set to es- timate all the features in the training set. Therefore, selecting the fea- tures is very crucial and should portray the original dataset which means the selection or sampling should be random and not be biased in any manner. Stratified k-fold cross-validation (CV) is a commonly used mechanism for sampling. In this, the whole dataset is divided into “k”
segments with equal size (folds), that obtain the ratio between classes, and then “k” independent iteration of validation/training was per- formed. Even though the system was designed using ML-based for risk prediction, the system lacks risk granularity. Thus, we conclude that the design outcomes, choice of the classifiers play a vital role in ML-based CVD systems. From the above discussion, we firmly believe there is a need to estimate the RoB in ML systems, and the ML attributes can be utilized for framing the design for the CVD bias risk estimation.
4. ML bias computation: scoring attributes, determining bias cutoffs, and ranking
The main objective of this study is to automatically detect the RoB in the ML-based studies that compute the CVD risk assessment. Thus, the first step is to estimate in which “bias bin” the study lies. These bias bins are estimated by determining the cutoffs which divide the “mean AI scores” in the ML studies. We broadly create three bins, such as low-, moderate- and high-bias, using two kinds of cutoffs based on the AP (ai)
Bias 1.0 (AtheroPoint, Roseville, CA, USA). Thus, the first step needs the mean AI score value for each study, which is computed by aggregating the “individual AI scores for each attribute”, divided by the “total AI attributes”. Note that the individual AI score per attribute is decided using the grading scheme based on an AI expert having a minimum of ten to fifteen years of experience.
The first cutoff is determined by computing the intersection of the
“mean score plot” (in decreasing order for all the participating ML studies) with a “cumulative frequency plot” (CFP) curve. The first intersection point is the low-moderate (LM) cutoff, while the moderate- high (MH) cutoff was empirically computed based on the slope transi- tions of the mean score plot of the participating studies. These two cutoffs then divide the total number of studies into low-, moderate-, and high-bias bins. Using this strategy, one can rank the ML-based studies and color code them demarcating the low-, moderate- and high-bias studies from green, yellow-to-orange, and red. These partitioned studies can then be analyzed for improving the RoB in ML-based CVD risk assessment systems.
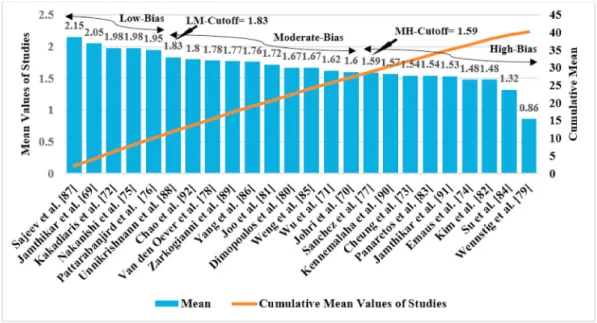
The grading scheme used for scoring the AI study is presented in Table A.1 (Appendix A). This table shows 46 AI attributes clubbed broadly into nine clusters namely (i) demographics, (ii) AI architecture design, (iii) optimization, (iv) performance parameter, (v) scientific validation, (vi) statistical test, (vii) clinical validation, (viii) clinical evaluation, and (ix) survival and hazard analysis. Each of these attri- butes has independent criteria for grading and scoring 24 ML studies that are self-explanatory and presented in Table A.1 [67–90]. Thus, one can compute the LM and MH cutoffs as shown in Fig. 7. As seen in this figure, the LM and MH cutoffs are 1.83 and 1.59, respectively.
Accordingly, the low-bias group has 5 ML studies [69,72,75,76,87], moderate-bias group has 10 ML studies [70,71,78,80,81,85,86,88,89,92]
and high-bias group contains 9 ML studies [71,72,75,77,80–82,88,89].
Table 1 shows the ranking of the 24 ML-based CVD studies. The ranking strategy is a powerful paradigm for automatically isolating and
Fig. 6. The ML-system for 10-year follow-up CVD risk prediction (Courtesy of Journal of BMC Med Res Methodol., Open Access) [80].
identifying the RoB in ML studies once the ML scores to the attributes are assigned. The same ranking algorithm paradigm was applied to non-ML-based studies, computing the cutoffs, bias bins, and detecting the non-ML studies in the three-bin classes, to be presented in the next section.
5. Understanding AI attribute behaviour: ML vs. non-ML The objective of this section is to understand in a deeper way how the AI attributes are involved in affecting the bias in the ML algorithms.
Thus, this section concentrates on the statistical distribution of the at- tributes in cluster formation. We actually split the clusters and zero-in into each attribute and correlate all the 24 ML studies for each ML attribute. There are two components to this section. In part A, we simply study the characteristics of each of the three bins once the ranking has been determined. In part B, we understand the behaviour of these attributes.
5.1. Characteristics of three cluster bias bins
Low-Bias Cluster Studies: This cluster had 5 ML studies [69,72,75,76, 87]. The general characteristics had more sophisticated use of AI ar- chitecture, and supervised techniques for developing training ML models. ML pipeline consisted of feature extraction [69,87] and appli- cation of top-to-the-notch classification techniques.
Moderate-Bias Cluster Studies: This cluster consisted of 10 ML studies [70,71,78,80,81,85,86,88,89,92]. The general characteristics of this cluster primarily consisted of moderate sophisticated use of AI archi- tecture, the unsupervised paradigm for training the ML model, partially adopting feature extraction methods, and usage and limited of popular classification models. The cross-validation performance parameters were not as high as low-bias cluster studies. Thus, the mean score values of this cluster were relatively lower compared to the low-biased cluster.
High-Bias Cluster Studies: This cluster had 9 ML studies [73,74,77,79, 82–84,90,91]. The general characteristics of the studies in this cluster include non-robust AI architecture, lack of feature extraction process, and further only statistical classification techniques were applied [79, 82]. These studies were also short of cross-validation protocol [74,84].
Thus, these studies secured low ranks among all the ML participating studies.
5.2. Understanding mean AI attribute behaviour over all the ML studies The AI attributes were compared between them to see which contributed to the low-bias, moderate-bias, and high-bias groups. The aggregate mean of each attribute was computed among all the 24 ML studies and for 14 non-ML studies. Then the percentage contribution for each AI attribute was based on the mean AI score for each attribute.
These were plotted in bar charts to better understand, as shown in Fig. 8 and Fig. 9.
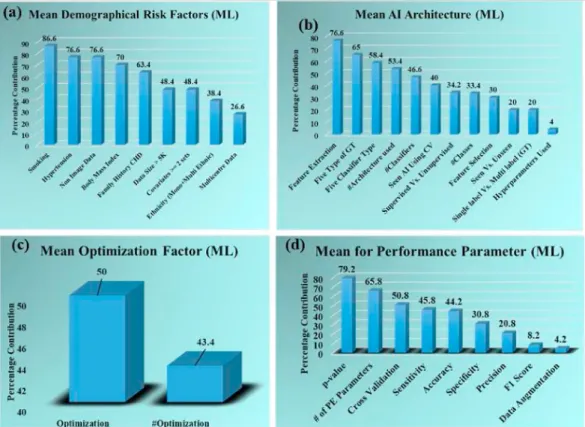
Fig. 8 shows the attributes of four cluster types (in %) such as (a) demographical risk factors, (b) attributes of AI architecture (c) Fig. 7. Ranking for the 24 ML studies. LM: Low-moderate cutoff; MH: Moderate-high cutoff.
Table 1
Ranking table derived using Tables A.1 and Table A.2.
prevalence of optimization paradigm, and (d) attributes for the perfor- mance parameters. The corresponding clusters using absolute mean scores are exhibited in Figure A.1 (Appendix A). In demographical at- tributes (Fig. 8 (a)), the smoking attribute was used a maximum number of times (86.6%) in the ML studies. The same figure shows the decreasing order of the remaining demographical risk factors in the following order such as hypertension (76.6%), non-image data (76.6%), body mass index (BMI) (70%), family history (FH) (63.4%), sample size
>5K (K~1000) (48.4%), covariate type >2 (48.4%), ethnicity (either mono or multi-ethnic) (38.4%), and data collection from multiple in- stitutes (26.6%). This can be seen in the following studies [69,72,75,76, 87,88].
In the AI architecture attribute cluster (Fig. 8 (b)), the feature extraction attribute obtained the highest percentage among all the at- tributes (76.6%) which means most of the studies performed feature extraction for the ML system [69,75,76,87,88,92]. Other attributes in this cluster follow the decreasing order as five types of GT (65%), five classifier types (58.4%), number of architecture used (53.4%) in each study, number of classifiers used (46.4%), usage of seen data in AI for CV (40%), training technique (supervised or unsupervised) (34.2%), number of classes used (binary, tertiary, quaternary) (33.4%), use of feature selection process (30%), type data used (seen or unseen) (20%), number of GT used (single label, multilabel) (20%), application of hyperparameters (4%). In the optimization paradigm (Fig. 8 (c)), the percentage of the studies performing optimization is 50%, while the number of studies using optimization techniques is 43.4%. This can be seen in Refs. [71,72,75,76,92]. Maximum number of studies (79.2%) have used P-value as performance parameter (Fig. 8 (d)) among all the attributes in performance parameter cluster [69,72,76,87,88,92]. The remaining attributes of this cluster are a number of performance pa- rameters used (65.8%), cross-validation process applied (50.8%), and sensitivity (45.8%), and accuracy (44.2%), specificity (30.8%) of the ML systems, precision of the ML system (20.8%), F1 score calculation (8.2%), and application data augmentation (4.2%).
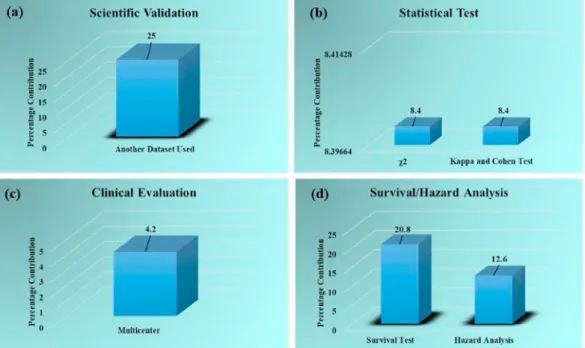
Fig. 9 describes the percentage contributions of the clusters (a) sci- entific validation of ML system (b) performance of the statistical test (c)
clinical evaluation of the ML systems, and (d) survival and hazard analysis of the ML studies. The corresponding clusters using absolute mean scores are exhibited in Figure A.2 (Appendix). The percentage of ML studies performing scientific validation by testing the ML system on other datasets is 25% (Fig. 9 (a)). The statistical test carried out are the chi-square test and Cohen & Kappa test having equal percentage contribution (8.4%) (Fig. 9 (b)). Clinical evaluation cluster (Fig. 9 (c)) shows that 4.2% of ML studies do a clinical evaluation of the ML system on a multicentre. Fig. 9 (d) shows the survival and hazard analysis cluster, the more ML studies have carried out the survival test (20.8%) while only 12.6% of ML studies had performed the hazard analysis test.
It is already observed that the ML system was very accurate compared to the non-ML system in predicting the CVD risk from the comparison of the attribute mean scores (Fig. 10 and Fig. 11).
The unique features of ML systems and non-ML systems were compared which are displayed in Table 2. It shows some common factors contributing to high-bias in both ML and non-ML studies such as no clinical validation, verification, statistical tests were done for both types of studies. The variability operation was also not performed for both the ML and non-ML studies. The hypothesis that the ML-based approaches for CVD risk assessment are less biased and more accurate is being dis- cussed and proved in a further section.
6. Bias computation using analytical slope method: A novel paradigm
The section aims to design an analytical solution for computing the bias in ML and non-ML studies based on the concept of the “proportion of scores (POS)” obtained during the evaluation of AI attributes. Our definition of POS is derived by the rationale that it is reciprocal of the probability of each category (type) of the score. If pi represents the probability of score “i”, then the POS for score “i” is mathematically represented as (p1
i). Using this pi notation the bias of a technique can be measured as the sum of reciprocal of the probabilities for all the scores
“i”, ranging from 0 to 5. Note that 0 to 5 are the scores obtained for each AI during the scoring paradigm. This concept can now be applied to ML
and non-ML setups.
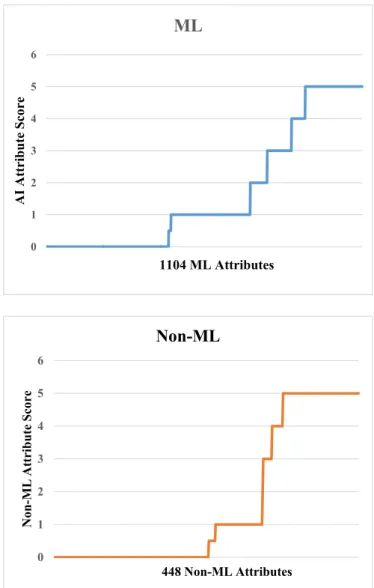
Since there are 24 ML studies and 46 AI attributes, this corresponds to “24 times 46” leading to 1104 number of AI scores. On the contrary, there were “14 non-ML studies and 32 attributes”, leading to 448 non- ML scores. The plot of these scores is shown in Fig. 12. The distribu- tion of ML studies is on the top, and on the bottom is for the non-ML studies. Note that the length of each segment corresponding to each score leads to the motivation for the design of bias-effect in ML and non- ML. This needs to be now analyzed in terms of POS and eventually bias effect. The POS values for ML and non-ML are shown in Table 3.
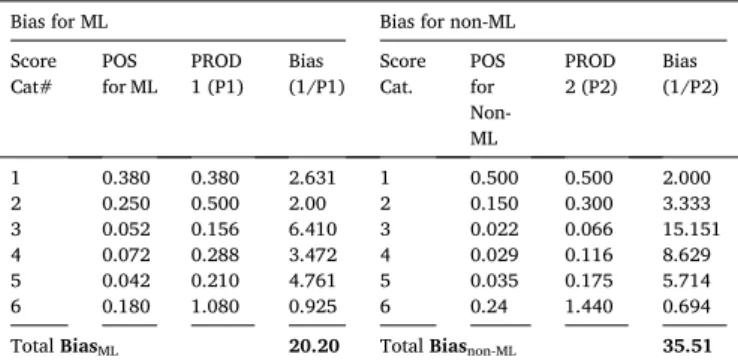
Using the POS values, we can now compute the bias effect for ML and non-ML, shown in Table 4. The POS for the ML are 0.38, 0.5, 0.156,
0.288, 0.21, and 1.08 corresponding to scores 0, 1, 2, 3, 4, and 5 respectively. And the POS for the non-ML is 0.5, 0.3, 0.066, 0.116, 0.175, and 1.44 for score 0, 1, 2, 3, 4, and 5 respectively. Therefore, bias effect for ML (BiasML) is 20.20 and bias effect for non-ML (Biasnon-ML) is 35.51. So, it is evident that BiasML < Biasnon-ML. Thus, we conclude that the bias effect in ML for CVD risk is less than in non-ML for CVD risk by [(35.51-20.20)/20.20]~43%.
Note that the above technique offers several advantages (i) the mathematical representation is sound and straight-forward, (ii) it han- dles different proportions of data such as ML vs. non-ML, (iii) the technique is generalized, and (iv) it proves the hypothesis that the ML techniques are strong (less biased) than the non-ML (more biased). Even Fig. 9.Percentage distribution for clusters (a) scientific validation (b) statistical test (c) clinical evaluation, and (d) survival/hazard analysis.
Fig. 10. The percentage for Clusters (a) demographics (non-ML) (b) performance parameters (non-ML) (c) statistical test (non-ML) (d) survival/hazard analysis (non-ML).
though the analytical paradigm offers several advantages, it is bound by the total number of AI attributes during the design of the ranking paradigm and can change, if the design of the AI attributes changes.
7. Bias distribution: ML vs. non-ML and recommendations Our main objective is to understand the bias in the ML and non-ML
studies by scoring each attribute. Since there are 46 attributes and 24 ML studies, thus there are 1104 attribute scores, therefore it can help us understand the bias in AI, and lead to recommendations for improving the RoB. Therefore, we categorize the mean score for each attribute corresponding to low-bias, moderate-bias, and high-bias categories of studies. This is shown in Table A.4. The spirit of this computation was derived from our previous publications [108,109], but extended to ML Fig. 11.The percentage for Cluster clinical evaluation (non-ML).
Table 2
Comparison of ML vs. non-ML systems for CVD risk assessment.
SN Attributes Machine Learning Non-Machine Learning
1 Total Studies 24 14
2 Cutoffs Low-Moderate =1.83
Moderate-High =1.59 Low-Moderate =1.95
Moderate-High =1.56 3 # Studies in each
bias bin High:9; Moderate:10;
Low:5 High:3; Moderate:4;
Low:7 4 Reason of studies
in high-bias No clinical validation, verification, statistical tests were not done, variability operation was not performed
No clinical validation, verification, statistical tests were not done, variability operation was not performed, data augmentation was not done, survival analysis was not performed 5 ML Training Supervised/Unsupervised No training 6 Ability to handle
non-linearity ✓ ⨯
7 ML hyper- parameter-based optimization
✓ ⨯
8 Technique’s
nomenclature Machine Learning
Deep Learning Logistic regression Statistical calculation 9 Data size Relatively Large Relatively Small,
Moderate 10 Classifier
Flexibility ✓ ⨯
11 Risk granularity >2 2
12 Risk Threshold Flexible or can change Ad-hoc 13 Gold standard
labels Multiple Binary
14 Ability to handle
different ethnicity ✓ ⨯
15 Risk Stratification
control ✓ ⨯
16 Accuracy Improved by changing
the Neural network depth No iteration can be performed
17 Loss Function ✓ ⨯
18 Ground truth Considered No concept of ground
truth
19 Class of GT Multiple GT Not possible
20 Ensemble model
(fusion) ✓ ⨯
21 Ability to handle
#attributes Large Moderate
Fig. 12.Distribution of AI scores. Top: ML framework. Bottom: Non- ML framework.
Table 3
Proportion computation for the ML vs. non-ML.
POS for ML POS for non-ML
Score Type Score
Frequency POS
Computation Score Type Score
Frequency POS Computation
0 426 (426/1100)
x100~38% 0 226 (226/446)
x100~50%
1 276 (276/1100)
x100~25% 1 68 (68/446)
x100~15%
2 58 (58/1100)
x100–5.2% 2 1 (1/446)
x100–0.22%
3 84 (84/1100)
x100–7.2% 3 13 (13/446)
x100–2.91%
4 47 (47/1100)
x100–4.2% 4 16 (16/446)
x100–3.5%
5 198 (198/1100)
x100~18% 5 111 (111/446)
x100~24%
(24 studies) and non-ML systems (14 studies) for CVD risk assessment.
Similar to ML, since the non-ML has 32 attributes and 14 studies, resulting in 448 scores, it can correspondingly help understand the non-ML paradigm’s bias. This section consists of two subsections. In the first section, we discussed the bias in the ML studies, and in the second section, we focused on the bias in the non-ML studies.
7.1. Bias distribution in ML attributes
The distribution of attributes is shown by three colors, red (high- bias), cream (moderate-bias), and green (low-bias). These three colors represent each attribute and are arranged from high-bias to low-bias values in decreasing order. This can be seen in Fig. 13. Our observations showed that number of studies in low-bias, moderate-bias, and high-bias groups were 5, 10, and 9, respectively. The high-bias attributes are non- image data, non-consideration of smoking data, p-value, and family history. The moderate-bias is due to BMI, feature extraction, feature se- lection, number of parameters used. The attributes that contribute to the low-bias in the ML studies are smoking, supervised training in ML sys- tem, high p-value, a greater number of optimization techniques used, and high specificity value. The attributes with the lowest mean scores are variability, verification, diagnostic order of ratio (DOR), Analysis of variance (ANOVA), clinical validation, FDA approval, ML systems were
clinically passed or not. Therefore, these attributes are commonly causing bias in ML studies.
Based on the observation, we can say that the overall performance of the ML systems can be improved by considering the missing attributes, such as verification and validation. It can be achieved by including family history, smoking information, and hypertension data or attri- butes into the demographic cluster. Using a higher number of classifiers, optimization techniques, supervised training can lead to obtaining a low- bias AI system. The use of a higher number of performance parameters can lead to low-bias in ML systems. The clinically approved ML system always delivers better results in estimating CVD risk. Thus, making the ML systems low-biased. An unusual behaviour has been observed for a few ML attributes such as smoking with high mean scores for both low- bias and high-bias groups.
7.2. Bias distribution for the non-ML attributes
In this section, we classified the 14 non-ML studies among low- (green), moderate- (cream), and high-bias (red) groups (Fig. 14). Using the cutoff for the low-moderate group as 1.95 and for moderate-high cutoff as 1.56, our observations showed 3, 4, and 7 studies were grouped into low-bias, moderate-bias, and high-bias groups respectively.
The clinical setting was not performed in non-ML systems which was the main reason behind the high-bias for such a system. The other non-ML attributes resulting in high-bias were due to no consideration of family history and smoking information. The cross-validation that was not performed further leads to the high-bias in the non-ML system. Lack of performance evaluation for the system also caused high-bias in the non- ML systems. Statistical tests like the chi-square test, DOR, ANOVA were not performed to check the system’s robustness leading to high-bias. The clinical verification for the non-ML systems was not performed, which had severely affected the bias and resulted in the high-bias of the system.
The moderate-bias attributes were from image data or the consideration of the image phenotypes as a risk factor. From the observation, we can say that the main factors for improving the performance quality and reducing the bias in the non-ML systems were to perform clinical vali- dation, verification, pass the clinical test, and get approval for the clinical settings. More demographic attributes should be introduced for Table 4
Bias effect computation for ML vs. non-ML.
Bias for ML Bias for non-ML
Score Cat# POS
for ML PROD 1 (P1) Bias
(1/P1) Score Cat. POS
for Non- ML
PROD 2 (P2) Bias
(1/P2)
1 0.380 0.380 2.631 1 0.500 0.500 2.000
2 0.250 0.500 2.00 2 0.150 0.300 3.333
3 0.052 0.156 6.410 3 0.022 0.066 15.151
4 0.072 0.288 3.472 4 0.029 0.116 8.629
5 0.042 0.210 4.761 5 0.035 0.175 5.714
6 0.180 1.080 0.925 6 0.24 1.440 0.694
Total BiasML 20.20 Total Biasnon-ML 35.51
#Cat: Category; BiasML: Bias due to ML; Biasnon-ML: Bias due to non-ML.
Fig. 13. Low vs. moderate vs. high-bias distribution of 46 AI attributes. AN: Attribute name; NID: Non-Image Data; SN: Smoking; FH: Family History; HP: Hy- pertension; BMI: Body mass index; GT: Ground truth; FE: Feature extraction; #PE: Number of performance parameter; CT: Classifier type, DS: Data size; C. Vali- dation: Cross-validation; AU: Architecture used; #C: Number of classifiers; ACC: Accuracy; MC: Multicentre; SEN: Sensitivity; AU/N: Another dataset used or not; ST:
Survival test; S/NS: Supervised/Non-supervised; FS: Feature selection; S/UnD: Seen Vs. Unseen Data; SL vs. ML: Single-label vs. Multilabel; HU: Hyper-parameters used; F1: F1 score; MC: Multicentre (clinical evaluation); HA: Hazard analysis; K&C: Kappa-Cohen test; SPEC: Specificity; DA: Data augmentation; DOR: Diagnostic Odds Ratio test; ANOVA: ANOVA test; Cl.V: Clinical validation; CS: Clinical setting; FDA: Food and Drug Administration approved; CP/N: Clinically passed or not.
the reduction of bias in AI systems.
7.3. Primary and secondary recommendations
The proposed study presented the bias in ML for CVD risk assess- ment. We here summarize the crucial factors by which the RoB can be reduced. This can be categorized into (a) primary and (b) secondary sets of recommendations. The primary recommendations include:
(i) Outcome design: The choice of the outcome plays a very important role in ML design for CVD risk assessment. The order of outcomes was EEGS < Chronic Diseases < Heart Conditions < CAC <
Death, with death being the best, followed by CAC score, heart conditions, chronic diseases like hypertension, diabetes, and EEGS which is a function of carotid arterial morphological phe- notypes such as lumen diameter. Stronger outcome designs are recommended for robust ML design. (ii) Morphological image- based phenotypes risk factors: Due to the same genetic makeup of morphological plaque between the coronary artery and carotid artery, the CUSIP is a robust non-invasive biomarker for CVD/
CAD risk prediction when used in a reduced speckle framework [110,111]. This CUSIP can be fused with OBBM and LBBM. Thus, the CUSIP risk factor can be recommended for removing the RoB.
(iii) Clinical Evaluation: The clinical evaluation piece gets missed due to the lack of 360 coverage. Therefore, it is vital to have the ML system try to evaluate the unseen patients whose results are known a priori. Thus, the ML system can be evaluated clinically.
(iv) Risk Granularity: Risk prediction generally provides binary results for several fields in medicine. This strategy makes it difficult or challenging for drug prescription and proper patient care. Because of this, new techniques came into practice with more than one class (multiclass) framework that gives a multi- label granularity of risk prediction. These will help in proper control of medication and monitoring. We, therefore, recommend the outcome design to be multiclass. (v) Validation using Cross Modality: Typically, scientific validation is ignored using cross-modality due to inherent reasons such as cost. However, in scientific validation, it is vital to validate the ML systems using cross-modality imaging. (vi) Sample Size: In AI, the sample size is vital; therefore, the performance and sample size constraints are vital, keeping the power analysis in mind. (vii) Inter- and Intra-observer Variability: Our findings displays that none of the
ML-based studies had carried out variability operation (inter-and intra-observer) analysis. Thus, compromising the robustness of the ML results or outcomes. Therefore, we recommend that inter-and intra-observer variability operations can be performed, further ensuring the reliability of the ML systems in clinical set- tings. An example can be seen in Refs. [112,113]. The secondary recommendations are (i) strong model design, segregating cross-validation, prediction, graphical user interface (GUI), vali- dation, and training. (ii) using multiple datasets for reproduc- ibility, (iii) multi-ethnic data collection for studies, (iv) relaxation in ground-truth events for clinical validation, (v) high-quality documentation, and (vi) opting for the process of peer-review.
8. Discussions
Typically, CVD or CAD risk prediction is conducted using conven- tional calculators such as FRS, SCORE, or ASCVD, but these calculators presume a linear relationship between the covariates (risk factors or variables) and outcomes (so-called gold standard or ground truth). As a result, CVD is either underestimated or overestimated. Further, the CVD estimated risk is limited to binary categories (or classes). This helps in improve drug delivery (statin) to prevent coronary heart disease (CHD).
The proposed review was a first of its kind to understand the bias in ML-based framework for CVD risk prediction. The second aspect of this study was focused on machine learning literature for CVD risk prediction by categorizing the outcomes into five different classes such as (i) death, (ii) CAC score, (iii) CVE/CVE, (iv) chronic diseases, and (v) EEGS. The novelty of the design outcome provided a deeper look into the AI framework for CVD estimation towards robust design. The third novelty of this system is focused on understanding the ML vs. non-ML paradigms since these risk prediction methods use different kinds of covariates.
This study involved scoring attributes of the ML studies with the help of experts who have more than 15 years of experience in AI. Further, the objective was to compute the aggregate score followed by the design of a ranking scheme and determine the two cutoffs (LM and MH) for classi- fying studies into low-, moderate-, and high-bias. This allowed in under- standing the low-, moderate-, and high-biases for every AI attribute, thereby giving solid recommendations for a reduction in RoB. A novel analytical slope method was designed to compute the bias effect in ML and non-ML paradigm. This validated the hypothesis that the bias effect in ML systems is lower compared to non-ML systems, suggesting that ML Fig. 14.Low vs. moderate vs. high-bias distribution of non-ML attributes. χ2: Chi-square test; K&C: Kappa & Cohen Test; BMI: Body mass index; ANOVA:
ANOVA Test.
ComputersinBiologyandMedicine142(2022)105204
14
Table 5
Benchmarking Table for ML-based CVD risk prediction studies.
C1 C2 C3 C4 C5 C6 C7 C8 C9 C10
SN First Author
(Year) Cohort #RF Patient Cohort/
Focus Covariates (Biomarkers) Prediction
(Outcome) Risk
Calculator Performance Attributes Summary of the Study R1 Jamthikar et. al.
[4] (2021) - 120 CKD HT, BMI, Age, Lipids, eGFR,
HbA1c,5 image phenotype Composite
CVD & CKD FRS, ML Contribution of eGFR, image-based phenotypes in CVD Risk assessment
Indicates link between CVD and CKD especially by reducing eGFR, albumin-to-creatinine ratio and albuminuria should also be considered in CVD risk assessment models
R2 Jamthikar et. al.
[20] (2020) UK, Germany, Scotland, USA, Japan, and Europe
208 - ESR, BMI, Age, Lipids, eGFR,
HbA1c,5 Image Phenotype CVD ML Risk Contribution, AUC By using powerful AI-based techniques, it examines the ways for the inclusion of more non-invasive image-based phenotypes in CVD risk prediction.
R3 Jamthikar et. al.
[47] (2019) - - - cIMTave, cIMTmax,
cIMTmin, IMTV, mTPA Event, Non-
event, Stroke ML & Deep
Learning cIMT, mTPA The combination of image-based risk factors and conventional CVD risk factors leads to more accurate CVD/stroke risk determination, handling multiple sources of information in the big data by the use of AI-based framework (ML & DL) will be the future of CVD/stroke risk prediction.
R4 Jamthikar et. al.
[6] (2020) - 120 Rheumatoid
Arthritis cIMTave, cIMTmax,
cIMTmin CVD ML AUC, Specificity,
sensitivity The image-based biomarkers for carotid atherosclerotic such as cIMT & plaque are significantly associated with RA-specific inflammatory markers.
R5 Jamthikar et.al.
[114] (2020) - 202 Age, Gender, DBP, SBP, HT,
HbA1c, LDL-C, HDL-C, TC, TG, TC/HDL, FH, Smoking, eGFR
CVD ML cIMT, AUC, specificity,
sensitivity CVD/stroke risk calculators (ML-based) show a higher ability to predict 10-year CVD/stroke risk when compared to the 13 other types of risk calculators (statistical-based) including AECRS 2.0 model.
R6 Khanna et al. [7]
(2019) - 10 Rheumatoid
Arthritis BMI, Smoking, Lipid, HT,
Diabetes, Insulin Resistance CVD ML & DL cIMT, AUC It provides an understanding of RA pathogenesis and its relation with carotid atherosclerosis by B-mode US methods.
Lacunas is a type of conventional risk score. It also shows the role of ML-based algorithms by using tissue characterization and could facilitate CVD risk prediction in patients with RA.
R7 Viswanathan
et al. [49] (2021) - - Diabetes,
Coronavirus Obesity, Oxidative stress, Coagulation activity, Hypoxia, Cytokine, RASS dysregulation
CVD - Linking of the risk factors
with CVD This review showed a bidirectional link between diabetes mellitus (DM) and coronavirus disease 2019 (COVID-19). The other link is from DM to COVID-19 because of drug-induced or decreased furin levels in DM or impaired immunity is from DM to COVID-19 (upper part of DKA) One is being from COVID-19 to DM (lower part of DKA) because of pancreatic damage or renin-angiotensin-aldosterone system dysregulation. This reduces the insulin release and increase in insulin resistance.
Both these processes trigger the CVD.
R8 Proposed Study Unseen 117 Heart
Conditions, Chronic diseases
OBBM, LBBM, CUSIP,
MedUSE CVD ML Outcomes (ground truth)
& Risk factors linking Five types of the gold standard were identified in the ML
design for CAD/CVD risk prediction. The low-moderate and moderate-high cutoffs for ML and non-ML studies were determined. Risk granularity was used in the analysis. A set of five recommendations were presented for a reduction in RoB.
#RF: number of references used in the study.
Suri et al.
studies are superior solutions for CVD risk assessments. We presented a set of five key recommendations for reduction in RoB such as (i) choosing better outcome design in the order of death >CAC >CVE >
Chronic disease >EEGS; (ii) fusion of image-based phenotypes (CUSIP) with conventional risk factors (OBBM +LBBM); (iii) dire need for sci- entific validation by using either other data sets or adopting the Unseen- AI paradigm; (iv) designing the CVD systems with multiple CVD risk granularity; and (v) designing system which can be adapted in routine clinical settings.
8.1. Benchmarking: Comparative studies on cardiovascular disease Table 5 shows a comparison between seven review studies that focused on CVD risk prediction. This table shows nine attributes (column C2 to column C10) for each of the seven studies ([4,6,7,20,47,49,114]) corresponding to the rows R1 to R8. These nine attributes presented were the year of the study (C2), cohort (C3), a number of studies used in the study (C4), type of disease in the cohort (C5), type of covariates (C6), type of outcome (C7), type of risk calculator adopted (C8), per- formance parameters (C9), and finally the summary/conclusion of the study (C10). Column C4 shows the # of references in the study, ranging from 10 to 208, while our study had used 117 studies. The description of the type of disease is shown in C5, such as CKD (row R1), RA (row R4 and R6), COVID (row R7), Diabetes (row R7). Our proposed study used heart conditions and chronic diseases as part of the disease type. Five out of seven studies used conventional biomarkers (rows R1, R2, R5, R6, and R7 in C6) such as smoking status, gender, obesity, BMI, age, hy- pertension, lipids (LDL, HDL), eGFR, HbA1c, oxidative stress, coagula- tion activity, hypoxia, cytokine, RASS dysregulation. Two studies used only image-based phenotypes as risk factors (row R3 and R4) such as cIMT (ave., max., min), IMTV, and TPA. No studies have used both OBBM and CUSIP biomarkers in conjunction for estimation of the CVD risk. Column C7 shows the type of the outcome, which was typically CVD in all the studies (R1 to R8). The type of the risk calculator is shown in column C8 and most of them adapted ML, however, some studies used the combination of ML and CCVRC, such as FRS, SCORE, ASCVD. The summary of each study is presented in column C9. Only the proposed study (row R8) discussed the “Unseen AI” compared to other studies.
The proposed study discusses granularity in CVD risk prediction and is not restricted to the binary system of risk prediction (R8, C10).
8.2. A short note on bias in machine learning for CVD risk assessment Cardiovascular disease is causing the death of approximately 18 million people globally [1]. For reducing these death rates early and accurate detection of the CVD risk is vital. Therefore, for the improve- ment in the prediction of CVD risk, the use of AI systems came into the application as compared to the conventional tool. But there are some challenges with AI systems since it sometimes focuses only on accuracy, forgetting about the validation of the AI systems in the clinical setting.
This overemphasizes the accuracy and underemphasizes the validation of AI systems, which causes bias in the AI system [115]. So, it is important to understand the bias in each AI system for its improvement in CVD risk prediction [116]. In this review, we have done the same by ranking the AI systems. The ranking is done by scoring each AI attribute
based on the performance of the attributes. The mean score and the cumulative mean were calculated and based on that two cutoffs (low-- moderate cutoff, moderate-high cutoff) were determined. And the AI studies were classified as low-bias, moderate-bias, and high-bias groups.
This whole system of ranking and classifying the AI systems for CVD risk prediction was done by experts having more than 15-years of experience in the field of CVD. Further, the correlation of AI attributes and non-ML attributes with the bias has been done.
8.3. Strength, weakness, and extensions
The main strength of this study was the establishment of a ranking- based solution for binning the ML studies into three bins (LB, MB, and HB). Further, we analytically proved that bias in ML is lower compared to non-ML-based studies. Lastly, we clearly established the five-set of recommendations for improving the RoB. Overall, our review also characterized the AI attribute behaviour among the 24 ML and 14 non- ML studies, establishing the relationship between LB, MB, HB distributions.
While the results were encouraging and promising, we noticed a lack of solid focus and data missing in these studies. Due to a lack of funding in research and data sharing, there is a lack of participation by several advanced AI groups. Not all the studies presented all the kinds of attri- butes as discussed in the benchmarking table. This study can be extended by exploring exhaustively other attributes for stronger bias measurements and classification methods [117].
9. Conclusions
This was the first pilot study of its kind which computed bias in ML for CVD risk assessment. PRISMA model was used to select the best 24 ML studies and 14 non-ML studies. The study showed two powerful schemes for bias estimation such as (a) ranking solution clubbed with an estimation of three bias bins and clustering these 24 ML studies in these three bins (low-bias, moderate-bias, and high-bias), and (b) analytical slope method for comparison between ML vs. non-ML for bias estimation for validating the hypothesis. Besides the above, the study offered (i) dis- covery of five types of the gold standard during the design of ML-based CVD risk assessment solution; and (ii) understanding the bias in ML vs.
non-ML using the ranking method. Further, we presented five types of recommendations for the reduction of RoB such as (i) superior outcome (gold standard) design; (ii) amalgamation of covariates such as OBBM, LBBM, and CUSIP in machine learning framework; (iii) need for scien- tific validation; (iv) CVD granularity for better drug delivery and monitoring the atherosclerotic disease, and (v) need for clinical evalu- ation thereby adapting in clinical settings. We demonstrated that the bias-effect in ML was less compared to non-ML by 43% using the analytical slope method, thus validating and establishing the hypothesis.
As AI further evolves such as ensemble techniques and deep learning solutions, we will see high confidence in the risk estimation for CVD.
Declaration of competing interest
Dr. Jasjit S. Suri is with AtheroPoint™ (Roseville, CA, USA), focused on cardiovascular disease and stroke.
Appendix A
All the ML and non-ML studies were ranked based on the scoring of the AI attributes. There was a total of 46 attributes as shown in Table A.1. As seen in the table there were 9 attributes (A2, A4, A6, A7, A9, A14, A15, A18, A20, A21, and A22) which were binary nature i.e. having two states (higher & lower). These were graded 5 for the higher state i.e., when the attribute was considered and 1 for the lower state. Since the authors have made an effort to design the system, we have chosen to grade 1 instead of 0. There were a few attributes (A29-A46) that were also binary in nature where we gave graded 5 for the higher state and 0 for the lower state. It is because there was no option to choose any intermediate state. Also, these were performance and test attributes that were crucial to determining the bias of the ML system. The next set of attributes A1, A3, A5, A8, A10-A13,
![Fig. 4. The AtheroEdge 3.0 ML-system (Courtesy of AtheroPoint, Roseville, CA, USA) [69]](https://thumb-eu.123doks.com/thumbv2/9dokorg/959631.56524/5.892.129.772.462.1084/fig-atheroedge-ml-courtesy-atheropoint-roseville-ca-usa.webp)
![Fig. 5. ML-system for 13 years follow-up CVD risk prediction (Courtesy of Journal of American Heart Association, Open Access) [72]](https://thumb-eu.123doks.com/thumbv2/9dokorg/959631.56524/6.892.116.787.419.1075/follow-prediction-courtesy-journal-american-heart-association-access.webp)