Cardiovascular disease risk perception in a Hungarian community sample:
psychometric evaluation of the ABCD Risk Perception Questionnaire
Tamas Martos ,1,2 Márta Csabai,1,2 Zsolt Bagyura,2 Zsófia Ocsovszky,2 Beatrix Rafael,1,2 Viola Sallay,1,2 Béla Merkely2
To cite: Martos T, Csabai M, Bagyura Z, et al. Cardiovascular disease risk perception in a Hungarian community sample:
psychometric evaluation of the ABCD Risk Perception Questionnaire. BMJ Open 2020;10:e036028. doi:10.1136/
bmjopen-2019-036028
►Prepublication history for this paper is available online.
To view these files, please visit the journal online (http:// dx. doi.
org/ 10. 1136/ bmjopen- 2019- 036028).
Received 27 November 2019 Revised 28 April 2020 Accepted 03 June 2020
1Institute of Psychology, University of Szeged, Szeged, Hungary
2Heart and Vascular Center, Semmelweis University, Budapest, Hungary Correspondence to Dr Tamas Martos;
tamas. martos@ psy. u- szeged. hu
© Author(s) (or their employer(s)) 2020. Re- use permitted under CC BY- NC. No commercial re- use. See rights and permissions. Published by BMJ.
Strengths and limitations of this study
► It presents the Hungarian language adaptation of a previously validated measuring system, the Attitudes and Beliefs about Cardiovascular Disease Risk Questionnaire.
► It uses a cross- sectional community sample of 410 Hungarian adult respondents.
► It is the first study to provide cross- cultural data on cardiovascular disease- related risk perceptions and knowledge along with correlates in a non- English- speaking sample.
► The associations in it are correlational without the possibility of causal inferences.
► The data on medical conditions are self- disclosed.
AbStrACt
Objectives Reliable and valid assessment of subjective risk perception is a crucial part of cardiovascular disease (CVD) prevention and rehabilitation. Since the recently developed Attitudes and Beliefs about Cardiovascular Disease (ABCD) Risk Questionnaire complies with these requirements, the aim of the present study was to investigate the psychometric properties of the Hungarian version of the measure.
Design and setting Community- based cross- sectional observational study
Participants In sum, 410 (M=49.53 years, SD=8.09) Hungarian adults (inclusion criteria: aged 35 and above, not under treatment with a psychiatric disorder) were included in the present study (female: n=277, 67.6%;
college or university- level education: n=247, 60.2%).
Methods We translated the ABCD Risk Questionnaire into Hungarian and checked its psychometric properties and validity indices.
Primary outcome measures Internal consistency, explorative and confirmative factorial validity. Associations with sociodemographic and health- related characteristics, as well as with measures of mental health (depressive symptoms, perceived stress and well- being).
results Exploratory and confirmatory factor analyses supported a three- factor solution, corresponding to the original subscales of Risk Perception, Perceived Benefits and Healthy Eating Intentions, with a moderate correlation between the latent constructs. The respondents’ level of knowledge on CVD risk factors was largely independent of their subjective risk perception. The results also provided evidence on the weak- to- medium associations between mental health indices and CVD- related perceptions.
Based on the results, a shortened scale version was also suggested.
Conclusion This study confirms the factorial structure, internal consistency and validity of the Hungarian version of the ABCD Risk Questionnaire in a non- English- speaking community sample. The ABCD Risk Perception Questionnaire is a parsimonious and psychometrically adequate measure to assess CVD- related attitudes and knowledge in the general population. Further research is needed in socioeconomically more diverse and in clinical samples, as well as in longitudinal intervention studies.
IntrODuCtIOn
Cardiovascular disease-related risk and risk perception: general overview
Cardiovascular diseases (CVDs) are the leading cause of death globally, accounting for more than 30% of mortality, therefore, significantly lowering life expectancy1 2 Approximately half of the CVDs is coronary disease. The number of patients suffering from atherosclerosis is increasing worldwide, and coronary artery disease accounts for more than 50% of mortality.3 According to the European statistics, more than 34 million disability- adjusted life years (DALYs) are related to the disease group, which is 25%
of the all- cause DALYs.4 CVD accounted for 45% of all- cause mortality in 2016, being responsible for 4 million deaths per year.
Coronary artery disease caused 1.8 million deaths, and 1.4 million cases occurred before the age of 75.4 Since 1970, mortality has been decreasing significantly in Western- Europe, but in Middle and Eastern Europe, this trend began later. Therefore, there is an almost twofold difference between the regions (Bulgaria 62%, France 26%).5
on July 20, 2020 by guest. Protected by copyright.http://bmjopen.bmj.com/BMJ Open: first published as 10.1136/bmjopen-2019-036028 on 13 July 2020. Downloaded from
Currently, the assessment of several biological and phys- ical risk factors of CVD is possible on a population level.
Moreover, these individual markers may be combined into indicators that reliably estimate the absolute risk of an individual’s 5- year or 10- year risk of coronary disease and CVD.6–8 Consequently, several guidelines for preventing CVD suggest the screening for absolute risk being a crucial first step in risk management.9–11
Moreover, since both long- term prevention and effec- tive treatment require the active cooperation of the popu- lation concerned (eg, the at- risk subgroups of a society, CVD patients, etc), one’s perceived risk of CVD turned out to be a central psychological construct that may affect health behaviour maintenance and change. Individual CVD risk perception—be it accurate or an underesti- mation or overestimation—depends on several factors.
In general, knowledge about the widely promoted risk factors for CVD, such as higher age, stress, smoking, obesity, high blood pressure as compared with one’s own characteristics may form the basis of the individual risk perception.12 13 To adopt a healthy lifestyle and habits that are conducive to health, such as diet, exercise, smoking and alcohol consumption, people first have to understand the importance of CVD risk.13 As Webster and Heeley14 note, ‘many patients have insufficient knowl- edge about CVD- related risk factors and often tend to have a dichotomous understanding of risk rather than understanding risk as a continuum.’ (p. 54.) Moreover, people ’also tend to compare themselves to others who are worse off than themselves when judging their personal risk rather than another average person like themselves.’
(p. 54). Concerning the evaluation processes behind subjective risk perception, several intrapersonal charac- teristics were proposed, including health literacy, anxiety level and optimism. Given its subjective nature, CVD risk perception is in an ambiguous relationship with objective risk as assessed by physiological markers, most frequently, by the Framingham Risk Score. While about 40% of the general population underestimate their risk for devel- oping CVD, 20% overestimate it.14 15 The potential conse- quences of underestimation (ie, the perceived risk being substantially lower than the objective risk) may be espe- cially dangerous for the health trajectory of the individual since it may contribute to the adoption or upholding of unhealthy behaviours and thus to the premature devel- opment of CVD. Moreover, excessive overestimation, when the perceived risk is substantially higher than the objective risk, may also cause a significant psychological burden.15
Assessment of CVD risk perception
The reliable and valid assessment of subjective risk perception is a crucial part of CVD prevention and reha- bilitation. In the recent decades, several measures were used for this reason. Many studies use simple single- item questions.16 17 Recently, Woringer et al asserted that while many validated measures assess knowledge on and percep- tions of CVD, as well as intention to change CVD- related
behaviour separately,18–20 only a few validated question- naires aim at CVD risk awareness incorporating all of these concepts.21
the Attitudes and beliefs about Cardiovascular Disease risk Perception Questionnaire
In order to overcome several drawbacks of the previously existing measurement approaches, Woringer et al21 ran an extensive scale development procedure. They aimed to develop a validated measure of CVD risk that had satis- factory validity and could be reliably applied to assess patients’ awareness of CVD risk among participants of the National Health Service Health Check Programme.22 The resulting Attitudes and Beliefs about Cardiovascular Disease (ABCD) Risk Questionnaire consists of three scales: Perceived Risk of Heart Attack/Stroke assesses the respondent’s own risk perception concerning their probability of developing a CVD; Perceived Benefits and Intentions to Change scale, and Healthy Eating Inten- tions scale. The authors also added a fourth scale, named Knowledge of CVD Risk and Prevention, which aims to capture the respondents’ objective knowledge level concerning basic facts on CVD.
CVD in Hungary and the need for reliable measures
There is a decreasing tendency in Hungary in all- cause mortality, but CVD- related death is still 173%–
158% higher than in the EU15 countries (refer author note), according to the data from.23 CVD- related death was 54.6% of all- cause mortality in females, and 44%
in males in 2015.23 As a frame of the study, we ran this investigation as part of the National Heart Programme.
The Hungarian version of the ABCD Risk Questionnaire was to be applied in an ongoing study of a community- based survey, the so- called Budakalász Health Survey, which aims at developing a series of a community- level model programmes for CVD prevention in a town (Buda- kalász) in the central region of Hungary.24 While it has been long- established that effective prevention planning requires the assessment of perceived CVD risk, we could not find any reliable measures that could be applied for this population.
the present study
The aim of the present study was to develop and psycho- metrically investigate a Hungarian version of the ABCD Risk Questionnaire. We expected that the results would confirm the internal structure of the adapted tool in a Hungarian adult, non- clinical sample. Moreover, we expected that the results would provide further evidence on CVD- related perceptions and notions in association with sociodemographic and psychological characters. As a distant aim of the study, we sought to provide a sound tool for further studies in CVD- related behaviours in Hungary, and also to contribute to the cross- cultural applicability of the measure. To the best of our knowledge, there is no short and well- validated questionnaire available in Hungarian, which would offer satisfactory content and
on July 20, 2020 by guest. Protected by copyright.http://bmjopen.bmj.com/BMJ Open: first published as 10.1136/bmjopen-2019-036028 on 13 July 2020. Downloaded from
face validity, and would be suitable for examining CVD risk awareness. Moreover, this will be among the first studies to validate ABCD in a different language version.
MetHODS
Sample and procedure
The sample was collected using the online survey tool LimeSurvey between October and December 2018.
Approval by the ethics commission of the Council of the Health Sciences (ETT- TUKEB, 53056-2/2018/EKU) was obtained prior to the study. The online research form was propagated by BA and MA psychology students of the University of Szeged in their online social networks (primarily through Facebook posts and personal email- lists) as part of their student research work. Moreover, the study was part of the National Heart Programme at Semmelweis University. The inclusion criteria were: being a Hungarian citizen aged 35 and above, and not being under treatment with a psychiatric disorder. During the assessment process, the participants were sufficiently informed about the general topic of the study, and they gave their informed consent in accordance with the Declaration of Helsinki before launching the online questionnaire form.
In sum, 1393 potential respondents opened the online survey site and presumably read the information sheet while 766 of them voluntarily gave the informed consent and started the assessment. In sum, 559 participants completed the online survey, meaning that 207 respon- dents quitted the assessment, great majority of them shortly after the start. During the data processing, 48 respondents who were below 35 had to be excluded, since the online questionnaire system also accepted respon- dents who were younger than 35 years. Moreover, another 101 participants had missing responses that could not been imputed (eg, health status responses). We run a logistic regression analysis to estimate the predictors of being excluded due to missing data. The probability of being female and older was higher in the missing data subsample (OR 2.54, 95% CI 1.40 to 4.60 and OR 0.962, 95% CI 0.937 to 0.989). In sum, 410 entries could be included in the present analyses, being 35 or older and having complete data for the variables in the analyses.
Participants who were included had a mean age of around 50 years (M=49.53; SD=8.09) with a range from 35 to 76 years. About two- thirds of the respondents were female (67.6 %, n=277). The largest part of the sample consisted of respondents with college or university- level education (60.2%, n=247), followed by high school grad- uates (25.4%, n=104) and participants with elementary- level education (14.4%, n=59).
Measures
The Hungarian version of the ABCD Risk Questionnaire
First, independent forward translation of the ABCD Risk Questionnaire was performed by three professionals who are experts in health psychology. Second, a consensual
Hungarian version was reached after extended discus- sions among the translators and the principal investi- gator. A bilingual translator, who was blind to the original English version, translated the temporary Hungarian version back into English. A professional medical expert compared this back- translated English version with the original version of the ABCD Risk Questionnaire and proposed a final version that was sufficiently close to the original. A final expert board consisting of the researchers and translators discussed the translation process and the suggested final version, created an approved version for field testing.
The ABCD Risk Questionnaire consists of 18 items in total. Eight items measure CVD risk perceptions, seven items refer to perceived benefits of healthy lifestyle habits and three assess intentions towards healthy eating habits.
Answer options are presented on a 4- point scale and range from1 ‘strongly disagree’ to4 ‘strongly agree.’
The knowledge scale consists of eight statements about CVD risk (eg,‘Walking and gardening are considered as types of exercise that can lower the risk of having a heart attack or stroke.’) with response options of 0=false and 1=true, indicating whether the respondent agrees or disagrees with the statement. All items are coded according to the predefined true/false categorisation of the statements. Agreement with true statements and disagreement with false statements is scored 1. Values are summed to create a summary score that can range from 0 to 8, where higher values indicate higher CVD- related knowledge.
Other measures
The sociodemographic variables included in the analyses from the complex test battery of the survey focused to the respondent’s age and educational attainment (having vs not having postsecondary education).
Health status and health behaviour
To estimate the participants’ subjective health status, the following question was applied: ‘In general, how would you rate your health status (1=very bad, 2=bad, 3=average, 4=good, 5=excellent)?’. Considering the low frequency of certain answers, responses were dichotomised to reflect the following categories: average or worse1–3 versus good or excellent.4 5 We also assessed the self- indicated preva- lence of CVDs in the respondents. In sum, 148 respon- dents (36.1%) indicated the prevalence of one or more of the following symptoms: flutter, cardiac arrhythmia, atrial fibrillation, any other CVD or hypertonia. Respondents gave account on their smoking behaviour (312 s’s, 76.1%
non- smokers, 96 s’s, 23.4 smokers, 2 s’s missing).
One question assessed the intensity of exercising in the everyday lives of the respondents with the question ‘How many days did you do intense exercise in the last week?’
(intense exercise meaning the exertion of considerable force for at least 10 min with increased pulse rate and increased breathing frequency).
on July 20, 2020 by guest. Protected by copyright.http://bmjopen.bmj.com/BMJ Open: first published as 10.1136/bmjopen-2019-036028 on 13 July 2020. Downloaded from
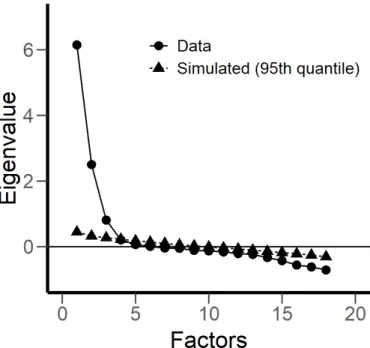
Figure 1 Scree plot of the exploratory factor analysis.
Measures to study the convergent validity
Other measures than the ABCD Risk Questionnaire were also used to allow for a more detailed study of the associ- ation of CVD- related attitudes with measures of mental health.
We used the nine- item shortened version of the Beck Depression Inventory (BDI- S, 9 items)25 that was devel- oped for health surveys. The items present severe symp- toms of depression (the sample item is ‘I have lost all of my interest in other people.’) and their presence in the last 2 weeks was rated on a 4- point Likert- scale (from 1=not at all present to 4=very much present). A higher sum of the item scores represents more severe depressive symptoms in the respondent’s daily life. Cronbach’s alpha was 0.849 for BDI- S, indicating a good internal consistency of the scale.
Perceived stress was measured using the abbreviated, four- item version of the Perceived Stress Scale.26 The subjective level of unpredictability and uncontrollability within the last 2 weeks was measured on a 5- point scale (from 1=never to 5=very often; sample item: ‘In the last month, how often have you felt that you were unable to control the important things in your life?’). A total score is obtained by summing the score of the items with higher scores indicating higher level of stress. Internal consis- tency was adequately high in the sample (Cronbach’s alpha=0.806).
Well- being was measured via the five- item WHO Well- being Index.27 28 Items assess the presence of positive mood states (the sample item is ‘I was cheerful and happy.’) in the past 2 weeks on a 4- point Likert- type scale (1=not at all true, 4=completely true). Item scores are summed up to form a total score, representing the subjec- tive level of emotional well- being. Internal consistency of the scale was satisfactorily high in the sample (Cronbach’s alpha=0.845).
Moreover, we also used a single question about subjec- tive CVD- related risk that was routinely used in CVD- related studies. The question read ‘What do you think the risk of you getting any kind of CVD within the next 10 years is?’ with the answer options 0=low risk (n=177, 43.2 %), 1=medium risk (n=190, 46.3 %) and 3=high risk (n=43, 10.5 %).
Statistical analyses
Exploratory and confirmatory factor analyses (EFA and CFA) were conducted by the freeware statistical package Jamovi (V.1.0.5). Model fit of the confirmatory factor analysis was evaluated based on a series of indices; the X2 test (non- significant results indicating adequate fit), the Tucker- Lewis and Comparative Fit Indexes (TLI and CFI, respectively; values between 0.90 and 0.95 indicate acceptable fit, while values greater than 0.95 suggest good fit) and the root mean square error of approximation (RMSEA; values below 0.08 indicate an acceptable fit, while values below 0.05 indicate a good fit).29 All other statistical computations, including bivariate Pearson correlation coefficients and group comparisons (t- tests
and one- way analysis of variances), were carried out using the software package SPSS V.23.
Patient and public involvement
No patients were involved in the research design and conception of this research study.
reSultS
Factorial structure and internal consistency Factorial validity
To explore the factorial structure of the ABCD Risk Questionnaire, we ran an EFA using Maximum Like- lihood extraction method with Varimax rotation. The Kaiser- Meyer- Olkin measure of sampling adequacy and Bartlett’s test of sphericity demonstrated that data was adequate for factor analysis (0.895 and 4838.3, respec- tively, at p<0.0001). We determined the adequate number of factors according to the Scree plot and the parallel analysis (PA) (see figure 1). PA is based on the calcula- tion of eigenvalues of randomly generated multiple data matrices, which have the same number of variables and cases as the original raw data set. Subsequently, differ- ences between randomly generated and empirically found eigenvalues are tested and a significantly higher random dataset eigenvalue indicates the cut- off point for true factor numbers.
Based on these calculations, a three- factor solution emerged for the data set. This three- factor solution accounted for 58.24% of the total variance (see factor loadings in table 1). The pattern of factor loadings indi- cates that the three factors correspond to the original subscales (Risk Perception, Benefit Finding and Healthy Eating Intentions). All items loaded on their corre- sponding factor were equal to or higher than the absolute value 0.482, except for item 1.
on July 20, 2020 by guest. Protected by copyright.http://bmjopen.bmj.com/BMJ Open: first published as 10.1136/bmjopen-2019-036028 on 13 July 2020. Downloaded from
Table 1 Factor loadings of the exploratory factor analysis Item no Factor 1 Factor 2 Factor 3 Uniqueness
5 −0.558 0.09 0.044 0.679
6 0.792 −0.129 0.026 0.356
11 0.861 −0.086 −0.096 0.242
12 0.791 −0.07 −0.013 0.369
13 0.92 −0.131 −0.055 0.134
14 0.847 −0.162 −0.086 0.249
15 0.9 −0.125 −0.052 0.171
18 0.891 −0.172 −0.037 0.176
1 −0.025 0.256 0.293 0.848
7 −0.059 0.71 0.11 0.48
8 −0.08 0.722 0.072 0.467
9 −0.108 0.824 0.158 0.285
10 0.196 −0.481 −0.114 0.717
16 −0.114 0.653 0.053 0.558
17 −0.159 0.653 0.233 0.494
2 0.142 −0.115 −0.482 0.734
3 0.016 0.086 0.956 0.079
4 0.021 0.194 0.724 0.438
The applied rotation method is varimax. Factor loadings with absolute values higher than 0.3 are in bold
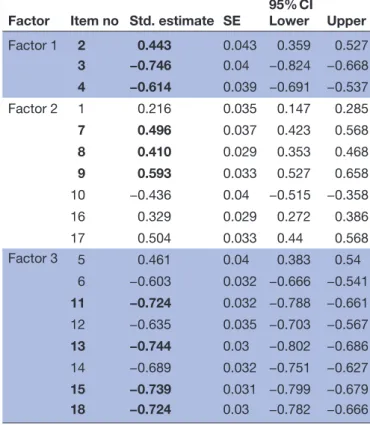
Table 2 Factor loadings of the confirmatory factor analysis
Factor Item no Std. estimate SE
95% CI
Lower Upper
Factor 1 2 0.443 0.043 0.359 0.527
3 −0.746 0.04 −0.824 −0.668 4 −0.614 0.039 −0.691 −0.537
Factor 2 1 0.216 0.035 0.147 0.285
7 0.496 0.037 0.423 0.568
8 0.410 0.029 0.353 0.468
9 0.593 0.033 0.527 0.658
10 −0.436 0.04 −0.515 −0.358
16 0.329 0.029 0.272 0.386
17 0.504 0.033 0.44 0.568
Factor 3 5 0.461 0.04 0.383 0.54
6 −0.603 0.032 −0.666 −0.541
11 −0.724 0.032 −0.788 −0.661
12 −0.635 0.035 −0.703 −0.567
13 −0.744 0.03 −0.802 −0.686
14 −0.689 0.032 −0.751 −0.627
15 −0.739 0.031 −0.799 −0.679 18 −0.724 0.03 −0.782 −0.666 All standardised estimates (factor loadings) are significant at p<0.001 level.
Items that are suggested for a shortened scale version are in bold.
The results of the EFA corresponded to the original three- factor structure of the ABCD Risk Questionnaire.
This structure was further tested using CFA to deter- mine its level of fit with the actual data. The results indi- cated that model fit was acceptable (Khi2=453,0, df=132, p<0.001, CFI=0.933, TLI=0.922, RMSEA=0.077, 90% CI (0.069 to 0.085)). The three latent factors were set to covariate in the model. Standardised covariances ranged from −0.073 (p=0.186) between factor 1 and factor 3, to
−0.323 and 0.298 (ps <0.001) between factor 1 and factor 2, and factor 2 and factor 3, respectively.
For comparison purposes, we examined whether this factorial structure could be improved by imposing further residual covariates in the model (Khi2=281,0, df=128, p<0.001, CFI=0.968, TLI=0.962, RMSEA=0.054, 90% CI (0.045 to 0.063)). Again, the three latent factors were set to covariate in the model. Standardised covariances ranged from −0.073 (p=0.186) between factor 1 and factor 3, to −0.363 and .328 (ps <0.001) between factor 1 and factor 2, and factor 2 and factor 3, respectively. In sum, these results confirmed the factorial structure of the ABCD Risk Questionnaire; moreover, they provided support for its structural validity (see table 2).
Reliability
The factorial solution provided support for the orig- inal subscales of the questionnaire. Therefore, for these subscales, we calculated internal consistency estimates of reliability in the form of Cronbach’s alpha coefficients.
The alpha estimates were 0.945, 0.822 and 0.756 for the
Risk Perception, the Perceived Benefits and the Healthy Eating Habits subscales, respectively, indicating good to excellent internal consistency of the subscales. The knowledge subscale indicated somewhat poorer internal consistency with an alpha estimate of 0.504 for the eight items. The descriptive statistics of the subscales along with bivariate associations with basic demographic characteris- tics is provided in table 3.
Convergent and divergent validity
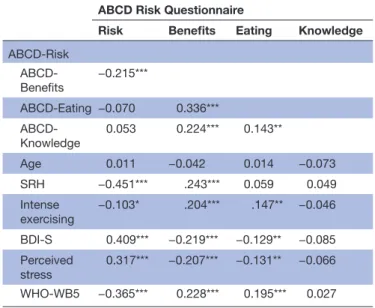
To evaluate the convergent and divergent validity of the ABCD Risk Questionnaire, we examined associations with measures of depressive symptoms and physical and mental well- being (see table 4). Bivariate correlations were typically significant while they were in the low to medium range. Moreover, they indicated that higher risk perception was associated with lower self- rated health and well- being, and also with the higher prevalence of depressive symptomatology and perceived stress. The opposite pattern was present for the Perceived Benefits and Healthy Eating Intentions subscales, although the strength of associations ranged lower for the latter. Knowl- edge scores had no significant relationship with any of the studied characteristics. The pattern of the presented associations indicate that the CVD- related perceptions as measured by the ABCD Risk Questionnaire are distinct constructs that can be differentiated from mental health indices, even though they are also related to them.
on July 20, 2020 by guest. Protected by copyright.http://bmjopen.bmj.com/BMJ Open: first published as 10.1136/bmjopen-2019-036028 on 13 July 2020. Downloaded from
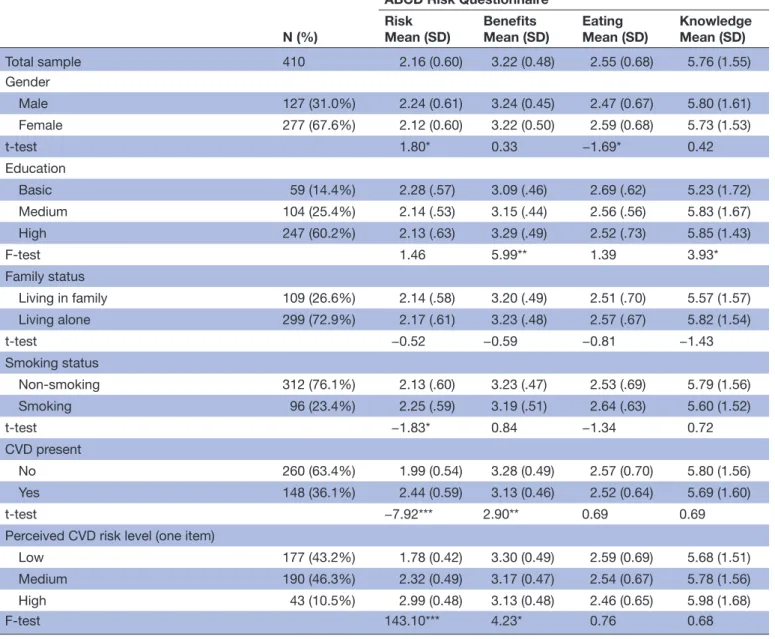
Table 3 Group comparisons of the subscales
N (%)
ABCD Risk Questionnaire Risk
Mean (SD) Benefits
Mean (SD) Eating
Mean (SD) Knowledge Mean (SD)
Total sample 410 2.16 (0.60) 3.22 (0.48) 2.55 (0.68) 5.76 (1.55)
Gender
Male 127 (31.0%) 2.24 (0.61) 3.24 (0.45) 2.47 (0.67) 5.80 (1.61)
Female 277 (67.6%) 2.12 (0.60) 3.22 (0.50) 2.59 (0.68) 5.73 (1.53)
t- test 1.80* 0.33 −1.69* 0.42
Education
Basic 59 (14.4%) 2.28 (.57) 3.09 (.46) 2.69 (.62) 5.23 (1.72)
Medium 104 (25.4%) 2.14 (.53) 3.15 (.44) 2.56 (.56) 5.83 (1.67)
High 247 (60.2%) 2.13 (.63) 3.29 (.49) 2.52 (.73) 5.85 (1.43)
F- test 1.46 5.99** 1.39 3.93*
Family status
Living in family 109 (26.6%) 2.14 (.58) 3.20 (.49) 2.51 (.70) 5.57 (1.57)
Living alone 299 (72.9%) 2.17 (.61) 3.23 (.48) 2.57 (.67) 5.82 (1.54)
t- test −0.52 −0.59 −0.81 −1.43
Smoking status
Non- smoking 312 (76.1%) 2.13 (.60) 3.23 (.47) 2.53 (.69) 5.79 (1.56)
Smoking 96 (23.4%) 2.25 (.59) 3.19 (.51) 2.64 (.63) 5.60 (1.52)
t- test −1.83* 0.84 −1.34 0.72
CVD present
No 260 (63.4%) 1.99 (0.54) 3.28 (0.49) 2.57 (0.70) 5.80 (1.56)
Yes 148 (36.1%) 2.44 (0.59) 3.13 (0.46) 2.52 (0.64) 5.69 (1.60)
t- test −7.92*** 2.90** 0.69 0.69
Perceived CVD risk level (one item)
Low 177 (43.2%) 1.78 (0.42) 3.30 (0.49) 2.59 (0.69) 5.68 (1.51)
Medium 190 (46.3%) 2.32 (0.49) 3.17 (0.47) 2.54 (0.67) 5.78 (1.56)
High 43 (10.5%) 2.99 (0.48) 3.13 (0.48) 2.46 (0.65) 5.98 (1.68)
F- test 143.10*** 4.23* 0.76 0.68
N=410 for the total sample; variables not summing up to 410 (100%) have missing values.
*P<0.05, **p<0.01, ***p<0.001
ABCD, Attitudes and Beliefs about Cardiovascular Disease; CVD, cardiovascular disease.
Interestingly, the Knowledge subscale—capturing the objectively proven level of reliable knowledge on CVDs and the related risk factors—was only related to the behavioural aspects of risk prevention; that is, to scores on the Perceived Benefits and Healthy Eating Inten- tions subscales, and did not correlate with perceived risk.
Moreover, the only characteristic that showed signifi- cant connection to knowledge level was education, with respondents with primary education being somewhat less informed about CVD risk factors.
Short version
We also tested the reliability of a short version of the ABCD Risk Questionnaire. Based on the factor load- ings of the CFA as well as the meaning of the items, we selected four items on Risk Perception, and three items
on the Perceived Benefits (see table 2 for the indication of the items). The original three items of the Healthy Eating Habits subscale were retained for the short version, too. The two shortened scales of Risk Perception and Perceived Benefits provided evidence on excellent internal consistency (Cronbach’s alphas 0.953 and 0.817, respectively); moreover, they correlated sufficiently well with their original versions (r=0.942 and .909, ps <0.001, respectively).
DISCuSSIOn
In the present study, we run a cross- sectional validation study in a non- representative Hungarian adult sample, and examined the replicability of a three- factor structure
on July 20, 2020 by guest. Protected by copyright.http://bmjopen.bmj.com/BMJ Open: first published as 10.1136/bmjopen-2019-036028 on 13 July 2020. Downloaded from
Table 4 Bivariate associations of the subscales ABCD Risk Questionnaire
Risk Benefits Eating Knowledge ABCD- Risk
ABCD- Benefits
−0.215***
ABCD- Eating −0.070 0.336***
ABCD-
Knowledge 0.053 0.224*** 0.143**
Age 0.011 −0.042 0.014 −0.073
SRH −0.451*** .243*** 0.059 0.049
Intense
exercising −0.103* .204*** .147** −0.046 BDI- S 0.409*** −0.219*** −0.129** −0.085 Perceived
stress 0.317*** −0.207*** −0.131** −0.066 WHO- WB5 −0.365*** 0.228*** 0.195*** 0.027
*P<0.05, **p<0.01, ***p<0.001
ABCD, Attitudes and Beliefs about Cardiovascular Disease; BDI- S, Beck Depression Inventory – Short form; SRH, self- rated health;
WHO- WB5, WHO Well- being Index.
and the psychometric properties of the ABCD Risk Ques- tionnaire.21 Using exploratory and confirmative factor analyses, we confirmed the original factor structure of the questionnaire, comprising Risk Perceptions, Benefits of Exercising, and the pursuit of Healthy Eating Intentions.
This study also confirmed that the subscales of the ques- tionnaire have good internal consistency and structural validity for assessing cardiovascular risk perceptions and connected cognitions on health behaviours like exer- cising and changing eating habits. Additionally, there were significant, but relatively weak internal correlations among the subscales. Higher risk perception was asso- ciated with lower benefit finding, but was unrelated to eating intentions, whereas benefit finding and healthy eating intentions correlated positively. This can be inter- preted as while people’s health behaviour tends to show a consistent pattern with interrelated health- protective atti- tudes, the subjective estimation of CVD risk is connected primarily to their attitudes towards exercising and not to their eating habits. Unlike the three subscales on subjec- tive experiences and cognitions, the Knowledge subscale aims at assessing the more objective aspects of individual knowledge on CVD risk factors. This subscale proved to be only moderately reliable, indicating that the respon- dents as a group have rather inconsistent knowledge structure on CVD risk. Obviously, we cannot discard the possibility of responding by chance either. Therefore, the results may reflect the actual level of knowledge only with a considerable amount of error.
Bearing this in mind, it is still apparent that risk percep- tion was largely unrelated to the level of CVD risk- related knowledge, along with low and non- significant correla- tions with behaviour- related subscales. Moreover, higher risk perception was also significantly associated with a
lower level of well- being and a higher level of depres- sive symptomatology and perceived stress. This can be interpreted that risk perception may mainly represent the affective response to the possibility of a CVD. On the other hand, knowledge on CVD risk and attitudes toward CVD- preventive behaviour are more closely connected to cognitive functioning and volition. This implies that, in order to reach the desired impact, effective health risk communication and preventive interventions have to focus on both affective and cognitive- behavioural aspects of CVD- related individual functioning.
We tested bivariate associations with a series of back- ground variables. Concerning CVD risk perception, respondents with the self- asserted presence of a CVD was the only group that had significantly higher average perceived risk; while neither age, nor gender or smoking status had strong and significant associations with it (male and smoker respondents had a marginally significant higher average). This may be an important warning for CVD prevention, as male gender, age and smoking status are known risk factors for CVD, and these factors are also included in objective measures of CVD risk, such as the Framingham score.30 In line with our results, studies assessing the objective and subjective levels of CVD risk consistently show that the two kinds of risk rarely converge at the population level.14 15 21 The possibility that the only factor that may raise the level of subjective CVD risk esti- mation is the presence of CVD symptoms and occurrences may pose a serious level of health risk for the individual, especially for the elderly. Later studies should address these associations in more detail, whether they are charac- teristic only for this adult Hungarian community sample or can be generalised to a more general population as well. The consistent and cross- culturally comparable use of ABCD Risk Questionnaire may help investigate these questions.
We also suggested items for a short version of two subscales of the ABCD Risk Questionnaire (Risk Percep- tion and Perceived Benefits) and tested the reliability of these subscales. Both internal consistency estimates and correlation coefficients with the original subscales indi- cated that the shortened versions can be considered as close and reliable replacements of the more elaborate longer versions. This way, our study provided new possi- bilities for future survey studies where the brevity of the applied measures may be an important aspect; however, researchers aim to assess CVD risk perceptions with a multi- item questionnaire instead of single risk- perception items (see also ref.31.)
limitations
Although methodologically sound, the current study has some limitations as well. For example, the study sample was derived from a non- probabilistic online sample, thus, it may be a result of self- selection bias. As we presented, there might have been a biased loss of potential respon- dents during several steps of the assessment process.
Further assessments have to find other means to provide a
on July 20, 2020 by guest. Protected by copyright.http://bmjopen.bmj.com/BMJ Open: first published as 10.1136/bmjopen-2019-036028 on 13 July 2020. Downloaded from
more balanced sampling. Second, given that participants were predominantly highly educated and the distribution of other sociodemographic characteristics in the sample differed from nationally representative data as well, the overall generalisation of the results should be treated with care. The present results may be more characteristic to educated respondents who have regular access to online resources, including health information. In contrast, it would be necessary to examine the influence of a broader sociodemographic background on CVD- related attitudes and intentions. Third, the participants were recruited exclusively from the general population without inclu- sion of a medically diagnosed clinical sample. Future studies are to be designed and realised to assess the reli- ability and validity of the ABCD Risk Questionnaire in clinical samples. A larger sample of clinically diagnosed CVD patients would also allow for a direct comparison of the factor structure and the basic associations in non- clinical and clinical samples. Fourth, we did not assess data on CVD- related family history of risk factors (such as hypertension, diabetes and hyperlipidaemia) and cardio- vascular events. Later studies should explore how knowl- edge on CVD- related family history may impact personal risk evaluation.32
COnCluSIOn
In sum, the results of the presented psychometric investi- gation suggest that the subscales of the ABCD Risk Ques- tionnaire capture independent aspects of risk perception and health behaviour, and therefore, the measure is acceptable for use in future research with adult Hungarian populations. Nevertheless, sampling bias has to be managed efficiently to prevent unjustified generali- sation of the results. Our study may also add to the cross- cultural generalisability of future results obtained with the scale.
Contributors All authors contributed to the design of the study, read and approved the final manuscript. The specific contributions of the authors are:TM—contributed to the translation process, performed the data assessment and analysis, and wrote the first draft of the manuscript. MC—contributed to the translation process, performed literature search and critically reviewed the manuscript. ZB—performed literature search and critically reviewed the manuscript. ZO—performed literature search and improved the final version of the manuscript. BR—performed literature search and critically reviewed the manuscript. VS—contributed to the translation process, interpreted the data and critically reviewed the manuscript. BM—
conceptualised and organised the overarching research process.
Funding This work was supported by the National Research and Development and Innovation Office (NKFI), grant number NVKP-16-1-2016-0017.
Competing interests None declared.
Patient and public involvement Patients and/or the public were not involved in the design, or conduct, or reporting, or dissemination plans of this research.
Patient consent for publication Not required.
Provenance and peer review Not commissioned; externally peer reviewed.
Data availability statement Data are available on reasonable request.
Open access This is an open access article distributed in accordance with the Creative Commons Attribution Non Commercial (CC BY- NC 4.0) license, which permits others to distribute, remix, adapt, build upon this work non- commercially, and license their derivative works on different terms, provided the original work is
properly cited, appropriate credit is given, any changes made indicated, and the use is non- commercial. See: http:// creativecommons. org/ licenses/ by- nc/ 4. 0/.
Author note EU15 denotes the member countries in the European Union prior to the accession of ten candidate countries on 1 May 2004.The EU15 comprised the following 15 countries: Austria, Belgium, Denmark, Finland, France, Germany, Greece, Ireland, Italy, Luxembourg, Netherlands, Portugal, Spain, Sweden, United Kingdom. source: https:// stats. oecd. org/ glossary/ detail. asp? ID= 6805
OrCID iD
Tamas Martos http:// orcid. org/ 0000- 0001- 5946- 1299
reFerenCeS
1 Mensah GA, Moran AE, Roth GA, et al. The global burden of cardiovascular diseases, 1990-2010. Glob Heart 2014;9:183–4.
2 Mozaffarian D, Benjamin EJ, Go AS, et al. Heart disease and stroke statistics--2015 update: a report from the American Heart Association. Circulation 2015;131:e29–322.
3 Fuster V. Global burden of cardiovascular disease: time to implement feasible strategies and to monitor results. J Am Coll Cardiol 2014;64:520–2.
4 Townsend N, Wilson L, Bhatnagar P, et al. Cardiovascular disease in Europe: epidemiological update 2016. Eur Heart J 2016;37:3232–45.
5 Timmis A, Townsend N, Gale C, et al. European Society of cardiology: cardiovascular disease statistics 2017. Eur Heart J 2018;39:508–79.
6 Jackson R, Lawes CMM, Bennett DA, et al. Treatment with drugs to lower blood pressure and blood cholesterol based on an individual's absolute cardiovascular risk. Lancet 2005;365:434–41.
7 Jackson R. Updated New Zealand cardiovascular disease risk- benefit prediction guide. BMJ 2000;320:709–10.
8 Anderson KM, Odell PM, Wilson PW, et al. Cardiovascular disease risk profiles. Am Heart J 1991;121:293–8.
9 Graham I, Atar D, Borch- Johnsen K, et al. European guidelines on cardiovascular disease prevention in clinical practice: full text. fourth joint Task force of the European Society of cardiology and other societies on cardiovascular disease prevention in clinical practice (constituted by representatives of nine societies and by invited experts). Eur J Cardiovasc Prev Rehabil 2007;14 Suppl 2:S1–113.
10 Alliance, NVDP. Guidelines for the assessment of absolute cardiovascular disease risk, 2009.
11 Pearson TA, Blair SN, Daniels SR, et al. Aha guidelines for primary prevention of cardiovascular disease and stroke: 2002 update:
consensus panel guide to comprehensive risk reduction for adult patients without coronary or other atherosclerotic vascular diseases.
American heart association science Advisory and coordinating Committee. Circulation 2002;106:388–91.
12 Imes CC, Lewis FM. Family history of cardiovascular disease, perceived cardiovascular disease risk, and health- related behavior: a review of the literature. J Cardiovasc Nurs 2014;29:108–29.
13 Homko CJ, Santamore WP, Zamora L, et al. Cardiovascular disease knowledge and risk perception among underserved individuals at increased risk of cardiovascular disease. J Cardiovasc Nurs 2008;23:332–7.
14 Webster R, Heeley E. Perceptions of risk: understanding cardiovascular disease. Risk Manag Healthc Policy 2010;3:49–60.
15 Hengen KM, Alpers GW. What's the risk? fearful individuals generally overestimate negative outcomes and they Dread outcomes of specific events. Front Psychol 2019;10:1676.
16 DeSalvo KB, Gregg J, Kleinpeter M, et al. Cardiac risk underestimation in urban, black women. J Gen Intern Med 2005;20:1127–31.
17 Claassen L, Henneman L, van der Weijden T, et al. Being at risk for cardiovascular disease: perceptions and preventive behavior in people with and without a known genetic predisposition. Psychol Health Med 2012;17:511–21.
18 Sheridan SL, Viera AJ, Krantz MJ, et al. The effect of giving global coronary risk information to adults: a systematic review. Arch Intern Med 2010;170:230–9.
19 Potvin L, Richard L, Edwards AC. Knowledge of cardiovascular disease risk factors among the Canadian population: relationships with indicators of socioeconomic status. CMAJ 2000;162:S5–11.
20 Bergman HE, Reeve BB, Moser RP, et al. Development of a comprehensive heart disease knowledge questionnaire. Am J Health Educ 2011;42:74–87.
21 Woringer M, Nielsen JJ, Zibarras L, et al. Development of a questionnaire to evaluate patients' awareness of cardiovascular
on July 20, 2020 by guest. Protected by copyright.http://bmjopen.bmj.com/BMJ Open: first published as 10.1136/bmjopen-2019-036028 on 13 July 2020. Downloaded from
disease risk in England's National health service health check preventive cardiovascular programme. BMJ Open 2017;7:e014413.
22 Public Health England. Nhs health check: our approach to the evidence, 2013.
23 Kékes E, Zsolt T, Kálmán T. Cardiovascular diseases yesterday, today and tomorrow? (in Hungarian). Cardiologia Hungarica 2019;49:111–8.
24 Bagyura Z, Kiss L, Edes E, et al. [Cardiovascular screening programme in the Central Hungarian region. The Budakalász Study].
Orv Hetil 2014;155:1344–52.
25 Rózsa S, Szádóczky E, Füredi J. Characteristics of the shortened Beck depression inventory in Hungarian samples. Psychiatria Hungarica 2001;16:384–402.
26 Stauder A, Konkoly- Thege B. Characteristics of the Hungarian version of the perceived stress scale (PSS) (in Hungarian).
Mentálhigiéné és Pszichoszomatika 2006;7:203–16.
27 É S Konkolÿ, Thege B, Stauder A, et al. Assesment of the Hungarian version of shortened who wellbeing questionanire base Don the
Hungarostudy 2002 in Hungarian. Mentálhigiéné és Pszichoszomatika 2006;7.
28 Topp CW, Østergaard SD, Søndergaard S, et al. The WHO-5 well- being index: a systematic review of the literature. Psychother Psychosom 2015;84:167–76.
29 Lt H, Bentler PM. Cutoff criteria for fit indexes in covariance structure analysis: conventional criteria versus new alternatives. Struct Equ Modeling 1999;6:1–55.
30 D'Agostino RB, Vasan RS, Pencina MJ, et al. General cardiovascular risk profile for use in primary care: the Framingham heart study.
Circulation 2008;117:743–53.
31 Khazaei H, Komasi S, Zakiei A, et al. Design and standardization of tools for assessing the perceived heart risk and heart health literacy in Iran. Ann Card Anaesth 2018;21:46–52.
32 Soroush A, Komasi S, Saeidi M, et al. Coronary artery bypass graft patients' perception about the risk factors of illness: educational necessities of second prevention. Ann Card Anaesth 2017;20:303.
on July 20, 2020 by guest. Protected by copyright.http://bmjopen.bmj.com/BMJ Open: first published as 10.1136/bmjopen-2019-036028 on 13 July 2020. Downloaded from