Dyssynchrony and the Risk of Ventricular Arrhythmias
Valentina Kutyifa, MD,*† Anne-Catherine Pouleur, MD,‡ Dorit Knappe, MD,‡
Amin Al-Ahmad, MD,§ Michal Gibinski, MD, PHD,储Paul J. Wang, MD,§
Scott McNitt, MS,* Bela Merkely, MD, PHD,† Ilan Goldenberg, MD,*
Scott D. Solomon, MD,‡ Arthur J. Moss, MD,* Wojciech Zareba, MD, PHD*
Rochester, New York; Budapest, Hungary; Boston, Massachusetts; Stanford, California;
and Katowice, Poland
O B J E C T I V E S The aim of our study was to evaluate the relationship between left ventricular (LV) dyssynchrony and the risk of ventricular tachycardia (VT) or ventricular fibrillation (VF) in patients enrolled in the MADIT-CRT (Multicenter Automatic Defibrillator Implantation Trial—Cardiac Resynchro- nization Therapy) trial.
B A C K G R O U N D Intraventricular mechanical dyssynchrony might be an important factor in ven- tricular arrhythmogenesis by enhancing electrical heterogeneity in heart failure patients. The effects of dyssynchrony have not yet been evaluated in a large cohort of implantable cardioverter-defibrillator (ICD) and cardiac resynchronization therapy with defibrillator (CRT-D) patients.
M E T H O D S LV dyssynchrony was measured at baseline and at 12-months by speckle-tracking echocardiography, defined as the standard deviation of time to peak systolic strain in 12 LV myocardial segments. The endpoint was the first VT/VF/death or VT/VF. LV dyssynchrony was evaluated in 764 left bundle branch block (LBBB) patients and in 312 non-LBBB patients.
R E S U L T S Baseline LV dyssynchrony was not predictive of VT/VF/death or VT/VF in LBBB or non-LBBB patients in either treatment arm. In CRT-D patients with LBBB, improvement in LV dyssynchrony over a year was associated with significantly lower incidence of VT/VF/death (p⬍0.001) and VT/VF (p⬍0.001) compared to ICD patients and to CRT-D patients with unchanged or worsening dyssynchrony. Among LBBB patients, 15% decrease in LV dyssynchrony was associated with lower risk of VT/VF/death (hazard ratio: 0.49, 95% confidence interval: 0.24 to 0.99, p ⫽ 0.049) and VT/VF (hazard ratio: 0.30, 95%
confidence interval: 0.12 to 0.77, p ⫽ 0.009) as compared to ICD patients. Patients without LBBB receiving CRT-D did not show reduction in VT/VF/death or in VT/VF in relation to improving dyssynchrony when evaluating cumulative event rates or risk of events.
C O N C L U S I O N S Baseline LV dyssynchrony did not predict VT/VF/death or VT/VF in mild heart failure patients with or without LBBB. CRT-induced improvement of LV dyssynchrony was associated with significant reduction of ventricular arrhythmias in patients with LBBB. (Multicenter Automatic Defibrillator Implantation Trial With Cardiac Resynchronization Therapy [MADIT-CRT];NCT00180271) (J Am Coll Cardiol Img 2013;6:
432– 44) © 2013 by the American College of Cardiology Foundation
From the *University of Rochester Medical Center, Rochester, New York; †Semmelweis University, Heart Center, Budapest, Hungary; ‡Cardiovascular Division, Brigham and Women’s Hospital, Boston, Massachusetts; §Stanford University, Stanford, California; and储Samodzielny Publiczny Szpital Kliniczny Nr 7, Katowice, Poland. The MADIT-CRT study was supported by a research grant from Boston Scientific, St. Paul, Minnesota, to the University of Rochester School of Medicine and
C
ardiac resynchronization therapy (CRT) has been shown to improve heart failure symptoms, quality of life, and to reduce heart failure hospitalizations in moderate or severe heart failure patients (1–5). CRT corrects the dyssynchronous left ventricular (LV) activation pattern, thereby increasing the LV systolic function, inducing reverse remodeling and improving the long-term survival (6 – 8).See page 445
The MADIT-CRT (Multicenter Automatic Defibrillator Implantation Trial–Cardiac Resyn- chronization Therapy) study has recently demon- strated that CRT combined with an implantable cardioverter-defibrillator (CRT-D) reduces heart fail- ure or death in mildly symptomatic or asymptomatic heart failure patients with severe left ventricular dys- function and a prolonged QRS (9). The MADIT- CRT and the RAFT (Resynchronization- Defibrillation for Ambulatory Heart Failure Trial) studies showed that patients with left-bundle branch block (LBBB) benefit the most from CRT compared to non-LBBB patients, including patients with right- bundle branch block (RBBB) and with intraventricu- lar conduction delay (IVCD) (10,11).
Heart failure patients are at high risk of ventric- ular tachyarrhythmias associated with worse out- come (12). Furthermore, some studies indicated proarrhythmic effects of CRT (13–15), whereas others demonstrated antiarrhythmic effects, ex- plained by improved hemodynamic status and left ventricular reverse remodeling (16 –19).
Intraventricular mechanical dyssynchrony might play an important role in the development of VT/VF by abnormal mechanical and subsequent electrical activation inducing electrical heterogene- ity. This association has not yet been investigated in
a randomized clinical trial on implantable cardio- verter defibrillator (ICD) and CRT-D patients.
The aim of the present study was to investigate the association between LV dyssynchrony, CRT- induced change in LV dyssynchrony, and the risk of VT/VF/death or VT/VF events in patients with LBBB and with non-LBBB, enrolled in the MADIT-CRT study.
M E T H O D S
Patient population. The MADIT-CRT trial was a prospective randomized multicenter trial designed to determine whether CRT-D therapy
would reduce the primary endpoint of heart failure events or death in mildly symptomatic or asymptomatic heart fail- ure patients (ischemic cardiomyopathy with New York Heart Association func- tional class I or II, nonischemic cardiomy- opathy with New York Heart Association functional class II) with severely depressed left ventricular ejection fraction (LVEF) ⱕ30% and a wide QRS (ⱖ130 ms). The design, protocol (20), and results (9) of the study had been published earlier. A total of 1,820 patients were enrolled in 110 study centers in the United States, Can- ada, and Europe. Patients were in sinus rhythm and met the guideline criteria for ICD therapy. Patients were randomly as- signed to CRT-D or ICD alone in a 3:2 ratio. Screened patients were excluded from enrollment, as specified earlier (20).
Echocardiographic methods. Echocardiog- raphy investigators and sonographers from each enrolling sites were qualified to per- form echocardiography according to the approved echocardiography protocol. Re- cordings were analyzed off-line at the Brigham and Women’s Hospital, Boston,
Massachusetts, as an independent echocardiogra- phy core laboratory.
LV mechanical dyssynchrony was measured us- ing B-mode speckle tracking software (Amid Car- diac Performance Imaging, TomTec 1.0, Unter- schleissheim, Germany), and analyzed off-line, as reported previously (21). On the still 2-dimensional images, the endocardium was traced in end systole in the apical 4- and 2-chamber views. Segments were manually adjusted if the tracking was subop- timal. In case of at least 2 segments that could not be tracked, the study was excluded from the analy-
Dentistry. Dr. Kutyifa has received honoraria from Biotronik, Servier, and Boston Scientific. Dr. Al-Ahmad receives honoraria from Medtronic, Boston Scientific, and St. Jude Medical. Dr. Gibinski has consultancy agreements with and speaker fees from Biotronik and Boston Scientific;
his wife is a Boston Scientific employee. Dr. Wang receives honoraria from Medtronic and Boston Scientific; and fellowship support from Medtronic, Boston Scientific, and St. Jude Medical. Dr. Merkely has a relationship with Boehringer Ingelheim; and a financial relationships with Biotronik, Medtronic, and St. Jude Medical. Dr. Solomon receives research support from Boston Scientific. Dr. Moss has received a research grant from Boston Scientific. Dr. Zareba has a research grant from Boston Scientific. All other authors have reported they have no relationships relevant to the contents of this paper to disclose.
Manuscript received April 16, 2012; revised manuscript received Decem- ber 14, 2012, accepted December 20, 2012.
A B B R E V I A T I O N S A N D A C R O N Y M S
ATPⴝantitachycardia pacing CIⴝconfidence interval CRTⴝcardiac resynchronization therapy
CRT-Dⴝcardiac resynchronization therapy with defibrillator
ECGⴝelectrocardiogram HRⴝhazard ratio
ICDⴝimplantable cardioverter defibrillator
IVCDⴝintraventricular conduction delay
LAVⴝleft atrial volume LBBBⴝleft bundle branch block LVEDVⴝleft ventricular end-diastolic volume
LVEFⴝleft ventricular ejection fraction
LVESVⴝleft ventricular end-systolic volume
RBBBⴝright bundle branch block
VFⴝventricular fibrillation VTⴝventricular tachycardia
sis. Transverse strain is a measure of myocardial thickening (like radial strain from parasternal view) but the nomenclature is different as in this case the apical view is utilized for data analysis (Fig. 1). In this study, the strain curves were not smoothed, although the software does a certain amount of smoothing (by definition). The Tomtec software computes the strain from the integration of the strain-rate field; the strain-rate computation in- volves the spatial derivative both of velocity and of geometry slope (curvature) along the border. These derivatives are computed with a filter (window width) whose size is one-twelfth of the border length (one-half of a segment). This is made to avoid fluctuations more rapid than half the size of a segment that are most likely due to errors than to actual physiological behavior.
The measurements were evaluated by an investi- gator blinded to randomization data, baseline clin- ical characteristics, and outcomes. LV mechanical dyssynchrony was defined as the standard deviation of regional time-to-peak transverse strain, mea- sured in the 12 segments of the left ventricle in the apical 4- and 2-chamber views (septum, lateral, anterior, and inferior walls; all of them subdivided into basal, mid, and apical segments). The intra- observer and interobserver variability for LV dys- synchrony was 13.8% and 15.4% for time-to-peak transverse strain, as reported elsewhere (21,22).
In all, 1,077 patients had digital echocardio- grams of sufficient image quality to allow for 2- dimensional speckle tracking analysis (21), after excluding 607 patients with non-DICOM (Digital Imaging and Communications in Medicine) images and 136 patients with poor image quality. There- fore, we analyzed 764 patients (42%) with LBBB and 312 (17%) patients with non-LBBB at base- line. One patient whose electrocardiogram (ECG) pattern was unknown was excluded from the analysis.
Paired echocardiograms from baseline and at 12 months eligible for dyssynchrony analysis were available in 809 of 1,077 patients. The rest of the patients had either poor image quality or their CRT device was off at the time of the echocardiographic analysis. Of the 809 patients with paired echocar- diograms, 336 patients received ICD device, 473 patients received CRT-D. Patients with paired echocardiograms had either LBBB ECG pattern (n⫽572) or non-LBBB ECG pattern (n⫽237).
Device programming. Commercially available trans- venous single or dual chamber ICD and CRT-D devices (Boston Scientific) were implanted in this
study, using standard techniques (20). Devices were programmed with a recommendation of setting the ventricular tachycardia (VT) zone at 180 beats/min and ventricular fibrillation (VF) zone at 210 beats/
min. Sensitivity was programmed based on phy- sician discretion. Detection was 2.5 s for the VT zone and 1.0 s for the VF zone. The pre-specified study protocol recommended programming the VT zone therapy to burst-type antitachycardia pacing (ATP) with 8 pulses at 88% of the measured cycle length with 10-ms decrement between bursts, and subsequent shock therapy, with the second suggestion of setting the shock at defibrillation threshold plus at least 10 J. The additional shock therapies were suggested as being maximal energy shocks.
Patient follow-up, device interrogation. Patients had a clinic follow-up 1 month after the device implan- tation and then every 3 months until the end of the trial or in case of heart failure or arrhythmic events.
Clinical evaluation and ICD interrogation was per- formed at each follow-up visit. The ICD interro- gation disks at follow-up and after ICD shocks were sent to the interrogation core laboratory (P.J.W., Stanford University) for categorization and final evaluation of detected arrhythmias with ICD therapy (ATP or shock).
Definitions and study endpoints. The relationship between baseline LV dyssynchrony and study end- points was analyzed in the total patient population with LV dyssynchrony data regardless of treatment assignment, split up by LBBB and non-LBBB ECG pattern, because significant differences were demonstrated in clinical outcome and ventricular arrhythmia rate in these patient subgroups as re- ported elsewhere (10). Patients were grouped into quartiles of baseline LV dyssynchrony, as suggested earlier (22).
The change in LV dyssynchrony was analyzed in CRT-D and ICD patients. In this substudy, ICD patients served as a control group, as it had already been reported that ICD patients show less improve- ment in LV dyssynchrony than CRT-D patients (21). In this analysis, CRT-D patients with LBBB and with non-LBBB were analyzed separately. The change of LV dyssynchrony was calculated as the difference in LV dyssynchrony from baseline to the 12-month recording. CRT-D patients were cate- gorized into 3 groups based on the change: improv- ing, unchanged, or worsening LV dyssynchrony.
Improving LV dyssynchrony was defined as a
⬎15% decrease in LV dyssynchrony, and un- changed dyssynchrony included dyssynchrony
Figure 1.Assessment of LV Dyssynchrony Before and After CRT-D Implantation
Two-dimensional speckle-tracking imaging from the apical 4-chamber view(A)before and(B)after cardiac resynchronization therapy with defibrillator (CRT-D) implantation. Thecurvesrepresent transverse strain and left ventricular (LV) dyssynchrony measured by the standard deviation of time-to-peak transverse strain in 12 LV segments.(A)Represents heterogeneous LV activation and significant LV dyssynchrony before CRT-D implantation, whereas(B)shows synchronized LV activation after CRT implantation in the same patient.
change⬍⫺15% up to ⫹15%. Worsening dyssyn- chrony was defined as⬎15% positive change in LV dyssynchrony.
Arrhythmia episodes were defined as any type of therapy delivered including ATP and shocks. Def- inition of VT was set to a rate from 180 beats/min (recommended programming) up to 250 beats/min, ventricular (V) rateⱖatrial (A) rate if 1:1 A:V, V-V changes drive AA changes. VF was defined as ven- tricular rate ⬎250 beats/min with disorganized ven- tricular electrograms. Only appropriate therapy deliv- ered for VT or VF was considered in the present analysis. Arrhythmia episodes were adjudicated by an independent adjudication committee blinded to treat- ment assignment and clinical parameters.
The endpoint of the baseline analysis was the first episode of VT/VF or death and first VT/VF events.
When analyzing the effects of LV dyssynchrony change at the 12-month follow-up, the first VT/VF events after 1 year assessment or death and first VT/VF after 1 year were considered as endpoints, excluding 25 patients with LBBB and 47 patients with non-LBBB who had VT/VF or death in the first year.
Statistical analysis. Continuous variables are expressed as mean⫾SD. Categorical data are summarized as frequencies and percentages. Baseline clinical charac- teristics were compared between the pre-specified non-LBBB and LBBB subgroups, stratified by base- line LV dyssynchrony quartiles or by changes over 1 year in LV dyssynchrony, using nonparametric Wil- coxon or Kruskal-Wallis tests for continuous variables and chi-square test or Fisher exact test for dichoto- mous variables, as appropriate. When analyzing the effects of LV dyssynchrony change, only the first VT/VF events after the 12-month visit were consid- ered as endpoints.
The correlation of baseline LV dyssynchrony and baseline QRS duration was analyzed using Pearson correlation method. Paired comparisons of baseline LV dyssynchrony and change in LV dyssynchrony at 12 months in LBBB and non-LBBB patients were analyzed using nonparametric Wilcoxon rank-sum test.
Cumulative probability of first VT/VF/death and VT/VF episodes was determined according to the Kaplan-Meier method, with comparisons of cumula- tive event rates by the log-rank test in non-LBBB and LBBB patients separate. Multivariate Cox propor-
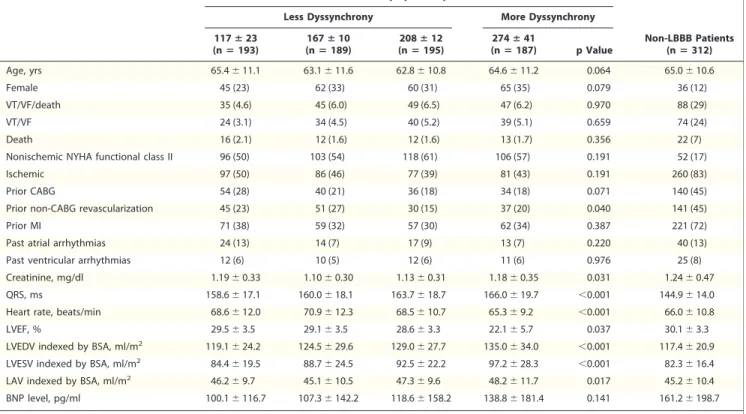
Table 1.Baseline Characteristics of Patients With LBBB and Baseline LV Dyssynchrony and Patients With Non-LBBB and Baseline LV Dyssynchrony Quartiles of Baseline LV Dyssynchrony (ms) in LBBB Patients
Less Dyssynchrony More Dyssynchrony
Non-LBBB Patients (nⴝ312) 117ⴞ23
(nⴝ193)
167ⴞ10 (nⴝ189)
208ⴞ12 (nⴝ195)
274ⴞ41
(nⴝ187) p Value
Age, yrs 65.4⫾11.1 63.1⫾11.6 62.8⫾10.8 64.6⫾11.2 0.064 65.0⫾10.6
Female 45 (23) 62 (33) 60 (31) 65 (35) 0.079 36 (12)
VT/VF/death 35 (4.6) 45 (6.0) 49 (6.5) 47 (6.2) 0.970 88 (29)
VT/VF 24 (3.1) 34 (4.5) 40 (5.2) 39 (5.1) 0.659 74 (24)
Death 16 (2.1) 12 (1.6) 12 (1.6) 13 (1.7) 0.356 22 (7)
Nonischemic NYHA functional class II 96 (50) 103 (54) 118 (61) 106 (57) 0.191 52 (17)
Ischemic 97 (50) 86 (46) 77 (39) 81 (43) 0.191 260 (83)
Prior CABG 54 (28) 40 (21) 36 (18) 34 (18) 0.071 140 (45)
Prior non-CABG revascularization 45 (23) 51 (27) 30 (15) 37 (20) 0.040 141 (45)
Prior MI 71 (38) 59 (32) 57 (30) 62 (34) 0.387 221 (72)
Past atrial arrhythmias 24 (13) 14 (7) 17 (9) 13 (7) 0.220 40 (13)
Past ventricular arrhythmias 12 (6) 10 (5) 12 (6) 11 (6) 0.976 25 (8)
Creatinine, mg/dl 1.19⫾0.33 1.10⫾0.30 1.13⫾0.31 1.18⫾0.35 0.031 1.24⫾0.47
QRS, ms 158.6⫾17.1 160.0⫾18.1 163.7⫾18.7 166.0⫾19.7 ⬍0.001 144.9⫾14.0
Heart rate, beats/min 68.6⫾12.0 70.9⫾12.3 68.5⫾10.7 65.3⫾9.2 ⬍0.001 66.0⫾10.8
LVEF, % 29.5⫾3.5 29.1⫾3.5 28.6⫾3.3 22.1⫾5.7 0.037 30.1⫾3.3
LVEDV indexed by BSA, ml/m2 119.1⫾24.2 124.5⫾29.6 129.0⫾27.7 135.0⫾34.0 ⬍0.001 117.4⫾20.9
LVESV indexed by BSA, ml/m2 84.4⫾19.5 88.7⫾24.5 92.5⫾22.2 97.2⫾28.3 ⬍0.001 82.3⫾16.4
LAV indexed by BSA, ml/m2 46.2⫾9.7 45.1⫾10.5 47.3⫾9.6 48.2⫾11.7 0.017 45.2⫾10.4
BNP level, pg/ml 100.1⫾116.7 107.3⫾142.2 118.6⫾158.2 138.8⫾181.4 0.141 161.2⫾198.7
Values are mean⫾SD or n (%). Follow-up starts at enrollment.
BNP⫽B-type natriuretic peptide; BSA⫽body surface area; CABG⫽coronary artery bypass graft; LAV⫽left atrial volume; LBBB⫽left bundle branch block; LV⫽left ventricular; LVEDV⫽ left ventricular end-diastolic volume; LVEF⫽left ventricular ejection fraction; LVESV⫽left ventricular end-systolic volume; MI⫽myocardial infarction; NYHA⫽New York Heart Association;
VF⫽ventricular fibrillation; VT⫽ventricular tachycardia.
tional hazards regression analysis was used to identify and evaluate the impact of LV dyssynchrony on the endpoint of first VT/VF or death and on VT/VF events. The Cox model was adjusted for the variables showing potential imbalances in clinical characteristics in the pre-specified subgroups and for those predictive of the endpoint. Interaction p values for LBBB and non-LBBB are reported. Adjusted hazard ratios (HRs) with their 95% confidence intervals (CIs) are reported. All statistical tests were 2-sided; a p value of
⬍0.05 was considered statistically significant.
R E S U L T S
Of the 1,077 patients with sufficient echocardio- graphic images, in patients with non-LBBB (n ⫽
312), 32 patients with ICD (27.1%), and 56 pa- tients (28.9%) with CRT-D reached the endpoint of VT/VF/death (p⫽0.74); in the LBBB subgroup (n ⫽ 764), 87 patients with ICD (29.3%) and 89 patients (19.1%) with CRT-D had VT/VF or death (p ⫽ 0.001) from enrollment. During the mean follow-up of 2.3 ⫾ 0.9 years, 188 patients (17.7%) had VT, 55 (5.2%) had VF, and 75 patients died (7%), 22 of them (2%) after a VT or VF event. After the 12-month follow-up, 77 of 572 patients (13.4%) with LBBB had VT/VF/
death, and 56 of them (9.8%) had VT or VF. In patients with non-LBBB, 40 of 237 (16.8%) patients had VT/VF or death, and 34 of them (14.3%) had VT or VF.
Cumulative Probability of VT/VF or Death for Non-LBBB Patients 0.0 0.1
Years from Randomization 0
0.2 0.3 0.4
1 2 3
Q1 Dys
Q2 Dys Unadjusted P = 0.662
Patients at Risk
Q1 Dys 78 62 (0.18) 39 (0.30) 9 (0.43)
Q2 Dys 78 68 (0.12) 38 (0.21) 9 (0.37)
Q3 Dys 79 61 (0.22) 37 (0.27) 14 (0.38)
Q4 Dys 77 68 (0.11) 41 (0.19) 14 (0.29)
Q3 Dys Q4 Dys
Cumulative Probability of VT/VF for Non-LBBB Patients 0.0 0.1
Years from Randomization 0
0.2 0.3 0.4
1 2 3
Q1 Dys
Q2 Dys Unadjusted P = 0.526
Patients at Risk
Q1 Dys 78 62 (0.16) 39 (0.28) 9 (0.38)
Q2 Dys 78 68 (0.09) 38 (0.14) 9 (0.29)
Q3 Dys 79 61 (0.18) 37 (0.23) 14 (0.34)
Q4 Dys 77 68 (0.11) 41 (0.18) 14 (0.28)
Q3 Dys Q4 Dys
Cumulative Probability of VT/VF for LBBB Patients 0.0 0.1
Years from Randomization 0
0.2 0.3 0.4
1 2 3
Q1 Dys
Q2 Dys Unadjusted P = 0.623
Patients at Risk
Q1 Dys 193 168 (0.09) 109 (0.14) 38 (0.20)
Q2 Dys 189 164 (0.09) 102 (0.14) 31 (0.20)
Q3 Dys 195 169 (0.10) 103 (0.16) 46 (0.25)
Q4 Dys 187 164 (0.09) 99 (0.19) 29 (0.23)
Q3 Dys
Q4 Dys
Cumulative Probability of VT/VF or Death for LBBB Patients 0.0 0.1
Years from Randomization 0
0.2 0.3 0.4
1 2 3
Q1 Dys
Q2 Dys Unadjusted P = 0.878
Patients at Risk
Q1 Dys 193 168 (0.11) 109 (0.19) 38 (0.27)
Q2 Dys 189 164 (0.10) 102 (0.18) 31 (0.26)
Q3 Dys 195 169 (0.12) 103 (0.20) 46 (0.30)
Q4 Dys 187 164 (0.10) 99 (0.21) 29 (0.29)
Q3 Dys
Q4 Dys
A B
C D
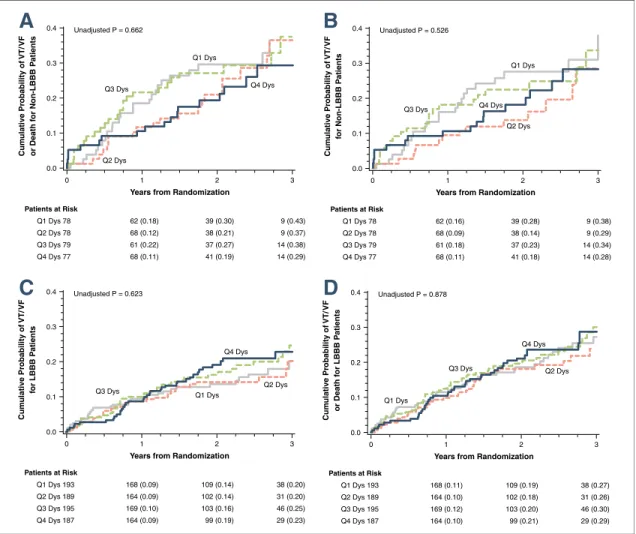
Figure 2.Cumulative Probability of VT/VF/Death and VT/VF Within Quartiles of Baseline Dyssynchrony
Kaplan-Meier estimates of the cumulative probability of(A)ventricular tachycardia (VT)/ventricular fibrillation (VF)/death in non–left bun- dle branch block (LBBB) patients,(B)VT/VF in non-LBBB patients,(C)VT/VF/Death in LBBB patients, and(D)VT/VF in LBBB patients within quartiles of baseline dyssynchrony (Dys). The Kaplan-Meier graphs present no association between baseline left ventricular (LV) dyssyn- chrony quartiles and incidence of ventricular tachyarrhythmic events in implantable cardioverter-defibrillator (ICD) patients. These results were consistent in patients with LBBB and non-LBBB electrocardiogram patterns. The majority of patients with non-LBBB had ischemic cardiomyopathy (83%) compared to LBBB patients.
Baseline left ventricular dyssynchrony. Patients with non-LBBB (n⫽312) and LBBB (n⫽764) ECG pattern showed marked heterogeneity of LV dys- synchrony before device implantation irrespective of the QRS duration (r2⫽0.025, p⬍0.001). LBBB patients exhibited more significant LV dyssyn- chrony than non-LBBB patients (186.5⫾62.1 ms vs. 167.5⫾74.5 ms, p ⫽0.001).
The most relevant baseline clinical characteristics in LBBB and non-LBBB patients are listed in Table 1. LBBB patients with more pronounced LV dyssynchrony had wider QRS complexes and worse echocardiographic parameters, lower left ventricular ejection fraction, and higher end-diastolic and end- systolic volumes. Non-LBBB patients had wider QRS-complexes and significantly lower heart rate with increasing LV dyssynchrony. Many patients
had normal B-type natriuretic peptide values, re- flecting the mildly symptomatic, asymptomatic heart failure patient population. The extent of LV dyssynchrony at baseline represented by quartiles was not predictive of higher incidence of VT/VF/
death or VT/VF in non-LBBB or LBBB patients (Fig. 2).
When assessing the risk of events, patients with non-LBBB or LBBB ECG pattern did not show increased risk of VT/VF or death and VT/VF (Table 2) with increasing quartiles of baseline dys- synchrony. Consistent with this, baseline dyssyn- chrony was not predictive of subsequent VT/
VF/death or VT/VF in ICD or CRT-D patients (Table 3).
CRT-D treatment did not modify the relation- ship between LV dyssynchrony and VT/VF/death
Table 2.Baseline LV Dyssynchrony and the Risk of Ventricular Arrhythmic Events in the Total Patient Population, Stratified by LBBB Electrocardiogram Pattern
Baseline LV Dyssynchrony*†
Endpoint VT/VF/Death
Non-LBBB (312 Patients/87 Events) LBBB (764 Patients/172 Events)
Hazard Ratio 95% CI p Value Hazard Ratio 95% CI p Value
Baseline dyssynchrony Q2 1.25 0.74–2.13 0.41 1.06 0.67–1.67 0.81
Baseline dyssynchrony Q3 0.82 0.43–1.56 0.54 0.93 0.59–1.45 0.75
Baseline dyssynchrony Q4 0.73 0.40–1.35 0.32 1.00 0.63–1.60 0.98
Endpoint VT/VF
Non-LBBB (312 Patients/73 Events) LBBB (764 Patients/136 Events)
Hazard Ratio 95% CI p Value Hazard Ratio 95% CI p Value
Baseline dyssynchrony Q2 1.04 0.57–1.90 0.90 1.21 0.70–2.06 0.50
Baseline dyssynchrony Q3 0.81 0.41–1.60 0.54 1.12 0.67–1.89 0.67
Baseline dyssynchrony Q4 0.76 0.40–1.45 0.41 1.24 0.72–2.13 0.43
*Q1 was used as reference group. †The model is adjusted for treatment, age at enrollment, ventricular arrhythmia episodes in the past, female sex, QRS duration, left ventricular ejection fraction, previous revascularization, myocardial infarction in the past, and left ventricular end-systolic volume index.
CI⫽confidence interval; other abbreviations as inTable 1.
Table 3.Baseline LV Dyssynchrony and the Risk of Ventricular Arrhythmic Events in the Total Patient Population, Stratified by Treatment Arm
Baseline LV Dyssynchrony*†
Endpoint VT/VF/Death
ICD (416 Patients/117 Events) CRT-D (661 Patients/139 Events)
Hazard Ratio 95% CI p Value Hazard Ratio 95% CI p Value
Baseline dyssynchrony Q2 1.18 0.68–2.05 0.56 1.07 0.68–1.69 0.77
Baseline dyssynchrony Q3 1.25 0.73–2.16 0.42 0.65 0.39–1.07 0.09
Baseline dyssynchrony Q4 0.95 0.55–1.75 0.98 0.83 0.51–1.35 0.46
Endpoint VT/VF
ICD (416 Patients/98 Events) CRT-D (661 Patients/107 Events)
Hazard Ratio 95% CI p Value Hazard Ratio 95% CI p Value
Baseline dyssynchrony Q2 0.92 0.50–1.72 0.80 1.29 0.76–2.19 0.35
Baseline dyssynchrony Q3 1.27 0.71–2.28 0.42 0.74 0.42–1.32 0.30
Baseline dyssynchrony Q4 0.97 0.52–1.80 0.93 1.06 0.61–1.85 0.84
*Q1 was used as reference group. †The model is adjusted for treatment, age at enrollment, ventricular arrhythmia episodes in the past, female sex, QRS duration, left ventricular ejection fraction, previous revascularization, myocardial infarction in the past, and left ventricular end-systolic volume index.
CRT-D⫽cardiac resynchronization therapy with defibrillator; ICD⫽implantable cardioverter-defibrillator; other abbreviations as inTables 1and2.
(p⫽0.27) or VT/VF (p⫽0.47) in the total patient population.
Change in left ventricular dyssynchrony. At 12- month follow-up, CRT-D patients with LBBB (n ⫽ 338) showed significant decrease in LV dyssynchrony as compared to baseline (138.0 ⫾ 63.3 ms vs. 189.4 ⫾ 63.4 ms, respectively, p ⬍ 0.001). CRT-D patients with LBBB exhibited a greater decrease of LV dyssynchrony as compared to CRT-D patients with non-LBBB (n ⫽ 135) (⫺19.2⫾49.5 ms vs.⫺2.1⫾56.4 ms, p⫽0.001).
ICD patients showed minimal changes in LV dyssynchrony as compared to patients with an implanted CRT-D (ICD 6.3 ⫾ 50.7 ms vs.
CRT-D ⫺14.3 ⫾52.1 ms; p⬍ 0.001). However, 37.5% (126 of 336 patients) of the ICD patients exhibited a 15% improvement in LV dyssynchrony as compared to 59% in the CRT-D group (281 of 473 patients, p⬍0.001). Furthermore, 111 of 336 patients (33%) in the ICD group worsened LV dyssynchrony compared to 96 of 473 patients (20%) in the CRT-D group (p ⬍0.001).
The most relevant clinical characteristics of ICD and CRT-D patients, stratified by the change of LV dyssynchrony are listed in Table 4. Patients with improving LV dyssynchrony were more likely to be female, younger, and have higher frequency of nonischemic etiology of heart failure as compared to unchanged, or worsening dyssynchrony patients, or to those with an implanted ICD. The B-type natriuretic peptide level was significantly lower in patients with improving LV dyssynchrony. The left ventricular end-diastolic and end-systolic volume percent change and left atrial volume percent change were greater in patients with improving LV dyssynchrony than in patients with no change or worsening dyssynchrony or ICD patients, showing evidence of more pronounced left ventricular re- verse remodeling. There was no difference in drug treatment among the patient subgroups. Patients with improving dyssynchrony had more often LBBB, and less often RBBB ECG pattern, than patients with worsening dyssynchrony or with an implanted ICD.
Table 4.Baseline Clinical Characteristics of ICD and CRT-D Patients Stratified by Change in LV Dyssynchrony at 1 Year
ICD (nⴝ336)
CRT-D Patients Dyssynchrony Worsening
(nⴝ96)
CRT-D Patients Dyssynchrony
No Change (nⴝ96)
CRT-D Patients Dyssynchrony
>15% Improving
(nⴝ281) p Value
Age at enrollment, yrs 64.0⫾11.1 66.9⫾10.3 64.5⫾11.5 63.8⫾11.1 0.077
Female 83 (25) 11 (11) 21 (22) 85 (30) 0.003
Change in LV dyssynchrony at 1 yr ⫺7⫾77 70⫾49 ⫺4⫾17 ⫺98⫾57 ⬍0.001
VT/VF/death after 1 yr 69 (267) 21 (75) 10 (86) 30 (251) 0.001
VT/VF after 1 yr 59 (277) 15 (81) 6 (90) 22 (259) ⬍0.001
Death after 1 yr 16 (320) 8 (88) 4 (92) 9 (272) 0.223
Nonischemic NYHA functional class II 149 (44) 31 (32) 37 (39) 148 (53) 0.002
Ischemic 187 (56) 65 (68) 59 (61) 133 (47) 0.002
LBBB at baseline 234 (70) 54 (56) 72 (75) 212 (75) 0.003
RBBB at baseline 45 (13) 13 (14) 9 (9) 25 (9) 0.273
IVCD at baseline 57 (17) 29 (30) 15 (16) 43 (15) 0.008
Prior CABG 97 (29) 34 (35) 33 (34) 56 (20) 0.004
Non-CABG revascularization before enrollment 91 (27) 38 (40) 27 (28) 68 (24) 0.038
MI before enrollment 139 (42) 55 (58) 48 (50) 102 (37) 0.002
Atrial arrhythmias before enrollment 37 (11) 15 (16) 9 (10) 26 (9) 0.365
Ventricular arrhythmias before enrollment 23 (7) 5 (5) 7 (8) 17 (6) 0.897
Creatinine at baseline, mg/dl 1.17⫾0.32 1.20⫾0.31 1.25⫾0.41 1.14⫾0.32 0.099
QRS at baseline, ms 158.7⫾20.8 152.0⫾18.9 156.6⫾16.7 159.2⫾18.3 0.004
Heart rate at baseline, beats/min 68.0⫾11.3 66.2⫾10.5 69.4⫾10.4 66.7⫾10.7 0.102
LVEF at baseline, % 29.2⫾3.3 30.3⫾3.4 29.5⫾3.3 29.7⫾3.5 0.033
LVEDV indexed by BSA, ml/m2 126.2⫾29.7 121.7⫾25.9 129.9⫾26.1 122.4⫾24.4 0.024
LVESV indexed by BSA, ml/m2 89.8⫾24.1 85.4⫾21.1 92.0⫾21.0 86.5⫾20.3 0.017
LAV indexed by BSA, ml/m2 46.7⫾10.1 45.0⫾11.1 45.6⫾10.4 45.2⫾10.2 0.072
BNP level at baseline, pg/ml 116.8⫾133.1 179.9⫾202.0 135.3⫾148.7 147.0⫾213.2 0.049
Values are mean⫾SD or n (%).
IVCD⫽intraventricular conduction delay; RBBB⫽right bundle branch block; SBP⫽systolic blood pressure; other abbreviations as inTables 1,2, and3.
In CRT-D patients with LBBB, a⬎15% decrease in LV dyssynchrony was associated with significantly lower incidence of VT/VF/death (p ⬍ 0.001) and VT/VF (p⬍0.001) as compared to ICD patients or to patients with CRT-D and unchanged, or CRT-D and worsening LV dyssynchrony (Figs. 3C and 3D).
However, in CRT-D patients without LBBB, we observed no relationship between the changes in LV dyssynchrony and VT/VF/death or VT/VF events compared to the control group of ICD implanted patients (Figs. 3A and3B).
Bundle branch block pattern significantly modified the relationship between improving dyssynchrony and the outcome of VT/VF or death (p ⫽ 0.01), and consistent with these findings, significant interaction was found between bundle branch pattern and dyssyn- chrony with regard to VT/VF (p⫽0.009) (Table 5).
At 1 year, CRT-D patients with LBBB and a
⬎15% improvement in LV dyssynchrony showed
significant, 51% risk reduction of VT/VF or death compared to ICD patients (HR: 0.49, 95% CI: 0.24 to 0.99, p ⫽ 0.049) after adjustment for relevant clinical covariates (Table 5).
Consistent with these findings, CRT-D patients with LBBB and improving LV dyssynchrony had a significant, 70% risk reduction in VT/VF events as compared to patients with an implanted ICD device (HR: 0.30, 95% CI: 0.12 to 0.77, p⫽0.01). CRT-D patients with non-LBBB ECG pattern and a⬎15%
improvement in LV dyssynchrony did not show de- crease in the risk of VT/VF/death (HR: 1.12, 95% CI:
0.48 to 2.58, p⫽0.80) or VT/VF events (HR: 1.05, 95% CI: 0.42 to 2.61, p ⫽ 0.92) as compared to patients with an implanted ICD (Table 5).
Importantly, worsening dyssynchrony was not associated with an increased risk of VT/VF/death or VT/VF in either bundle branch block pattern as compared to ICD patients (Table 5).
Probability of VT/VF/Death for Non-LBBB Patients
0.0 0.1
Years after 12 Month Echo
0.0 0.5 1.0
0.2 0.3 0.4
1.5 Dyss worse
Dyss no chg Unadjusted P = 0.217
Patients at Risk
ICD 102 87 (0.08) 64 (0.15) 47 (0.21) 28 (0.24)
Dyss Worse 42 38 (0.05) 30 (0.05) 22 (0.16) 13 (0.26)
Dyss No Chg 24 22 (0) 14 (0) 8 (0) 4 (0)
Dyss chg> -15% 69 56 (0.11) 43 (0.14) 35 (0.16) 19 (0.22)
Dyss chg> -15%
ICD
Probability of VT/VF for Non-LBBB Patients
0.0 0.1
Years after 12 Month Echo
0.0 0.5 1.0
0.2 0.3 0.4
1.5 Dyss worse
Dyss no chg Unadjusted P = 0.267
Patients at Risk
ICD 102 87 (0.07) 63 (0.13) 46 (0.19) 27 (0.22)
Dyss Worse 42 38 (0.05) 30 (0.05) 22 (0.12) 13 (0.23)
Dyss No Chg 24 22 (0) 14 (0) 8 (0) 4 (0)
Dyss chg> -15% 69 56 (0.08) 43 (0.11) 35 (0.14) 18 (0.20)
Dyss chg> -15%
ICD
Probability of VT/VF/Death for LBBB Patients
0.0 0.1
Years after 12 Month Echo
0.0 0.5 1.0
0.2 0.3 0.4
1.5 Dyss worse
Dyss no chg Unadjusted P < 0.001
Patients at Risk
ICD 234 196 (0.10) 148 (0.16) 115 (0.19) 76 (0.21)
Dyss Worse 54 44 (0.06) 34 (0.14) 20 (0.26) 10 (0.31)
Dyss No Chg 72 57 (0.10) 44 (0.12) 31 (0.12) 20 (0.15)
Dyss chg> -15% 212 196 (0.01) 155 (0.03) 120 (0.04) 77 (0.06) Dyss chg> -15%
ICD
Probability of VT/VF for LBBB Patients
0.0 0.1
Years after 12 Month Echo
0.0 0.5 1.0
0.2 0.3 0.4
1.5 Dyss worse
Dyss no chg Unadjusted P < 0.001
Patients at Risk
ICD 234 196 (0.09) 148 (0.13) 115 (0.16) 76 (0.17)
Dyss Worse 54 44 (0.04) 34 (0.10) 20 (0.19) 10 (0.19)
Dyss No Chg 72 57 (0.07) 44 (0.09) 31 (0.09) 20 (0.09)
Dyss chg> -15% 212 196 (0.01) 155 (0.03) 120 (0.03) 77 (0.05) Dyss chg> -15%
ICD
A
C
B
D
Figure 3.Cumulative Probability of VT/VF/Death and VT/VF by Change in LV Dyssynchrony
Kaplan-Meier estimates of the cumulative probability of(A)VT/VF/death in non-LBBB patients,(B)VT/VF in non-LBBB patients, (C)VT/VF/Death in LBBB patients,(D)VT/VF in LBBB patients. In CRT-D patients with LBBB, a⬎15% decrease in LV dyssynchrony (Dyss) at 1-year was associated with less VT/VF/death and VT/VF as compared to ICD patients or to CRT-D patients with
unchanged, or worsening LV dyssynchrony. In CRT-D patients with non-LBBB, we did not find an association between improved LV dyssynchrony and lower incidence of ventricular tachyarrhythmias. Patients with non-LBBB had mainly ischemic cardiomyopathy compared to LBBB patients. Abbreviations as inFigures 1and2.
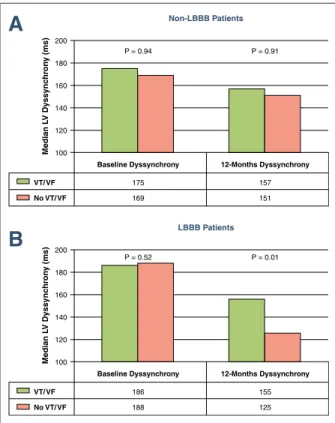
CRT-D patients with LBBB and no VT/VF events exhibited a significant decrease in LV dys- synchrony as compared to patients with LBBB and VT/VF events, who did not decrease or even increased the degree of LV dyssynchrony from baseline (p ⫽ 0.014). In CRT-D patients with non-LBBB, the change in LV dyssynchrony was not associated with a decrease of VT/VF events (p⫽ 0.994) (Fig. 4).
D I S C U S S I O N
This study demonstrated that CRT-D patients with LBBB and improving LV dyssynchrony at 1 year had significant risk reduction of the first VT/VF/death and VT/VF as compared to ICD patients. Worsening dyssynchrony in CRT-D pa- tients was not associated with increased risk of the first VT/VF/death or VT/VF as compared to ICD patients. CRT-D patients with non-LBBB did not show decrease in the first VT/VF/death or VT/VF with improving LV dyssynchrony compared to ICD patients. Baseline LV dyssynchrony was not predictive of increased risk of first VT/VF/death or VT/VF in asymptomatic or mildly symptomatic heart failure patients in either treatment arm with either bundle branch pattern.
Previous studies suggested that LV dyssynchrony might be related to cardiac events in heart failure patients (23). Cho et al. (24,25) demonstrated that mechanical dyssynchrony was a powerful predictor of mortality or cardiac events in heart failure patients with normal and wide QRS. Penicka et al. (26),
Fauchier et al. (27), and Bader et al. (28) reported that LV dyssynchrony was prognostic of cardiac endpoints.
These studies analyzed heart failure patients without implantable devices (ICD or CRT) and used either radionuclide technique or pulsed-wave tissue Doppler imaging to evaluate LV dyssynchrony.
However, several other studies demonstrated that a greater degree of baseline LV dyssynchrony predicts better outcome after CRT implantation (29–37). The MIRACLE (Multicenter InSync Randomized Clinical Evaluation) and the CARE-HF (Cardiac Resynchronization–Heart Failure) trials showed that interventricular mechanical delay was a pow- erful prognostic factor of better outcome in both the control and the treatment group (32).
Haguaa et al. (38) showed that mechanical dis- persion assessed by strain echocardiography was an independent predictor of arrhythmia events in a smaller patient cohort after myocardial infarction.
LBBB patients were excluded from this analysis.
Another paper from this group showed similar effects of dyssynchrony in nonischemic cardiomy- opathy patients (39).
Our study is the first report to analyze VT/VF events and LV dyssynchrony in mild heart failure patients with LBBB and an implanted CRT-D device and comparing them to patients with non- LBBB. Although previous work has shown im- provement in ventricular remodeling associated with improvement in synchrony (21,22,40 – 42), we also demonstrated that improved synchrony might translate into reduction of ventricular arrhythmic events in LBBB patients. The reduction of VT/VF
Table 5.Change in LV Dyssynchrony and Risk of Ventricular Arrhythmic Events in CRT-D LBBB and Non-LBBB Patients Change in LV Dyssynchrony*
Endpoint VT/VF/Death Parameter
No. of Patients
Non-LBBB Patients (237 Patients/40 Events)
No. of Patients
LBBB Patients (572 Patients/77 Events)
Interaction p Value Hazard
Ratio 95% CI p Value
Hazard
Ratio 95% CI p Value
Dyssynchrony improving 15%:ICD 69:102 1.12 0.48–2.58 0.80 212:234 0.49 0.24–0.99 0.049 0.01
Dyssynchrony no change:ICD 24:102 NA 72:234 1.13 0.49–2.60 0.78 NA
Dyssynchrony worsening:ICD 42:102 1.07 0.46–2.52 0.88 54:234 1.80 0.83–3.90 0.14 0.53
Endpoint VT/VF Parameter
No. of Patients
Non-LBBB Patients (237 Patients/34 Events)
No. of Patients
LBBB Patients (572 Patients/56 Events)
Interaction p Value Hazard
Ratio 95% CI p Value
Hazard
Ratio 95% CI p Value
Dyssynchrony improving 15%:ICD 69:102 1.05 0.42–2.61 0.92 212:234 0.30 0.12–0.77 0.01 0.009
Dyssynchrony no change:ICD 24:102 NA 72:234 0.58 0.18–1.89 0.37 NA
Dyssynchrony worsening:ICD 42:102 0.90 0.35–2.32 0.83 54:234 0.95 0.35–2.60 0.93 0.94
*The model is adjusted for age at enrollment, previous ventricular arrhythmias, left ventricular ejection fraction, female sex, myocardial infarction in the past, revascularization in the past, QRS duration, and left ventricular end-diastolic volume percent change.
NA⫽not applicable; other abbreviations as inTables 1,2, and3.
episodes in LBBB patients with improving LV dys- synchrony might be explained by the more homoge- nous left ventricular mechanical activation followed by the electrical resynchronization itself (“mechanical to electrical feedback”). Electrical resynchronization is characterized by more uniform alterations in refracto- riness, which might result in reduction of macro re-entry arrhythmias (27). The reduction in LV dys- synchrony might be correlated to the reduction in LV volumes and favorable outcome as reported in this patient cohort previously (21).
In the present study, LV dyssynchrony improve- ment at 1 year, but not baseline LV dyssynchrony was proven to be a strong predictor of ventricular tachyarrhythmic events even after adjustment for left ventricular end-diastolic volume change in the multivariate Cox-model. We hypothesize that im- provement in LV dyssynchrony and reverse remod- eling are both surrogate markers of a favorable arrhythmic response to CRT.
Patients with non-LBBB receiving CRT-D did not appear to benefit from improvement in LV dyssynchrony. One possible explanation for this lack of benefit might be the significant overlap of non- LBBB ECG pattern and patients with ischemic etiology, in whom there may be a more heterogeneous left ventricular activation and a greater degree of ischemic scar which likely contributes to arrhythmo- genesis. Although CRT is able to reduce LV dyssyn- chrony and the heterogeneity of left ventricular acti- vation, the arrhythmogenic potential represented by the scar tissue might remain the same.
The strength of this analysis is ICD patients serving as a control group and the change in LV dyssynchrony at 1 year was categorized into 3 groups: improving, unchanged, or worsening LV dyssynchrony. Importantly, patients with dyssyn- chrony improvement showed significant risk reduc- tion in ventricular arrhythmic events, whereas pa- tients with worsening dyssynchrony did not show an increased risk of ventricular arrhythmias.
A small proportion of ICD patients exhibited a 15% improvement in LV dyssynchrony, which might be contributed to the improved medical treatment in this patient group. These data are in alignment with our previous study on LV dyssynchrony (21).
Study limitations. A possible limitation of our study is the higher variation of LV dyssynchrony measure- ments when compared to other established echocar- diographic data (LVEF or LV volumes). The number of patients in the unchanged and worsening LV dyssynchrony subgroups was small, especially in the non-LBBB patient group, which might be a limitation of this analysis. There are limited numbers of speckles to track in the transverse direction and the reproduc- ibility of this method has therefore been questioned.
However, speckle tracking imaging has better repro- ducibility than magnetic resonance imaging tagging or other echo modalities to assess LV dyssynchrony (43).
In addition, we reported excellent reproducibility with this technique in our echocardiography laboratory (22). Another limitation of this analysis might be that we only evaluated strain during systole; however, maximum shortening might occur during diastole (post-systolic shortening) in patients with LBBB.
C O N C L U S I O N S
Our study demonstrates that CRT-induced im- provement in LV dyssynchrony in patients with LBBB was associated with significant risk reduction of first VT/VF/death and VT/VF as compared to ICD patients. In asymptomatic or mildly symptom-
Baseline Dyssynchrony P = 0.52
186 188
LBBB Patients
12-Months Dyssynchrony P = 0.01
155 125
Median LV Dyssynchrony (ms)
100 120 140 160 180 200
VT/ VF No VT/ VF
Baseline Dyssynchrony P = 0.94
175 169
Non-LBBB Patients
12-Months Dyssynchrony P = 0.91
157 151
Median LV Dyssynchrony (ms)
100 120 140 160 180 200
VT/ VF No VT/ VF
A
B
Figure 4.Change in LV Dyssynchrony in CRT-D Non-LBBB and LBBB Patients With Ventricular Arrhythmic Events or No Events (A)In CRT-D patients with non-LBBB, there was no difference in base- line or 12-month LV dyssynchrony whether patients had a ventricular tachyarrhythmic event(green bars)or did not(pink bars).(B)In CRT-D patients with LBBB and no ventricular arrhythmias, there was a significant decrease in LV dyssynchrony, whereas in patients with ven- tricular tachyarrhythmias, no decrease in LV dyssynchrony was observed. Abbreviations as inFigures 1and2.