water
Article
Isotopic ‘Altitude’ and ‘Continental’ E ff ects in Modern Precipitation across the
Adriatic–Pannonian Region
Zoltán Kern1,* , István Gábor Hatvani1 , György Czuppon1,2, István Fórizs1 , Dániel Erdélyi1,3, Tjaša Kanduˇc4, LászlóPalcsu2and Polona Vreˇca4
1 Institute for Geological and Geochemical Research, Research Centre for Astronomy and Earth Sciences, MTA Centre for Excellence, Budaörsiút 45, H-1112 Budapest, Hungary; hatvaniig@gmail.com (I.G.H.);
czuppon@geochem.hu (G.C.); forizs@geochem.hu (I.F.); danderdelyi@gmail.com (D.E.)
2 Isotope Climatology and Environmental Research Centre (ICER), Institute for Nuclear Research, Bem tér 18/c, H-4026 Debrecen, Hungary; palcsu.laszlo@atomki.mta.hu
3 Centre for Environmental Sciences, Department of Geology, Eötvös Loránd University, Pázmány Péter stny 1, H-1117 Budapest, Hungary
4 Department of Environmental Sciences, Jožef Stefan Institute, Jamova cesta 39, 1000 Ljubljana, Slovenia;
tjasa.kanduc@ijs.si (T.K.); polona.vreca@ijs.si (P.V.)
* Correspondence: zoltan.kern@gmail.com; Tel.:+36-70-253-8188
Received: 17 April 2020; Accepted: 19 June 2020; Published: 24 June 2020
Abstract: It is generally observed that precipitation is gradually depleted in18O and2H isotopes as elevation increases (‘altitude’ effect) or when moving inland from seacoasts (‘continental’ effect);
the regionally accurate estimation of these large-scale effects is important in isotope hydrological or paleoclimatological applications. Nevertheless, seasonal and spatial differences should be considered.
Stable isotope composition of monthly precipitation fallen between January 2016 and December 2018 was studied for selected stations situated along an elevation transect and a continental transect in order to assess the isotopic ‘altitude’ and ‘continental’ effects in modern precipitation across the Adriatic–Pannonian region. Isotopic characteristics argue that the main driver of the apparent vertical depletion of precipitation in heavy stable isotopes is different in summer (raindrop evaporation) and winter (condensation), although, there is no significant difference in the resulting ‘altitude’ effect.
Specifically, an ‘altitude’ effect of−1.2%/km forδ18O and−7.9%/km forδ2H can be used in modern precipitation across the Adriatic–Pannonian region. Isotopic characteristics of monthly precipitation showed seasonally different patterns and suggest different isotope hydrometeorological regimes along the continental transect. While no significant decrease was found inδ18O data moving inland from the Adriatic from May to August of the year, a clear decreasing trend was found in precipitation fallen during the colder season of the year (October to March) up to a break at ~400 km inland from the Adriatic coast. The estimated mean isotopic ‘continental’ effect for the colder season precipitation is−2.4%/100 km inδ18O and−20%/100 km inδ2H. A prevailing influence of the Mediterranean moisture in the colder season is detected up to this breakpoint, while the break in theδ18O data probably reflects the mixture of moisture sources with different isotopic characteristics. A sharp drop in the d-excess (>3%) at the break in precipitationδ18O trend likely indicates a sudden switch from the Mediterranean moisture domain to additional (mainly Atlantic) influence, while a gradual change in the d-excess values might suggest a gradual increase of the non-Mediterranean moisture contribution along the transect.
Keywords: stable isotopes; oxygen; hydrogen; d-excess; elevation effect; altitude effect; continental effect; Slovenia; Hungary
Water2020,12, 1797; doi:10.3390/w12061797 www.mdpi.com/journal/water
1. Introduction
Precipitation is a key element of the atmospheric branch of the water cycle, and the study of precipitation is essential for improving the understanding of the Earth’s water balance on both regional and global scales [1]. An important method for tracing the water cycle is that of comparing the ratios of heavy to light stable isotopes of hydrogen and oxygen (2H/1H;18O/16O) in the water molecule [2–4].
The ratio of heavy to light stable isotopes is traditionally expressed as per mil (%) deviation relative to Vienna Standard Mean Ocean Water (VSMOW), and delta notation (δ18O andδ2H) is commonly used to report the measured isotope variations [5].
It is generally observed that precipitation is gradually depleted in18O and2H isotopes as elevation increases [6]. The phenomenon is commonly called the ‘altitude’ effect and primarily results from the cooling of the air masses as they ascend on a mountain, accompanied by the rainout of the excess moisture [7,8]. In case of precipitationδ18O a gradient with elevation has a global average of−2.8%/km, ranging from−1.7 to−5.0%/km; the European average is−2.1%/km [9]. A similar general observation is that precipitation is gradually depleted in18O and2H isotopes when moving inland from seacoasts.
This phenomenon is called the ‘continental’ effect, and it reflects the gradual depletion of the residual marine moisture in heavy isotopes during the sequential rainout as air masses travel from the marine moisture source to the center of the continents [6]. In the case of Europe, for example, a gradient in the long-term mean precipitationδ18O shows an ~8%decrease over a distance of approximately 4000 km from the Irish coasts to the foothills of the Ural Mountains [10]. Besides the above-mentioned ones, there are a few other empirical relationships observed between environmental parameters and the stable hydrogen and oxygen isotope composition of precipitation, such as ‘temperature’, ‘latitude’ and
‘amount’ effects [6,10].
These large-scale effects are also important from a practical point of view because they have enabled useful applications in isotope hydrology (e.g., identification of the mean elevation of groundwater recharge [11,12]), paleoclimatology [13], paleoaltimetry [14], food authenticity [15], etc. However, numerous studies have reported seasonal and spatial differences in both ‘altitude’ [16–19] and
‘continental’ effects [10,20,21]. Therefore, the regional estimation of these empirical relations in modern precipitation is critically important for underpinning the application of appropriate gradient values to subcontinental scale (e.g., river basin) practical problems (e.g., estimation of mean recharge area [22]) or paleoclimatological comparisons [13].
The aim of the study is to assess the isotopic ‘altitude’ and ‘continental’ effects in modern precipitation across the Adriatic–Pannonian region, specifically to (i) check the potential seasonal changes and (ii) determine the characteristic gradients specifically for this region which can be applied in isotope hydrological/hydrogeological studies and other research in the future.
2. Study Area and Main Moisture Sources
The Adriatic–Pannonian region encompasses the northern part of Southeast Europe and the eastern part of Central Europe. The Mediterranean Sea was identified as the main marine moisture source for Central and Southeastern Europe [23–25], and changes in its moisture supply have a decisive role on dryness conditions in this region [26]. More specifically, the Western and Central Mediterranean are the dominant marine moisture source regions throughout the year, although locally recycled continental moisture is the dominant source of the atmospheric moisture in the summer [24]. At the northern part of the study region, the westerlies transport Atlantic marine moisture mixed with recycled terrestrial moisture from Western and West-Central Europe, in addition to the Mediterranean moisture contribution [27,28]. Studies dealing with single precipitation events in Eastern Hungarian localities found occasional moisture contributions from eastern and northern directions mostly in the October to March period [27,28].
The surface water of the Mediterranean Sea is more enriched in heavy isotopes than Atlantic surface water [29]. This feature and the distinct evaporative conditions in these regions imprint the
Water2020,12, 1797 3 of 13
resultant atmospheric moisture with a source-specific isotopic signature (e.g., see [30,31]; more details in Section4.2).
3. Data and Methods
Stable hydrogen and oxygen isotope compositions (δ2H and δ18O) of monthly aggregated precipitation were gathered from the national precipitation monitoring networks of Austria [32], Slovenia [33,34] and Hungary [35] and from additional individual stations with accessible data, namely Debrecen [36] and Hraš´cica [37], from three consecutive years (2016, 2017, 2018). Subsets suitable for assessing the ‘altitude’ and ‘continental’ effects have been selected from the gathered data set (Figure1).
The sampling methods might be different among the stations, but they always employed a collector configuration recommended for precipitation isotope analysis [38]. The analytical techniques may also differ between data sources (e.g., mass spectrometry for Slovenian samples, laser spectroscopy for the Hungarian and Croatian samples); however, the raw values were converted by all laboratories to the same international reference scale (VSMOW/SLAP), ensuring comparability and joint assessment of the data. In addition, measurements were carried out together with laboratory reference materials that are calibrated periodically against primary IAEA calibration standards to VSMOW/SLAP scale.
The highest estimated uncertainties of the data are±1%and±0.3%forδ2H andδ18O, respectively.
Water 2020, 12, x FOR PEER REVIEW 3 of 13
3. Data and Methods
Stable hydrogen and oxygen isotope compositions (δ2H and δ18O) of monthly aggregated precipitation were gathered from the national precipitation monitoring networks of Austria [32], Slovenia [33,34] and Hungary [35] and from additional individual stations with accessible data, namely Debrecen [36] and Hrašćica [37], from three consecutive years (2016, 2017, 2018). Subsets suitable for assessing the ‘altitude’ and ‘continental’ effects have been selected from the gathered data set (Figure 1). The sampling methods might be different among the stations, but they always employed a collector configuration recommended for precipitation isotope analysis [38]. The analytical techniques may also differ between data sources (e.g., mass spectrometry for Slovenian samples, laser spectroscopy for the Hungarian and Croatian samples); however, the raw values were converted by all laboratories to the same international reference scale (VSMOW/SLAP), ensuring comparability and joint assessment of the data. In addition, measurements were carried out together with laboratory reference materials that are calibrated periodically against primary IAEA calibration standards to VSMOW/SLAP scale. The highest estimated uncertainties of the data are ±1‰ and
±0.3‰ for δ2H and δ18O, respectively.
Stations situated within a relatively close distance but spanning a pronounced elevation range (from 282 to 2515 m a.s.l.) around the Slovenian–Austrian border (Figure 1 and Table 1) offer the opportunity to estimate the regional ‘altitude’ effect in modern precipitation in the Adriatic–
Pannonian region. Due to the restricted latitudinal extension of this elevation transect, latitudinal or continental dependence are assumed to have only a negligible effect on the stable isotope composition of precipitation and a similarly uniform moisture source can be plausibly assumed for these closely located stations. The elevation range of this transect practically comprises the elevation extent of the entire Adriatic–Pannonian region, so the derived empirical relation should be applicable to the entire region.
Figure 1. The study area and the location of the precipitation stable isotope monitoring stations. The sites used in the evaluation of the ‘continental‘ effect are indicated by white dots, while the ones used in studying the ‘altitude’ effect are indicated by black dots; Ljubljana was used in both. Site details can be found in Table 1. The black rectangle in the inset map of Europe shows the position of the studied region. Country map of Europe by FreeVectorMaps.com. Digital elevation model taken from http://srtm.csi.cgiar.org/.
Figure 1. The study area and the location of the precipitation stable isotope monitoring stations.
The sites used in the evaluation of the ‘continental‘ effect are indicated by white dots, while the ones used in studying the ‘altitude’ effect are indicated by black dots; Ljubljana was used in both. Site details can be found in Table1. The black rectangle in the inset map of Europe shows the position of the studied region. Country map of Europe by FreeVectorMaps.com. Digital elevation model taken from http://srtm.csi.cgiar.org/.
Stations situated within a relatively close distance but spanning a pronounced elevation range (from 282 to 2515 m a.s.l.) around the Slovenian–Austrian border (Figure1and Table1) offer the opportunity to estimate the regional ‘altitude’ effect in modern precipitation in the Adriatic–Pannonian region. Due to the restricted latitudinal extension of this elevation transect, latitudinal or continental dependence are assumed to have only a negligible effect on the stable isotope composition of precipitation and a similarly uniform moisture source can be plausibly assumed for these closely located stations. The elevation range of this transect practically comprises the elevation extent of
the entire Adriatic–Pannonian region, so the derived empirical relation should be applicable to the entire region.
To study the continental effect, stations situated along a ~750 km transect, stretching in a SW–NE direction from the Adriatic coast (Istria) to the NE corner of the Great Hungarian Plain, were selected (Figure1and Table1). To eliminate potential interference with ‘altitude’ effect, only stations below 350 m a.s.l. were considered. This transect was chosen due to the predominance of the Mediterranean as the moisture source over the studied region [25,26].
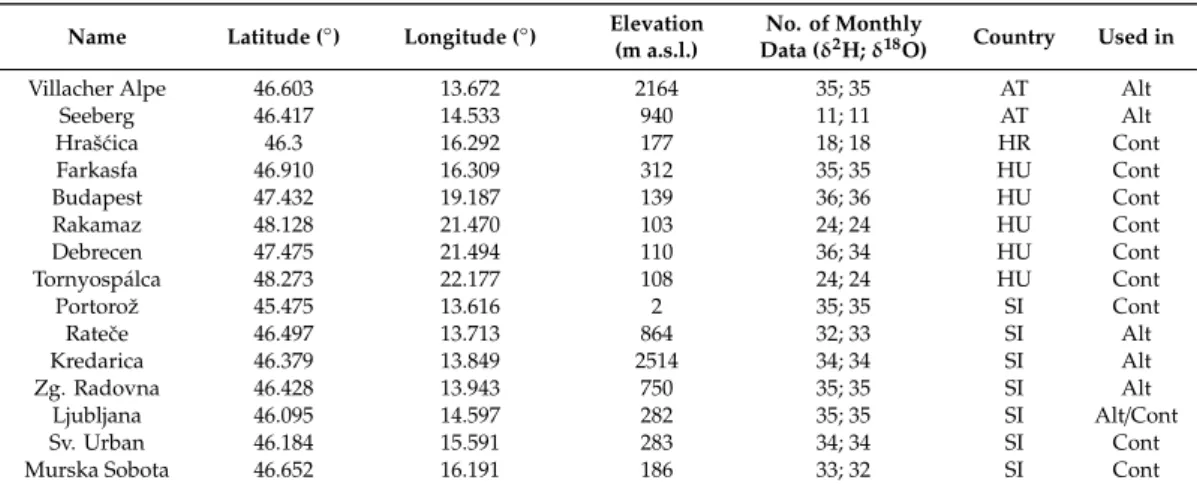
Table 1.Basic geographical information of precipitation stable isotope monitoring stations operating in East-Central Europe between January 2016 and December 2018. Country codes follow the ISO-3166-1 ALPHA-2 standard. Latitude and longitude are in WGS84 projection; EPSG: 4326.
Name Latitude (◦) Longitude (◦) Elevation (m a.s.l.)
No. of Monthly
Data (δ2H;δ18O) Country Used in
Villacher Alpe 46.603 13.672 2164 35; 35 AT Alt
Seeberg 46.417 14.533 940 11; 11 AT Alt
Hraš´cica 46.3 16.292 177 18; 18 HR Cont
Farkasfa 46.910 16.309 312 35; 35 HU Cont
Budapest 47.432 19.187 139 36; 36 HU Cont
Rakamaz 48.128 21.470 103 24; 24 HU Cont
Debrecen 47.475 21.494 110 36; 34 HU Cont
Tornyospálca 48.273 22.177 108 24; 24 HU Cont
Portorož 45.475 13.616 2 35; 35 SI Cont
Rateˇce 46.497 13.713 864 32; 33 SI Alt
Kredarica 46.379 13.849 2514 34; 34 SI Alt
Zg. Radovna 46.428 13.943 750 35; 35 SI Alt
Ljubljana 46.095 14.597 282 35; 35 SI Alt/Cont
Sv. Urban 46.184 15.591 283 34; 34 SI Cont
Murska Sobota 46.652 16.191 186 33; 32 SI Cont
To statistically investigate the ‘altitude’ and ‘continental’ effects, the monthly precipitation stable isotope values were plotted against station elevation and distance from the Adriatic coast, respectively.
Next, linear trendlines were fitted with least squares regression and the fits’ statistics were investigated (slope (coefficients),p, adjustedr2). Only the slope coefficients with their significance at the usually applied significance thresholds are presented. Besides the overall trends, in the seasonal (winter and summer half-years) difference in ‘altitude’ effect was explored with an independent sample Mann–Whitney U-test (MW U-test) [39].
Deuterium excess (d-excess), defined as d=δ2H−8×δ18O [6] was also calculated. The uncertainty of d-excess is≤1.3%, as propagated from the highest uncertainties of the primary isotopic parameters.
This second-order isotopic parameter is a useful tracer of the origin of moisture because it is relatively invariant during transport and during the formation of condensate accompanied by equilibrium isotopic fractionation [40] but is an informative indicator of non-equilibrium isotopic effects [6] and the mixing of moistures of different origin [41].
4. Results and Discussion
Inδ-δspace, the global meteoric water line [42] fits nicely to the used data (Figure S1), certifying that the isotopic compositions correspond to precipitation origin. Due to the strong linear relationship betweenδ2H andδ18O in precipitation (Figure S1), the results for ‘altitude’ and ‘continental’ effects on the monthly scale are only presented graphically forδ18O for the studied 36-month period between 2016 January and 2018 December.
4.1. ‘Altitude’ Effect
The analysis of the precipitationδ18O gradient indicated a decreasing trend in most of the months, ranging from 0.1 to−3.5%/km (Figure2a). The distribution of these monthlyδ18O lapse rates tends to be higher than the reported global range (from−1.7 to−5%/km [9]), although overlapping with the upper portion of the global range, and corresponds well with the range of other large-scale
Water2020,12, 1797 5 of 13
compilations [8]. The fitted linear slope was significant in roughly half of the cases, and most of the insignificant (p>0.1) trends were observed in the October–March half-year (59% in the case ofδ18O, 62.5% in the case ofWater 2020, 12, x FOR PEER REVIEW δ2H). 5 of 13
Figure 2. Stable isotope characteristics of monthly precipitation along a representative elevation transect in the Adriatic–Pannonian region: δ18O (a) and deuterium excess (d-excess) (b) vs. elevation.
Best fit lines (blue) for precipitation δ18O data and elevation are plotted. The slope and significance of the linear fit are coded as α-values of 0.01, 0.05 or 0.1 and are marked with (***), (**) or (*), respectively.
Figure 2. Stable isotope characteristics of monthly precipitation along a representative elevation transect in the Adriatic–Pannonian region:δ18O (a) and deuterium excess (d-excess) (b) vs. elevation.
Best fit lines (blue) for precipitationδ18O data and elevation are plotted. The slope and significance of the linear fit are coded asα-values of 0.01, 0.05 or 0.1 and are marked with (***), (**) or (*), respectively.
Corresponding d-excess values along the elevation transect show a different vertical pattern when comparing colder (October to March) and warmer (April to September) months (Figure2b).
While d-excess values are scattered in a relatively narrow range without any systematic shift along the elevation gradient in the colder season, steep gradients with low d-excess values for low elevation stations can be seen in the warmer season (Figure2b). This suggests distinct isotopic precipitation regimes for the warmer and colder parts of the year.
According to the classical concept of Rayleigh rainout, process whatever isotopic properties acquired by the cloud before, precipitation is removed under isotopic equilibrium conditions [6]. Under this ideal Rayleigh rainout scenario, the atmospheric moisture is depleted in heavy isotope content commensurate with the loss of moisture by precipitation; the d-excess during this process remains invariant [43], even though there is a tendency for an increase in this value at higher elevations [8].
The remarkably constant d-excess data along the elevation transect suggests a single dominant moisture source during the colder season [19]. Thus, in winter conditions, Rayleigh rainout effect can be taken as the predominant one, with a single dominating moisture source and with the moisture mass ascending to form orographic precipitation which is continuously depleted in heavy isotopes with increasing elevation [8,19]. However, the change of d-excess values along the elevation transect in the warmer season suggests that other factors which change the isotope composition besides the basic Rayleigh effect need to be considered. Evaporative enrichment of isotopes in raindrops during the fall beneath the cloud base reduces the d-excess [6,44]. The amplification of this effect is indeed expected in the warmer season; and it is expected to be larger at low elevations, conforming to the observed vertical d-excess trend (Figure2b). Therefore, this appears to be a ‘pseudo-altitude effect’ [45] when vertical change of stable isotopes in precipitation is not due to the rainout of vapor of a single origin [8].
It should be noted that precipitation is dominantly rain in the warmer season over the studied elevation transect; while in the colder season, only snow is expected above ~1000 m, and a mixture of snow and rain is expected in the lower part of the transect. Since vapor→ice fractionation is slightly larger than vapor→water fractionation around the altitude where the regime switches from rain to snow (roughly corresponding to the 0◦C isotherm), the condensed hydrometeor is expected to be less depleted in heavy isotopes than it would be if the vapor→water fractionation was still in action.
This phenomenon might be an additional effect that influences the monotony of the vertical upward decrease in precipitationδ18O and causes the fitted linear regression to be frequently non-significant in the colder season.
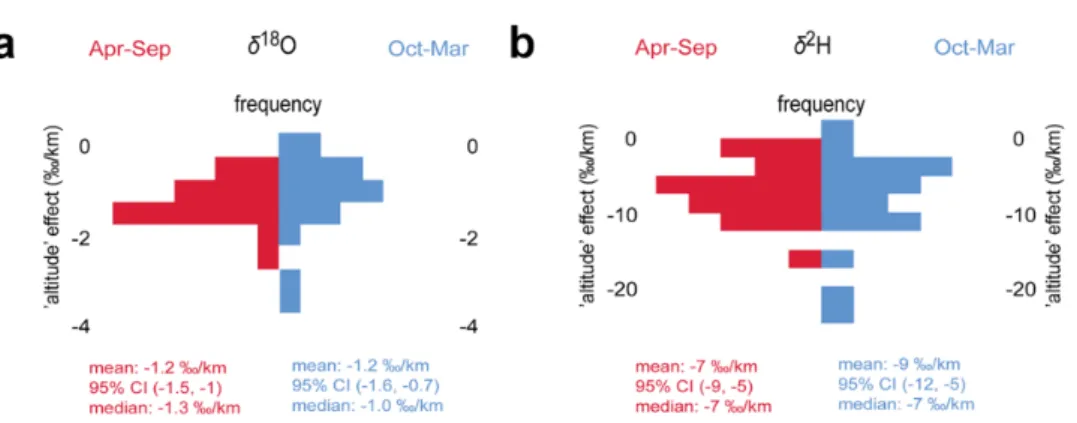
Comparing the frequency distribution of monthly estimated ‘altitude’ effect for the colder and warmer seasons for the 2016–2018 period (Figure3), no significant difference is found in the seasonal distributions (p= 0.351 forδ18O andp= 0.832 forδ2H according to the MW U-Test) despite the undeniably different responsible processes dictating the vertical trend of precipitation stable isotopes in the warmer and colder seasons. Hence, from a practical point of view, the mean of the monthly gradients calculated for the studied 3-year-long period (δ18O:−1.2%/km;δ2H:−7.9%/km) can be considered as empirical isotopic ‘altitude’ effect in modern precipitation across the Adriatic–Pannonian region.
The estimated ‘altitude’ effect based on spring waterδ18O values (−1.1%/km [22]) investigated between 2005 and 2007 in the vicinity of the studied elevation transect (in the valley of the Radovna River in NW Slovenia) is in good agreement with the current results. Comparing these results to former studies from the region, which typically employed fewer stations and/or a narrower elevation range, one can say that the magnitude of the determined isotopic ‘altitude’ effect tends to be smaller than theδ18O vertical gradient calculated to the south of the study area, e.g., near Zagreb (−2.8%/km) [46]
or in the northern Adriatic (−3.0%/km) [47]. However, at the northern border of the study area, in the Western Carpathians, the ‘altitude’ effect estimated both from spring waterδ18O values (−1.0 to
−1.5%/km) [48] and from precipitationδ18O values (−2.1%/km) [49] is relatively closer to the empirical δ18O lapse rate obtained here for modern precipitation. At the eastern border of the study area, in the Eastern Carpathians, the estimated long-term ‘altitude’ effect based on spring waterδ18O values also returned comparable results (−1.5%/km [50]).
Water2020,12, 1797 7 of 13
Water 2020, 12, x FOR PEER REVIEW 7 of 13
former studies from the region, which typically employed fewer stations and/or a narrower elevation range, one can say that the magnitude of the determined isotopic ‘altitude’ effect tends to be smaller than the δ18O vertical gradient calculated to the south of the study area, e.g., near Zagreb (−2.8‰/km) [46] or in the northern Adriatic (−3.0‰/km) [47]. However, at the northern border of the study area, in the Western Carpathians, the ‘altitude’ effect estimated both from spring water δ18O values (−1.0 to −1.5‰/km) [48] and from precipitation δ18O values (−2.1‰/km) [49] is relatively closer to the empirical δ18O lapse rate obtained here for modern precipitation. At the eastern border of the study area, in the Eastern Carpathians, the estimated long-term ‘altitude’ effect based on spring water δ18O values also returned comparable results (−1.5‰/km [50]).
Figure 3. Frequency distribution of ‘altitude’ effects estimated from monthly precipitation δ18O (a) and δ2H (b) data for colder (October to March) and warmer (April to September) seasons.
4.2. ‘Continental’ Effect
As an initial observation, one can see that the seasonal change in precipitation stable isotopes is well reflected by the shifting of the whole data set, with more negative δ18O values seen in winter and less negative δ18O values in summer in each studied year. The monthly patterns in precipitation δ18O values along the transect streching from the Adriatic coast to the northeastern corner of the Great Hungarian Plain did not indicate any trend in precipitation δ18O data from May to August (Figure 4a). However, a generally negative gradient is outlined for the dataset from April to September, resembling an expected ‘continental’ effect.
A similar seasonal contrast has been reported for the long-term mean δ2H gradient along the Atlantic stormtrack in Western Europe and was explained by enhanced raindrop evaporation in summertime at inland locations [20]. Occasionally, a remarkable shift (~10‰) can be seen (e.g., June and July 2017) toward lower d-excess values for single inland stations, which might indicate a kinetic isotope effect such as raindrop evaporation (Figure 4b). However, the situation seems to be more complicated here because usually there is no visible shift toward lower d-excess values during the summer months (see e.g., 2018) or, at most, a wide scattering (e.g., May 2016) can be observed (Figure 4b). The absence of a ‘continental’ effect was reported over the Amazon Basin [51], which was explained by the intense terrestrial moisture recycling [52]. In the studied region , summer is the high season for vegetation activity, accompanied by the highest transpiration flux within the year.
Transpiration is essentially a non-fractionation process [53] and thus re-introduces isotopically unchanged water to the atmosphere through evapotranspiration. The large-scale dominance of transpired moisture might explain the coupled lack of trend of δ18O and d-excess values, while the variable importance of evaporation and transpiration might spoil the empirical isotopic ‘continental’
effect and cause an accompanying wide scattering in d-excess values in precipitation. Supporting this explanation, Lagrangian moisture source modeling clearly indicated the dominant contribution of locally recycled continental moisture in the summer precipitation for Southeastern Europe [24].
Figure 3.Frequency distribution of ‘altitude’ effects estimated from monthly precipitationδ18O (a) and δ2H (b) data for colder (October to March) and warmer (April to September) seasons.
4.2. ‘Continental’ Effect
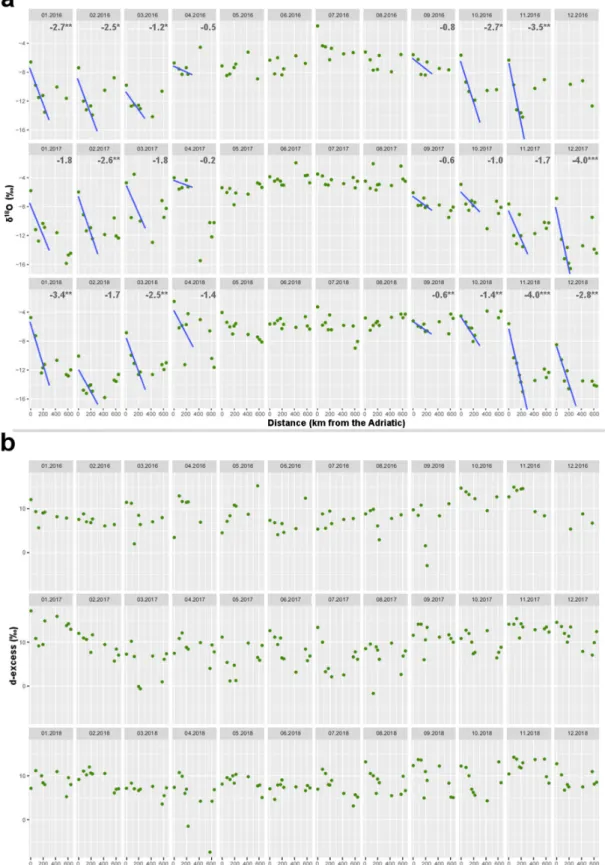
As an initial observation, one can see that the seasonal change in precipitation stable isotopes is well reflected by the shifting of the whole data set, with more negativeδ18O values seen in winter and less negativeδ18O values in summer in each studied year. The monthly patterns in precipitation δ18O values along the transect streching from the Adriatic coast to the northeastern corner of the Great Hungarian Plain did not indicate any trend in precipitationδ18O data from May to August (Figure4a).
However, a generally negative gradient is outlined for the dataset from April to September, resembling an expected ‘continental’ effect.
A similar seasonal contrast has been reported for the long-term meanδ2H gradient along the Atlantic stormtrack in Western Europe and was explained by enhanced raindrop evaporation in summertime at inland locations [20]. Occasionally, a remarkable shift (~10%) can be seen (e.g., June and July 2017) toward lower d-excess values for single inland stations, which might indicate a kinetic isotope effect such as raindrop evaporation (Figure4b). However, the situation seems to be more complicated here because usually there is no visible shift toward lower d-excess values during the summer months (see e.g., 2018) or, at most, a wide scattering (e.g., May 2016) can be observed (Figure4b).
The absence of a ‘continental’ effect was reported over the Amazon Basin [51], which was explained by the intense terrestrial moisture recycling [52]. In the studied region, summer is the high season for vegetation activity, accompanied by the highest transpiration flux within the year. Transpiration is essentially a non-fractionation process [53] and thus re-introduces isotopically unchanged water to the atmosphere through evapotranspiration. The large-scale dominance of transpired moisture might explain the coupled lack of trend ofδ18O and d-excess values, while the variable importance of evaporation and transpiration might spoil the empirical isotopic ‘continental’ effect and cause an accompanying wide scattering in d-excess values in precipitation. Supporting this explanation, Lagrangian moisture source modeling clearly indicated the dominant contribution of locally recycled continental moisture in the summer precipitation for Southeastern Europe [24].
A strikingly different pattern is discernible from September to April. Precipitationδ18O values remarkably decrease with increasing distance from the Adriatic coast over the first part of the studied profile, with a break in this trend at ~400 km (Figure4a). Theδ18O values beyond this point are not as depleted as would be expected from the linear trend fitted to the data of the first segment of the profile. The largest gradients were observed from November to March, while the estimated effect is smaller and usually not significant (p>0.1) in April and September (Figure4a). It is likely that the transition between the winter regime and the summer regime discussed above occurs during these months. An apparent nonlinearity of the ‘continental’ effect in the winter season was also reported along the distillation route of Atlantic moisture, with a gradient larger by a factor of two from the Irish coast to Central Europe compared to the rest of the transect to the foothills of the Ural Mountains. [10].
The decreased gradient was explained by additional moisture supply (e.g., Black Sea, Caspian Sea) substantially contributing to the water balance over Eastern Europe.
Water 2020, 12, x FOR PEER REVIEW 9 of 13
Figure 4. Stable isotope characteristics of monthly precipitation from the Adriatic coast to the northeastern corner of the Great Hungarian Plain: δ18O (a) and deuterium excess (d-excess) (b) vs.
distance from the Adriatic coast. Best fit lines (blue) for precipitation δ18O data and distance are plotted over the first half of the continental transect. The significance of the linear fit is coded as α- values of 0.01, 0.05 or 0.1 that are marked with (***), (**) or (*), respectively.
Figure 4. Stable isotope characteristics of monthly precipitation from the Adriatic coast to the northeastern corner of the Great Hungarian Plain:δ18O (a) and deuterium excess (d-excess) (b) vs.
distance from the Adriatic coast. Best fit lines (blue) for precipitationδ18O data and distance are plotted over the first half of the continental transect. The significance of the linear fit is coded asα-values of 0.01, 0.05 or 0.1 that are marked with (***), (**) or (*), respectively.
Water2020,12, 1797 9 of 13
Monthly d-excess patterns along the continetal transect across the Adriatic–Pannonian region also suggest additional moisture supply for the winter precipitation over the most inland section of the transect. Usually a shift can be observed in the d-excess values at the place where the break appears in the decrease of theδ18O values (Figure4b). Deuterium-excess values are grouped around a relatively higher mean for the first part of the transect accompanying the prevailingδ18O gradient, while the d-excess values of the stations drop and usually group around a lower mean beyond this break.
Characteristic examples are November 2016, December 2017 and February 2018, when precipitation d-excess values along the first part of the profile are typically at least 3%higher compared to the last part of the profile (Figure4b). The average October-to-March d-excess value of the stations with a distance<350 km to the Adriatic coast is 1.2%, higher compared to the average for those stations situated further than 450 km from the sea.
This isotopic pattern agrees with the results of Lagrangian moisture source modeling for the winter (wet) season in pointing out the Western and Central Mediterranean as the dominant moisture source regions in Southeast Europe [24], while the northern sector of the study area is connected to the Northern Alps where the North Atlantic was found to be the primary marine moisture source [23].
Water vapor originating from the Western and Central Mediterranean has characteristically higher d-excess values [30] compared to the water vapor of the Atlantic atmospheric marine boundary layer [31]. Therefore, it is likely that the lower d-excess values in the northern part of the study area confirm the influence of the Atlantic moisture supply. Indeed, studies on the stable isotope composition of precipitation in Hungary (representing the inland sector of the studied continental transect; see Figure1) found characteristically higher d-excess values in the case of precipitation arriving from the Mediterranean compared to precipitation arriving from the Atlantic directions [27,28]. The break in the inland-trend of precipitationδ18O values and the accompanying sharp shift in the d-excess values probably indicate a sudden switch from the Mediterranean dominated regime to the Atlantic influence, while the gradual change in d-excess values (e.g., January 2016, February 2017) suggests gradual mixing of moisture delivered from both sources (Figure4). Occasional contribution from additional moisture sources (e.g., from eastern and northern directions) between October and March can further complicate the isotope hydrometeorological situation in the NE sector of the Great Hungarian Plain [27,28].
Taking all of these results into consideration, a classical isotopic ‘continental’ effect can be considered only up to ~400 km inland from the Adriatic coast, and the mean gradients estimated from the monthlyδ18O andδ2H data are−2.4 and−20 %/100 km, respectively. Comparing these results to former studies, we can conclude that this regional gradient is substantially larger than that estimated for Western Europe (−0.38%/100 km) from the Irish coast to Central Europe forδ18O [10] and the
−3.3%/100 km estimated forδ2H [20]. This observation of a much steeper gradient along the Adriatic moisture source pathway can be explained by the stronger temperature gradient between the Adriatic coast and the center of the Pannonian Basin (i.e., mild Mediterranean winter vs. cold continental winter) compared to the temperature gradient prevailing over Western Europe in the winter season.
The stronger temperature gradient likely forces a higher degree of condensation and a higher degree of fractionation over the same distance.
5. Conclusions
Assessing the stable isotope composition of monthly precipitation fallen between January 2016 and December 2018 for selected stations situated along an elevation transect and a continental transect provided empirical estimates for the isotopic ‘altitude’ and ‘continental’ effects in modern precipitation across the Adriatic–Pannonian region.
Isotopic characteristics suggest that the main driver of the apparent vertical depletion of heavy stable isotopes in precipitation differs in warmer (raindrop evaporation) and colder (condensation) seasons, although there is no significant difference in the resulting ‘altitude’ effect. Therefore, an
‘altitude’ effect of−1.2%/km forδ18O and−7.9%/km forδ2H can be recommended to be used for modern precipitation in the Adriatic–Pannonian region.
The monthly patterns in precipitationδ18O values along a ~750 km long transect stretching from the Adriatic coast to the norteastern corner of the Great Hungarian Plain did not indicate any significant trend in precipitationδ18O data from May to August. This can be explained by the overwhelming influence of terrestrial recycled moisture by evapotranspiration. The recycled moisture negates the effect of the classical Rayleigh distillation process, erasing the expected decreasing trend from the precipitation stable isotope data moving inland from the Adriatic coast. A significant ‘continental’ effect emerged in the stable isotope composition of winter precipitation along the same transect. However, isotopic characteristics argue for the prevailing influence of the Mediterranean moisture source in winter precipitation only up to ~400 km distance inland from the Adriatic coast. The classical concept of the ‘continental’ effect is applicable practically from the Adriatic coast to the Danube, and the estimated mean isotopic ‘continental’ effect for the winter precipitation is−2.4%/100 km inδ18O and
−20%/100 km inδ2H. A break in the spatial trend of isotopic characteristics in winter precipitation at
~400 km probably reflects the mixture of moisture sources that travel along different distillation routes and delivering moisture with different isotopic composition. A sharp drop in the d-excess (>3%) corresponding in space with the break in precipitationδ18O trend likely indicates a sudden switch from the Mediterranean moisture domain to additional (mainly Atlantic) influence, while a gradual change in the d-excess values might suggest a gradual increase of the non-Mediterranean moisture contribution along the transect.
The regionally determined isotopic ‘altitude’ and ‘continental’ effects of modern precipitation can be recommended for use in future isotope hydrological or paleoclimatological applications in the Adriatic–Pannonian region.
Supplementary Materials:The following are available online athttp://www.mdpi.com/2073-4441/12/6/1797/s1, Figure S1: Crossplot of theδ18O vs.δ2H values used in the present study, Table S1: Stable isotopic data used in the study.
Author Contributions:Conceptualization, Z.K.; methodology, Z.K. and I.G.H.; formal analysis, I.G.H. and Z.K.;
resources, G.C., L.P., P.V. and T.K.; data curation, P.V. and D.E.; writing—original draft preparation, Z.K. and I.G.H.; writing—review and editing, P.V., I.F. and G.C.; visualization, I.G.H., D.E. and Z.K.; project administration, Z.K. and P.V.; funding acquisition, Z.K., P.V. and L.P. All authors have read and agreed to the published version of the manuscript.
Funding:This work was supported by the National Research, Development and Innovation Office under Grants SNN118205 and PD121387 and by the Slovenian Research Agency ARRS under Grants N1-0054, J4-8216 and P1-0143. The research was partly supported by the European Union and the State of Hungary, co-financed by the European Regional Development Fund in the project of GINOP-2.3.2-15-2016-00009 ‘ICER’.
Acknowledgments:The authors express their gratitude to the staffof the Slovenian Environment Agency at the meteorological stations and I. Kanduˇc for their valuable help in sampling and to S. Žigon for assistance with laboratory work. The results of this study have been discussed within the COST Action: “WATSON” CA19120.
The authors applied the FLAE approach for the sequence of authors. Seehttps://doi.org/10.1371/journal.pbio.
0050018for further details. This is contribution No. 73 of the 2ka Paleoclimatology Research Group.
Conflicts of Interest:The authors declare no conflict of interest.
References
1. Peixóto, J.P.; Oort, A.H. The Atmospheric Branch of the Hydrological Cycle and Climate. InVariations in the Global Water Budget; Street-Perrott, A., Beran, M., Ratcliffe, R., Eds.; Springer: Dordrecht, The Netherlands, 1983; pp. 5–65.
2. Fórizs, I. Isotopes As Natural Tracers In The Water Cycle: Examples From The Carpathian Basin.Stud. Phys.
2003,1, 69–77.
3. Yoshimura, K. Stable Water Isotopes in Climatology, Meteorology, and Hydrology: A Review.J. Meteorol.
Soc. Jan. Ser. II2015,93, 513–533. [CrossRef]
4. Gat, J.R.; Mook, W.G.; Meijer, H.A.Environmental Isotopes in the Hydrological Cycle; International Atomic Energy Agency: Paris, France, 2001; Volume 2, p. 73.
5. Coplen, T.B. Reporting of stable hydrogen, carbon and oxygen isotopic abundances.Pure App. Chem.1994, 66, 273–276. [CrossRef]
Water2020,12, 1797 11 of 13
6. Dansgaard, W. Stable isotopes in precipitation.Tellus1964,16, 436–468. [CrossRef]
7. Ambach, W.; Dansgaard, W.; Eisner, H.; Møller, J. The altitude effect on the isotopic composition of precipitation and glacier ice in the Alps.Tellus1968,20, 595–600. [CrossRef]
8. Gonfiantini, R.; Roche, M.-A.; Olivry, J.-C.; Fontes, J.-C.; Zuppi, G.M. The altitude effect on the isotopic composition of tropical rains.Chem. Geol.2001,181, 147–167. [CrossRef]
9. Poage, M.A.; Chamberlain, C.P. Empirical Relationships Between Elevation and the Stable Isotope Composition of Precipitation and Surface Waters: Considerations for Studies of Paleoelevation Change.
Am. J. Sci.2001,301, 1–15. [CrossRef]
10. Rozanski, K.; Araguás-Araguás, L.; Gonfiantini, R. Isotopic patterns in modern global precipitation. InClimate Change in Continental Isotopic Records; American Geophysical Union: Washington, DC, USA, 1993; pp. 1–36.
11. Clark, I.D.; Fritz, P.Environmental Isotopes in Hydrogeology; CRC Press Taylor & Francis Group: Boca Raton, FL, USA; London, UK; New York, NY, USA, 1997; p. 342.
12. Sappa, G.; Vitale, S.; Ferranti, F. Identifying Karst Aquifer Recharge Areas using Environmental Isotopes:
A Case Study in Central Italy.Geosciences2018,8, 351. [CrossRef]
13. Jasechko, S.; Lechler, A.; Pausata, F.S.R.; Fawcett, P.J.; Gleeson, T.; Cendón, D.I.; Galewsky, J.; LeGrande, A.N.;
Risi, C.; Sharp, Z.D.; et al. Late-glacial to late-Holocene shifts in global precipitationδ18O.Clim. Past2015, 11, 1375–1393. [CrossRef]
14. Blisniuk, P.M.; Stern, L.A. Stable isotope paleoaltimetry: A critical review.Am. J. Sci.2005,305, 1033–1074.
[CrossRef]
15. Kelly, S.; Heaton, K.; Hoogewerff, J. Tracing the geographical origin of food: The application of multi-element and multi-isotope analysis.Trends Food Sci. Technol.2005,16, 555–567. [CrossRef]
16. Niewodniza ´nski, J.; Grabczak, J.; Bara ´nski, L.; Rzepka, J. The Altitude Effect on the Isotopic Composition of Snow in High Mountains.J. Glaciol.1981,27, 99–111. [CrossRef]
17. Kern, Z.; Kohán, B.; Leuenberger, M. Precipitation isoscape of high reliefs: Interpolation scheme designed and tested for monthly resolved precipitation oxygen isotope records of an Alpine domain.Atmos. Chem.
Phys.2014,14, 1897–1907. [CrossRef]
18. Kong, Y.; Pang, Z. A positive altitude gradient of isotopes in the precipitation over the Tianshan Mountains:
Effects of moisture recycling and sub-cloud evaporation.J. Hydrol.2016,542, 222–230. [CrossRef]
19. Jiao, Y.; Liu, C.; Liu, Z.; Ding, Y.; Xu, Q. Impacts of moisture sources on the temporal and spatial heterogeneity of monsoon precipitation isotopic altitude effects.J. Hydrol.2020,583, 124576. [CrossRef]
20. Rozanski, K.; Sonntag, C.; Münnich, K.O. Factors controlling stable isotope composition of European precipitation.Tellus1982,34, 142–150. [CrossRef]
21. Winnick, M.J.; Chamberlain, C.P.; Caves, J.K.; Welker, J.M. Quantifying the isotopic ‘continental effect’.Earth Planet. Sci. Lett.2014,406, 123–133. [CrossRef]
22. Torkar, A.; Brenˇciˇc, M.; Vreˇca, P. Chemical and isotopic characteristics of groundwater-dominated Radovna River (NW Slovenia).Environ. Earth Sci.2016,75, 1296. [CrossRef]
23. Sodemann, H.; Zubler, E. Seasonal and inter-annual variability of the moisture sources for Alpine precipitation during 1995–2002.Int. J. Climatol.2010,30, 947–961. [CrossRef]
24. Gómez-Hernández, M.; Drumond, A.; Gimeno, L.; Garcia-Herrera, R. Variability of moisture sources in the Mediterranean region during the period 1980–2000.Water Resour. Res.2013,49, 6781–6794. [CrossRef]
25. Ciric, D.; Nieto, R.; Losada, L.; Drumond, A.; Gimeno, L. The Mediterranean Moisture Contribution to Climatological and Extreme Monthly Continental Precipitation.Water2018,10, 519. [CrossRef]
26. Stojanovic, M.; Drumond, A.; Nieto, R.; Gimeno, L. Variations in Moisture Supply from the Mediterranean Sea during Meteorological Drought Episodes over Central Europe.Atmosphere2018,9, 278. [CrossRef]
27. Bottyán, E.; Czuppon, G.; Weidinger, T.; Haszpra, L.; Kármán, K. Moisture source diagnostics and isotope characteristics for precipitation in east Hungary: Implications for their relationship.Hydrol. Sci. J.2017,62, 2049–2060. [CrossRef]
28. Czuppon, G.; Bottyán, E.; Krisztina, K.; Weidinger, T.; Haszpra, L. Significance of the air moisture source on the stable isotope composition of the precipitation in Hungary. In Proceedings of the Conference The EGU General Assembly 2017, Vienna, Austria, 23–28 April 2017; p. 13458.
29. LeGrande, A.N.; Schmidt, G.A. Global gridded data set of the oxygen isotopic composition in seawater.
Geophys. Res. Lett.2006,33, L12604. [CrossRef]
30. Gat, J.R.; Klein, B.; Kushnir, Y.; Roether, W.; Wernli, H.; Yam, R.; Shemesh, A. Isotope composition of air moisture over the Mediterranean Sea: An index of the air-sea interaction pattern. Tellus B: Chem. Phys.
Meteorol.2003,55, 953–965. [CrossRef]
31. Benetti, M.; Steen-Larsen, H.C.; Reverdin, G.; Sveinbjörnsdóttir,Á.E.; Aloisi, G.; Berkelhammer, M.B.;
Bourlès, B.; Bourras, D.; de Coetlogon, G.; Cosgrove, A.; et al. Stable isotopes in the atmospheric marine boundary layer water vapour over the Atlantic Ocean, 2012–2015.Sci. Data2017,4, 160128. [CrossRef]
32. Umweltbundesamt, H.O.F. Bundesministerium für Land-und Forstwirtschaft, U.u.W.B., Ed. 2019. Available online:https://wasser.umweltbundesamt.at/h2odb/(accessed on 1 October 2019).
33. Vreˇca, P.; Malenšek, N. Slovenian Network of Isotopes in Precipitation (SLONIP)—A review of activities in the period 1981–2015.Geologija2016,59, 67–84. [CrossRef]
34. SLONIP. Slovenian Network of Isotopes in Precipitation. The SLONIP Database. Available online:
https://slonip.ijs.si/(accessed on 1 May 2020).
35. Czuppon, G.; Breuer, H.; Bottyán, E.; Kern, Z.; Simon, G.; Mona, T.; Göndöcs, J.Role of Meteorological Processes and Isotope Effects on the Stable Isotope Composition of Precipitation Originated from the Mediterranean Region; Book of Abstracts, National Research and Development Institute for Cryogenics and Isotopic Technologies- ICSI Rm: Válcea, Romania, 2017; p. 64.
36. Vodila, G.; Palcsu, L.; Futó, I.; Szántó, Z. A 9-year record of stable isotope ratios of precipitation in Eastern Hungary: Implications on isotope hydrology and regional palaeoclimatology.J. Hydrol.2011,400, 144–153.
[CrossRef]
37. Markovi´c, T.; Karlovi´c, I.; Perˇcec Tadi´c, M.; Larva, O. Application of Stable Water Isotopes to Improve Conceptual Model of Alluvial Aquifer in the Varaždin Area.Water2020,12, 379. [CrossRef]
38. IAEA.IAEA/GNIP precipitation sampling guide V2; International Atomic Energy Agency: Vienna, Austria, 2 September 2014; p. 19. Available online: http://www-naweb.iaea.org/napc/ih/documents/other/gnip_
manual_v2.02_en_hq.pdf(accessed on 15 May 2020).
39. Mann, H.B.; Whitney, D.R. On a Test of Whether one of Two Random Variables is Stochastically Larger than the Other.Ann. Math. Statist.1947,18, 50–60. [CrossRef]
40. Merlivat, L.; Jouzel, J. Global climatic interpretation of the deuterium-oxygen 18 relationship for precipitation.
J. Geophys. Res. Oceans1979,84, 5029–5033. [CrossRef]
41. Bershaw, J. Controls on Deuterium Excess across Asia.Geosciences2018,8, 257. [CrossRef]
42. Craig, H. Isotopic Variations in Meteoric Waters.Science1961,133, 1702–1703. [CrossRef] [PubMed]
43. Gat, J.Isotope Hydrology: A Study of the Water Cycle; Imperial College Press: London, UK, 2010.
44. Stewart, M.K. Stable isotope fractionation due to evaporation and isotopic exchange of falling waterdrops:
Applications to atmospheric processes and evaporation of lakes. J. Geophys. Res. 1975,80, 1133–1146.
[CrossRef]
45. Moser, H.; Stichler, W. Die Verwendung des Deuterium- und Sauerstoff-18-Gehalts bei hydrologischen Untersuchungen, in English: Application of deuterium and oxygen-18 content measurements in hydrological investigations.Geol. Bavarica1971,64, 7–35.
46. Krajcar Broni´c, I.; Horvatinˇci´c, N.; Obeli´c, B. Two decades of environmental isotope records in Croatia:
Reconstruction of the past and prediction of future levels.Radiocarbon1998,40, 399–416. [CrossRef]
47. Vreˇca, P.; Broni´c, I.K.; Horvatinˇci´c, N.; Bareši´c, J. Isotopic characteristics of precipitation in Slovenia and Croatia: Comparison of continental and maritime stations.J. Hydrol.2006,330, 457–469. [CrossRef]
48. Malík, P.; Michalko, J. Oxygen Isotopes in Different Recession Subregimes of Karst Springs in the Brezovské Karpaty Mts. (Slovakia).Acta Carsologica2010,39. [CrossRef]
49. Holko, L.; Dóša, M.; Michalko, J.; Šanda, M. Isotopes of oxygen-18 and deuterium in precipitation in Slovakia.
J. Hydrol. Hydromech.2012,60, 265–276. [CrossRef]
50. Fórizs, I.; Makfalvi, Z.; Deák, J.; Kármán, K.; Vallasek, I.; Süveges, M. Izotópgeokémiai vizsgálatok a Csíki-medenceásványvizeiben/Isotope geochemical investigations of the mineral waters in the Ciuc Basin.
Miskolc. Egy. Közl. Sor. Bány.2011,81, 59–67.
51. Salati, E.; Dall’Olio, A.; Matsui, E.; Gat, J.R. Recycling of water in the Amazon Basin: An isotopic study.
Water Resour. Res.1979,15, 1250–1258. [CrossRef]
Water2020,12, 1797 13 of 13
52. Gat, J.R.; Matsui, E. Atmospheric water balance in the Amazon basin: An isotopic evapotranspiration model.
J. Geophys. Res. Atmos.1991,96, 13179–13188. [CrossRef]
53. Wang, X.-F.; Yakir, D. Temporal and spatial variations in the oxygen-18 content of leaf water in different plant species.Plant Cell Environ.1995,18, 1377–1385. [CrossRef]
©2020 by the authors. Licensee MDPI, Basel, Switzerland. This article is an open access article distributed under the terms and conditions of the Creative Commons Attribution (CC BY) license (http://creativecommons.org/licenses/by/4.0/).