Environment International 146 (2021) 106263
Available online 30 November 2020
0160-4120/© 2020 The Author(s). Published by Elsevier Ltd. This is an open access article under the CC BY-NC-ND license
(http://creativecommons.org/licenses/by-nc-nd/4.0/).
Geostatistical evaluation of the design of the precipitation stable isotope monitoring network for Slovenia and Hungary
Istv ´ an G ´ abor Hatvani
a,*, G ´ abor Szatm ´ ari
b,c, Zolt an Kern ´
a, D ´ aniel Erd ´ elyi
d,e, Polona Vre ˇ ca
f, Tja ˇ sa Kandu ˇ c
f, Gy orgy Czuppon ¨
a,g,h, Sonja Lojen
f, Bal ´ azs Koh ´ an
iaInstitute for Geological and Geochemical Research, Research Centre for Astronomy and Earth Sciences, Buda¨orsi út 45, H-1112 Budapest, Hungary
bInstitute for Soil Sciences and Agricultural Chemistry, Centre for Agricultural Research, Herman Ott´o út 15, H-1022 Budapest, Hungary
cDepartment of Soil Science and Environmental Informatics, Georgikon Faculty, Szent Istv´an University, H-8360 Keszthely, Hungary
dCentre for Environmental Science, E¨otv¨os Lorand University, P´ ´azm´any P´eter stny. 1/a, H-1117 Budapest, Hungary
eDepartment of Geology, E¨otv¨os Lor´and University, P´azm´any P´eter stny. 1/c, H-1117 Budapest, Hungary
fDepartment of Environmental Sciences, Joˇzef Stefan Institute, Jamova cesta 39, 1000 Ljubljana, Slovenia
gIsotope Climatology and Environmental Research Centre (ICER), Institute for Nuclear Research, Bem t´er 18/c, Debrecen, Hungary
hDepartment of Hydrogeology and Engineering Geology, Institute of Environmental Management, University of Miskolc, Miskolc-Egyetemv´aros, H-3515, Hungary
iDeptartment of Environmental and Landscape Geography, E¨otv¨os University, P´azm´any P. stny 1/C, H-1117 Budapest, Hungary
A R T I C L E I N F O Handling Editor: Xavier Querol Keywords:
Precipitation Stable oxygen isotopes Spatial simulated annealing Kriging variance Network design Hungary Slovenia
A B S T R A C T
A detailed knowledge of the stable isotope signature of precipitation is the basis of investigations in a variety of scientific fields and applications. To obtain robust and reliable results, the representativity of the currently operating (at least, as of 2018) precipitation stable isotope monitoring stations across Slovenia (n =8) and Hungary (n =9) was evaluated on the basis of amount-weighted annual averages with the aim of revealing any redundantly (i.e. over-) represented or un(der)represented areas. In the case of the latter, optimal locations for additional sites were suggested in Slovenia and Hungary. The networks of both countries are design-based systems that need to be fine-tuned for long-term optimized operation. The evaluation of the monitoring network was performed taking into consideration the stations operating in Slovenia and Hungary, as well as closely situated ones operating in neighboring countries. The evaluation was carried out in nine different combinations, using spatial simulated annealing, with regression kriging variance as a quality measure. The results showed that (i) there are over- and un(der)represented areas in the network, an issue requiring remedial action, (ii) the mutual information exchange of the precipitation stable isotope monitoring networks of Slovenia and Hungary increases the precision of precipitation δ18O estimation by ~0.3‰ in a 15–30 km wide zone near the borders, and (iii) by an even greater degree in the neighboring countries’ stations. The current research may be termed pioneering in the matter of the detailed geostatistical assessment of spatial representativity of a precipitation stable isotope monitoring network, and as such, can serve as an example for future studies aiming for the spatial optimization of other regional precipitation stable isotope monitoring networks.
1. Introduction
The hydrochemical and isotopic composition of precipitation is a powerful tool, and an invaluable source of information for hydrological, hydro-meteorological and climatological research (Bowen et al. 2019;
Zhai et al. 2013). The most basic isotopic hydrological parameters are the ratios of the heavy to the light stable isotopes of hydrogen and ox- ygen (2H/1H; 18O/16O) in water molecules (Craig 1961; Riesenfeld and
Chang 1936). Stable isotope ratios in precipitation are primarily deter- mined by kinetic and equilibrium isotopic fractionation associated with the processes of evaporation and condensation and atmospheric trans- port, as parts of the global water cycle (Dansgaard 1964; Eriksson 1965).
For several decades, precipitation stable water isotopes have been used as important natural tracers (Craig 1961; Dansgaard 1964) in the study of the water cycle e.g. Forizs (2003); Yoshimura (2015), in the discipline ´ of hydrogeology e.g. (Clark and Fritz 1997), and more recently, in food
* Corresponding author at: Institute for Geological and Geochemical Research, Research Centre for Astronomy and Earth Sciences, Buda¨orsi út 45, H-1112 Budapest, Hungary.
E-mail addresses: hatvaniig@gmail.com (I.G. Hatvani), polona.vreca@ijs.si (P. Vreˇca), tjasa.kanduc@ijs.si (T. Kanduˇc), czuppon@geochem.hu (G. Czuppon), sonja.lojen@ijs.si (S. Lojen).
Contents lists available at ScienceDirect
Environment International
journal homepage: www.elsevier.com/locate/envint
https://doi.org/10.1016/j.envint.2020.106263
Received 21 April 2020; Received in revised form 1 September 2020; Accepted 2 November 2020
authentication (Kelly et al. 2005) or in wildlife forensics e.g. Bowen et al. (2005); Hobson (1999) on global, regional and local scales.
The spatial design of meteorological monitoring networks has been thoroughly studied, e.g. Mauger et al. (2013), but the focus has been primarily on the optimization of precipitation gauging networks devel- oped for recording precipitation amount (Kassim and Kottegoda 1991) (e.
g. Goovaerts (2000); Papamichail and Metaxa (1996); Pardo-Igúzquiza (1998)). A global isotope-hydrometeorological monitoring network (GNIP – Global Network of Isotopes in Precipitation) has been jointly operated by the International Atomic Energy Agency (IAEA) and the World Meteorological Organization (WMO) since 1961. It is a basic source of information on the present-day degree of temporal and spatial vari- ability of the isotopic composition of monthly precipitation on a global scale (Araguas-Araguas et al. 1996). The GNIP database is supplemented by information gathered through national meteorological services, na- tional authorities and scientific volunteers. In a few notable cases it is supplemented by the national monitoring networks of precipitation water stable isotopes, e.g. in Switzerland (Schürch et al. 2003), Spain (Díaz- Teijeiro et al. 2009), USA (Welker 2012), Germany (Stumpp et al. 2014), China (Liu et al. 2014) and Austria (Hager and Foelsche 2015).
In every case, the spatial representativity of the given environmental monitoring network has to be examined for redundancy or a lack of necessary coverage. These aspects are important from both a theoretical and practical – that is, cost optimization – point of view, since redun- dancy implies excess expenditure in the case of any given environmental monitoring network, e.g. (Nunes et al. 2004). Such an audit has not yet been completed, neither for the GNIP, nor for any of the national pre- cipitation stable isotope monitoring networks mentioned above. In one special regional case, the GNIP records from the Iberian Peninsula combined with data from regional studies were jointly used to provide an overview of the representativity of the precipitation stable isotope monitoring stations (Hatvani et al. 2020).
The assessment of to what extent a monitoring network provides spatial coverage of an area can be considered as an optimization prob- lem. One of the most traditional approaches to monitoring optimization for spatial classification is the application of geostatistical tools (Hatvani and Horv´ath, 2015) by means of an analysis of e.g. kriging/simulation variances (Kanevski et al. 2009; Szatm´ari et al., 2015; Szatm´ari et al.
2019). A commonly applied quality measure of the quantification of the geographical coverage of a monitoring network with regard to a pre- specified domain is the kriging variance (KV); see Section 3.4 and Baume et al. (2011); Melles et al. (2011) for details. The computation of the KV is part of the kriging interpolation procedure, which has several advantages in terms of network optimization. First of all, it is an un- conditional variance (Chil`es and Delfiner 2012), meaning that it does not depend on the data values. Thus, it can be computed before the actual sampling takes place, which makes it cost-effective. However, this independence has to be taken into consideration if one wishes to use the KV for uncertainty assessment (Szatm´ari and P´asztor 2019). A further advantage of the application of kriging variance to the evaluation of the representativity of a monitoring network is that it is able to make a numerical comparison and rank the alternative geometric data config- urations (Journel and Rossi 1989). As an objective statistical measure of representativity, the KV may be considered as a bottom-up criterion (see Parr et al. (2002)) for selecting the most important sites in the envi- ronmental monitoring network being examined.
The two main approaches in selecting the location of environmental monitoring stations are (i) model-based and (ii) design-based. In the case of the former, the information provided by the monitoring network depends on the validity of the model adopted. These model-based net- works are much more flexible than design-based ones, but are necessarily pre-determined by the underlying assumptions from which they are derived. Meanwhile, the operation of design-based networks is less flexible, as well as being costly, but because these rely on a smaller number of assumptions, they provide more robust information than the model-based ones (Parr et al. 2002). The precipitation stable isotope
monitoring networks of Slovenia and Hungary (the subjects of the study) represent a design-based system that should be fine-tuned for long-term optimized operation. In the course of the optimization procedure, an objective a model-based approach will be considered by taking into ac- count additional key factors that provide added value in design-based planning. The most important of these key factors that should be considered in a post-hoc stratification of an investigated environmental monitoring network are:
● the conservation of long-term integrated environmental monitoring at designated permanent sites (Beard et al. 1999; Bruns et al. 1991;
Pryor et al. 1998; UNESCO 1993). These sites allow (i) the reliable estimation of baseline values for significant environmental variables and indicators (Bruns et al. 1991) (ii) the development of generic models of predictive value as a basis for environmental management and the use of natural resources (Parr et al. 2002);
● the conservation of the monitoring sites that provide an under- standing of environmental conditions prevailing in locations of specific importance (Innes, 1988), which criterion is expressed based on professional experience as a top-down decision (Parr et al. 2002);
● the inclusion of monitoring sites from a neighboring network/region, since these can reduce the need to set up new sites (Parr et al. 2002).
1.1. Development of the national monitoring network for stable isotopes in precipitation across Slovenia and Hungary
Systematic measurements of the isotopic composition (i.e. δ2H and δ18O) of precipitation were commenced in Slovenia in 1972 at three stations (Gospodariˇc and Habiˇc 1976). In Hungary, sporadic measure- ments began in the early 1970s (D´enes and De´ak 1981) and the first regular monthly measurements of precipitation stable isotopes were conducted between 1977 and 1984 at a single station (De´ak 2006). The station in Hungary with the longest record of operation is located in Debrecen, and has been gathering data since 2001 (Vodila et al. 2011).
In Slovenia, the longest continuously operating monitoring stations are the Ljubljana Reaktor and Portoroˇz stations, working since since 2000 (Vreˇca et al. 2015); the former having been relocated twice between 1981 and 2000 in the Ljubljana area (Vreˇca et al. 2008). The number of monitoring stations has shown an increase in Hungary in 2012 – after the setting up of a country-wide network (Czuppon et al., 2017a) – and increased in 2009 in Slovenia (Vreˇca and Malenˇsek 2016). Stable iso- topes have been monitored at more than 30 different locations in Slovenia, although only few stations have been in operation simulta- neously for more than three years (Vreˇca et al. 2018; Vreˇca and Mal- enˇsek 2016). A kind of proliferation has also been observable in Hungary, since beside the continuously-operating monitoring stations, ad hoc stations (Czuppon et al. 2018) and small-scale industrial net- works (F´orizs et al., 2020; Sz´ant´o et al., 2007) have also been launched at various times. This growth in the number of precipitation isotope monitoring stations gave rise to the idea of an investigation into the possibility of optimizing the current network and finding any locations where new monitoring stations could operate in the most useful way.
1.2. Aims of the study
The aim of the present study is to establish a sound scientific basis for the optimal spatial organization of the national networks for water isotope monitoring in precipitation in Slovenia and Hungary. Specif- ically, the goal is to evaluate the representativity of the currently operating networks across Slovenia and Hungary to reveal areas either with redundant coverage or which are un(der)represented. In the case of the latter, the optimal locations for possible further sites are suggested.
The precipitation stable isotope monitoring stations are assessed in various combinations. The following questions are addressed: (i) for which country the existing precipitation stable isotope networks are
sufficient, (ii) which sites are less crucial to the effectiveness of moni- toring, and (iii) to what extent information is available from the neighboring countries, and to what degree this is beneficial.
2. Climate of the area
Most of the studied region (Fig. 1) is characterized by a warm temperate/continental climate with warm summers and without a dry season (Koppen-Geiger code: Cfb). Humid warm temperate areas with ¨ hot summers (K¨oppen-Geiger code: Cfa) can be found along the Adriatic Coast and the southern border of Hungary; while a boreal climate with cool summers and cold winters (K¨oppen-Geiger code: Dfc) prevails in the northwestern mountainous part of Slovenia (Kottek et al., 2006).
Determined by the geographical position of the studied region, westerly winds prevail at higher altitudes, which can be deflected by orography near the ground surface (Bertalaniˇc 2020; Bihari et al., 2018).
Specifically, the winds in Slovenia are mostly westerly (Bertalaniˇc 2020), in Hungary, the dominant wind direction is north-westerly (relative abundance 10–15%), and in the areas with highly variable relief conditions determining surface wind directions can vary from NW to S. The average annual wind speed at 10 m above the surface is be- tween 2.5 and 3 m s−1 in Hungary (2000 to 2009), with higher speeds recoded on the Great Hungarian Plain and the Transdanubian Moun- tains (Bihari et al., 2018). The annual average wind speed, in the period from 1996 to 2005, in the lowlands of Slovenia rarely exceeds 2.0 m s−1, while higher (up to 5.1 m s−1) values characterize the hills and moun- tains (Bertalaniˇc 2020). The highest wind speeds both in Slovenia and Hungary can be attributed to southerly winds caused by cyclones from the Mediterranean (Bertalaniˇc 2020; Bihari et al., 2018).
In the studied area, the Western- and Central Mediterranean are the dominant marine moisture source regions throughout the year, although in summer locally recycled continental moisture is the primary source of atmospheric moisture (Czuppon et al., 2017a; G´omez-Hern´andez et al.,
2013). The dominance of the Mediterranean moisture decreases beyond
~400 km from the Adriatic Coast (Kern et al. 2020a), and in the northern part of the study region the westerlies transport Atlantic ma- rine moisture mixed with recycled terrestrial moisture from western and west Central Europe (Botty´an et al., 2017; Czuppon et al., 2017a).
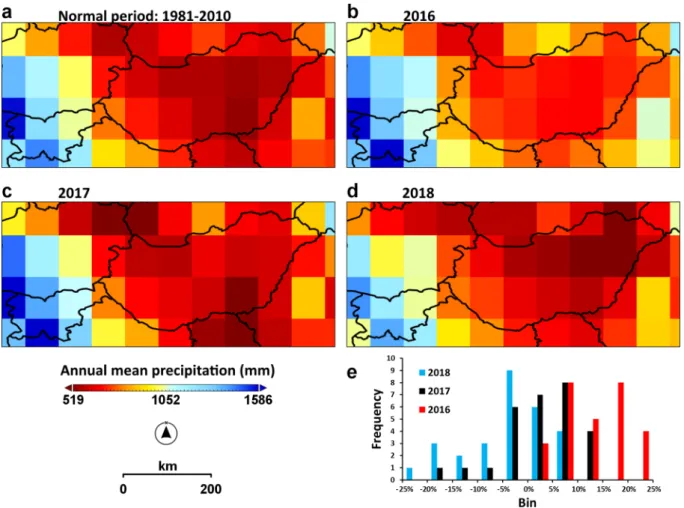
A pronounced precipitation gradient characterizes the study area which, as in the case of the wind climate, is also determined by the geographical conditions. The mean annual sum precipitation decreases from north-west Slovenia (>1500 mm) eastwards dropping to ~540 mm in Eastern Hungary, largely mirroring the orography and continentality of the region (Fig. 2). The primary sources of moisture are the humid air masses arriving from the Mediterranean perpendicular to the orographic barrier, thus, as the moist air mass is forced to rise, the consequent cooling and condensation cause heavy precipitation events (De Luis et al. 2014).
3. Materials and methods
Cooperation between Slovenia and Hungary in the matter of their networks of precipitation stable isotope monitoring was established by 2016. Annual datasets of complete measurements are available from the majority of active stations in both countries from 2016, 2017 and 2018 (Fig. 1). There have been minor changes in the set of stations over the years. In the beginning, in 2016, a less complete network was operating, with the north-eastern stations (Tornyosp´alca and Rakamaz, Hungary;
Fig. 1) not yet functioning. The complete set of stations began operation in 2017 and 2018. However, there is a notable difference between the quality of the data gathered from 2017 and 2018, although in both there were just two stations with a certain portion of fallen precipitation not represented in the stable isotope measurements. Specifically, in 2017 the percentage of actual precipitation not represented was notably higher (>8%), while in 2018 it was less than 4%, rendering the latter more representative in this aspect.
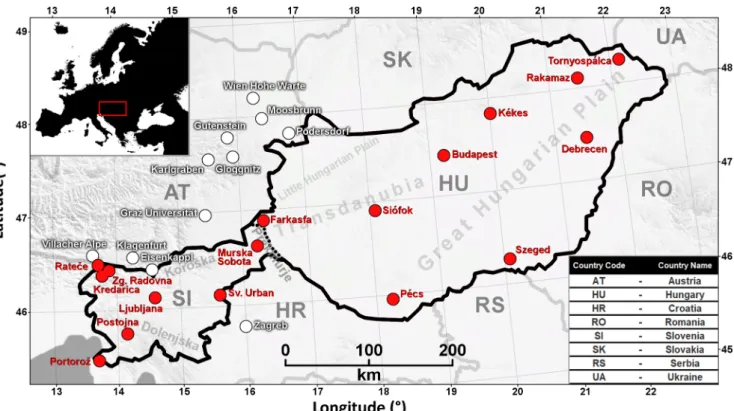
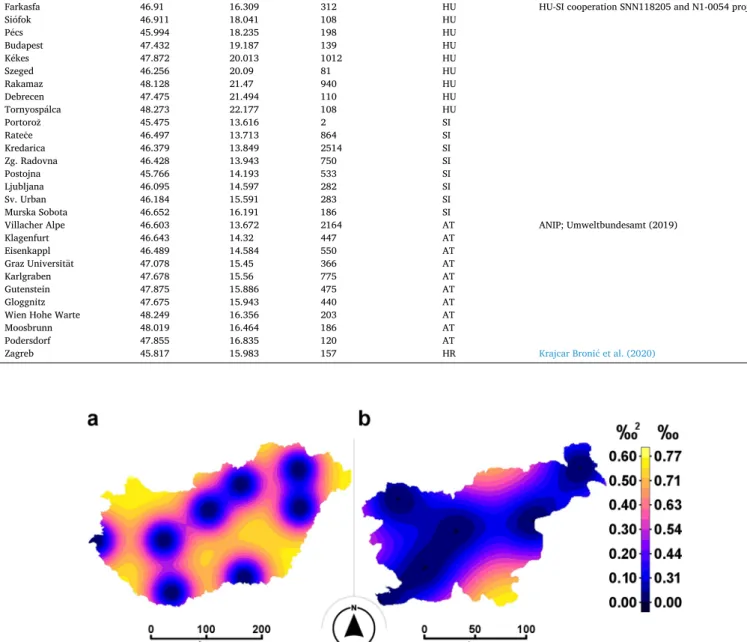
Fig. 1.Schematic map of the spatial distribution of the monitoring sites for precipitation stable isotopes in Slovenia (SI; n =8) and Hungary (HU; n =9) (outlined in black) (sites are indicated by red dots) operating in 2018, and in the neighboring counties (Austria: AT (n =10), Croatia: HR (n =1)) available in open databases (white dots). The inset map shows Europe with the region indicated by a red rectangle. The base map was taken from SRTM Worldwide Elevation Data (3-arc-second Resolution); accessed on 07.03.2020. The country codes on the map and in the inset table follow the ISO-3166–1 ALPHA-2 standard at every location mentioned. (For interpretation of the references to colour in this figure legend, the reader is referred to the web version of this article.)
With regard to the hydroclimate of the area, the year 2018 is most similar to the average conditions (Fig. 2a,b,e) if it and the years 2016 and 2017 are considered (Fig. 2c–e). In 2018, both the areal average of the annual sum precipitation (~760 mm) and its spatial distribution (Fig. 1d) best resembled the long-term normal precipitation (~785 mm) (Fig. 2a, e). The differences in the gridded annual precipitation totals of 2018 and the normal period (1981–2010) were clustered within the ±5% interval (Fig. 2e) in more than half (~55%) of the cells, with the largest differ- ences along the northern margin (Fig. 2a,d). In addition, in December 2016, there was no precipitation across large parts of the region, yet that year was much wetter than the normal period, as indicated by the positive bias in difference values (Fig. 2e). This suggests an unusual seasonal distribution of precipitation for 2016. In the meanwhile, 2017 was also wetter than the average conditions in Slovenia and Hungary (Fig. 2c,e).
Therefore, on the basis of the above – i.e. with most sites active in 2018, and the hydroclimate of this year resembling that of the normal period the most – the 17 stations operational in 2018 were used for the geostatistical evaluation of the precipitation stable isotope monitoring network design for Slovenia and Hungary considering additional sta- tions from the neighboring countries (Fig. 1; Table A1; see Section 3.1 for details).
3.1. Used δ18O and precipitation data and preprocessing
The ratio of heavy to light stable isotopes is traditionally expressed in delta (δ) notation as the relative deviation of the ratio of the sample from
that of the standard, expressed in per mil (‰) (Coplen 1994). Monthly precipitation hydrogen and oxygen stable isotope values (δp) were pro- vided for 2018 from 17 stations (Fig. 1; Table A1), eight of which were selected from the Slovenian Network of Isotopes in Precipitation (SLO- NIP) operated by the Joˇzef Stefan Institute (Vreˇca et al. 2017), and nine from Hungary (Czuppon et al., 2017b) curated by the Research Centre for Astronomy and Earth Sciences, with an additional station operated by the Institute for Nuclear Research (Vodila et al. 2011). There were only two stations with missing monthly δp values due to sampling failure in January at Sv. Urban (SI) and in December at Farkasfa (HU). In addition, to (i) improve the spatio-temporal density of the data set, and (ii) obtain a more realistic picture of how the focus area is presented in terms of precipitation δp, the available data for 2018 provided by the stable isotope monitoring stations within 150 km of Slovenia and Hungary (the focus area of the study) were also taken into account.
These complementary data included ten stations from the Austrian Network of Isotopes in Precipitation (ANIP) (Umweltbundesamt, 2019), and one station in Croatia (HR) (Krajcar Broni´c et al. 2020) (Fig. 1;
Table A1). A measure of local indicator of spatial association, specifcally a sequential univariate outlier detection procedure (Kern et al., 2020b) did not detect any possible outlier among the monthly δp data.
For the geostatistical modeling, precipitation amount weighted annual averages were calculated using monthly precipitation amounts from the GPCC’s Full Data Monthly Analysis V.2018 database (Schneider et al. 2018; Schneider et al. 2014).
For calculations, the geographical coordinates (latitude and Fig. 2. Spatial distribution of annual precipitation totals in Slovenia and Hungary and their surroundings. Annual mean sum for the normal period: 1981–2010 (a) and annual total precipitation for years 2016 (b), 2017 (c), 2018 (d) based on the GPCC’s Full Data Monthly Analysis V.2018 database (Schneider et al. 2018). Black lines represent national borders. The histograms calculated from the annual mean sum of the normal period subtracted from the annual total precipitation for 2016 (red), 2017 (black) and 2018 (blue) are expressed in percentages of the annual normal (1981–2010) precipitation of the corresponding grid cell (e). The calculation was performed for the 28 individual grid cells covering Slovenia and Hungary. (For interpretation of the references to colour in this figure legend, the reader is referred to the web version of this article.)
longitude) of the stations were converted from a geographic coordinate system (EPSG: 4326, WGS84; Table A1) to a metric coordinate system (EPSG:3857, WGS84 / Pseudo-Mercator projection), since exploratory variography (see Appendix) should be performed on a metric scale. It should be noted here that in the study the reported ranges are planar distances (dplanar) in km (EPSG: 3857), unless otherwise reported; the estimated average conversion in the region is given by dplanar ×0.678 ≈ dgeodetic.
3.2. Methodological approach
The first step after preprocessing the dataset was the removal of the governing effect of spatial trend with the use of multivariate regression on amount weighted annual mean δp values. This was necessary to obtain a semivariogram (see Appendix), which provides the weighting function for kriging. Regression kriging combines multivariate regression with the kriging of the regression residuals, and is used in the present study as the quality measure of spatial simulated annealing (SSA). It should be noted here that since the semivariograms for both precipitation hydrogen and oxygen stable isotope values were strikingly similar (Fig. 3b, c), except for their degree of variance, network optimization was performed only for the more frequently assessed variable, δ18O, and the results may be taken as relevant to both parameters (δ2H and δ18O).
3.3. Removal of geographical governing effects
Trend-like tendencies in amount weighted annual mean δp over large distances which are determined by geographical factors (e.g. ‘altitude’
and the ‘continental’ effects) are known to drive the isotopic composi- tion of precipitation globally (Rozanski et al. 1993) and regionally (Kern et al., 2020a). The complex physical mechanisms explaining these re- lationships can and should be explored; in the present study, however, their superimposed effect on precipitation stable isotope values at given locations should be removed, because these may mask the finer scale spatial autocorrelation patterns which the optimization of the moni- toring network relies on. Thus, as in other, similar studies (e.g. Hatvani
et al. (2020); Hatvani et al. (2017); Kern et al. (2014)) the effect linked to the geographical factors was minimized by computing best-fit mul- tiple regression models (δp vs. latitude, longitude, elevation and planar distance from the Adriatic) and determining their residuals in a stepwise procedure suggested by O’Brien (2007).
3.4. Spatial simulated annealing (SSA)
Spatial simulated annealing (SSA) was used to identify areas un(der) represented or with redundant coverage by the precipitation stable isotope monitoring network across Slovenia and Hungary for 2018. SSA is an iterative, combinatorial, model-based network optimization algo- rithm in which a sequence of network designs is generated by deriving a new design by slightly and randomly changing the previous design (van Groenigen et al. 1999). When a new design is generated, the quality measure is computed and compared with the quality measure value of the previous design. The Metropolis criterion (Metropolis et al. 1953) defines the probability that either accepts the new design as a basis for further computation or rejects it, in which case the previous design stays as a basis for further designs (van Groenigen et al. 1999). In this study, SSA and its inverse application were used for (i) optimally adding new sites to areas which are underrepresented by the existing monitoring networks, and for (ii) the optimal removal of those monitoring sites which have a lower information content according to the quality mea- sure (Heuvelink et al. 2012; Szatm´ari et al. 2019), respectively.
The appropriate selection of the quality measure is a crucial step, since the whole optimization process rests on it. In the course of network optimization, spatially averaged kriging variance was applied as a quality measure for quantifying the geographical coverage of the monitoring network, which is a widely accepted measure for the prob- lem in hand (e.g. Bog´ardi et al. 1985; van Groenigen 2000).
The kriging variance can be readily computed if the variogram is known, that is
σ2(x0) =2∑N
i=1λiγ(xi,x0) − ∑N
i=1
∑N
j=1λiλjγ( xi,xj
) (1)
where γ(xi,xj)is the semivariance between the data points xi and xj, γ(xi, Fig. 3.Spatial range union and semivariogram of the precipitation stable isotope monitoring network of Slovenia and Hungary for 2018. The monitoring sites of the Slovenian – Hungarian precipitation stable isotope network are indicated with red, and those of other countries with white dots (a). The empirical semivariograms for δ18O (b) and δ2H (c) are indicated by the black dots, and the red line represents the theoretical semivariogram. The dotted horizontal line indicates the average variance. The underlying properties of the Gaussian δ18O and δ2H theoretical semivariograms are the following – range: 154.1 and 140.3 km; C0 +C: 0.523 and 32.4;
C0: 0.001 and 2.05; fit: r2 =0.651 and 0.586, RSS =0.182 and 722, respectively. (For interpretation of the references to colour in this figure legend, the reader is referred to the web version of this article.)
x0)is the semivariance between the ith data point and the prediction point x0 and λ is the kriging weights that can also be computed if the variogram is known (Webster and Oliver 2008).
The advantage of kriging variance as the quality measure for SSA is that according to its definition, the kriging variance is independent of the data values, and that makes it an unconditional variance (Chil`es and Delfiner 2012). Furthermore, it is a variogram model dependent ranking of data configuration (Journel and Rossi 1989), and can, therefore, be highly useful in ranking and optimizing a monitoring network (Szatm´ari et al., 2015).
In the study, maps of regression kriging variance (RKV) are used for evaluating, comparing, ranking and optimizing the monitoring network (see e.g. Szatmari et al. 2019) via scenarios of different sets of moni-´ toring stations (Table 1). Regression kriging is equal to the procedure discussed above, and is conducted on the residuals of a multivariate regression – for details see Sections 3.3 and 4. These RKV maps provide information on the geographical coverage of different geometric data configurations and can therefore be used for selecting the configuration which provides the best spatial coverage for the domain of interest. If the possibility arises to add one or more sites to an existing monitoring
network, the location of the new sites is optimized by maximizing the decrease of the spatial mean of RKV, which yields a more even spatial coverage. In this study, a sequential optimization approach is conduct- ed, that is, the optimal placement of only one new site at a time is tar- geted, taking the configuration of the existing monitoring network and the location of the previously added new site (or sites) into account. The higher the RKV, the higher the uncertainty of the geostatistical estima- tion: thus, it can be considered the error of the estimation as well. These can be used for the visualization of the geographical coverage of a given geometric data configuration in order to identify and delimit areas which are either overrepresented or underrepresented by monitoring stations (Szatm´ari et al., 2015). These kriging maps can be interpreted with the assumption of normality and homoscedasticity as the un- certainties of the geostatistical modeling for δp data.
3.5. Scenarios with different sets of the precipitation stable isotope monitoring stations considered across Slovenia and Hungary
Using SSA, nine scenarios were investigated (Table 1) to provide a picture of how efficient the precipitation stable isotope monitoring
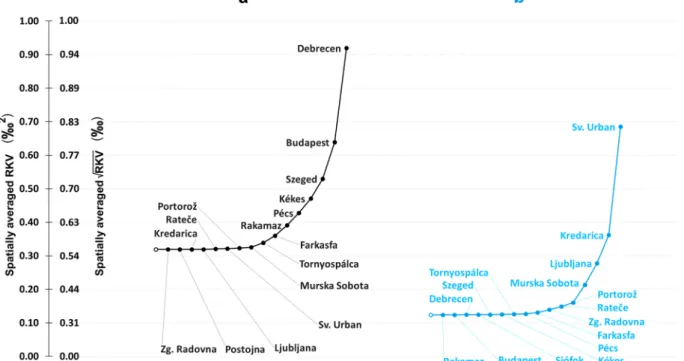
Fig. 4. The regression kriging prediction-error variance (RKV) of the active precipitation stable isotope monitoring network in 2018 across Hungary (a; Scenario 1) and Slovenia (b; Scenario 2). The values are reported as RKV (‰2) and ̅̅̅̅̅̅̅̅̅̅
√RKV
(‰) in all figures. The inset histograms show the frequency distribution of RKV across the corresponding countries. The graphs in panel (c) show the increase in spatially averaged RKV with the omission of given sites for Hungary (red) and Slovenia (blue). The RKV of the full national network (the so-called ‘zero state’), corresponding to the maps in panels (a) and (b), is indicated by an empty circle. The countries in this case are considered separately without any information exchange between their precipitation stable isotope monitoring networks. The white crosses represent the optimal location if new sites are to be set up, for details see Section 5. (For interpretation of the references to colour in this figure legend, the reader is referred to the web version of this article.)
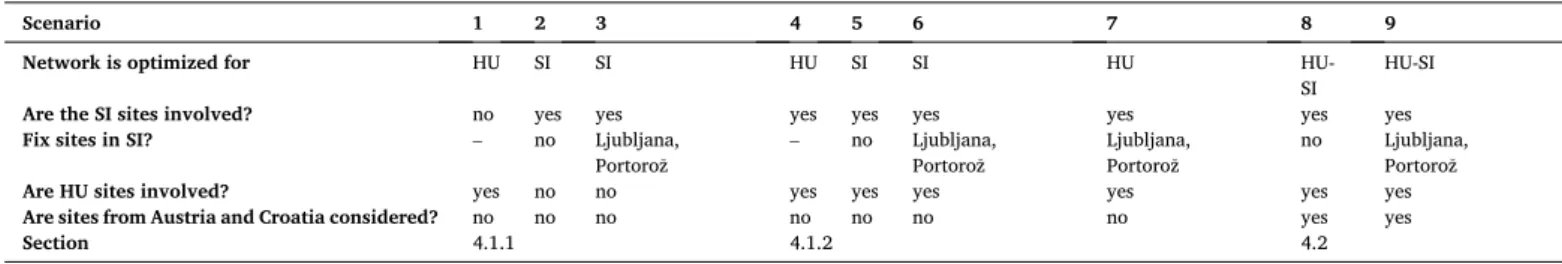
Table 1
Summary of the scenarios set in this study.
Scenario 1 2 3 4 5 6 7 8 9
Network is optimized for HU SI SI HU SI SI HU HU-
SI HU-SI
Are the SI sites involved? no yes yes yes yes yes yes yes yes
Fix sites in SI? – no Ljubljana,
Portoroˇz – no Ljubljana,
Portoroˇz Ljubljana,
Portoroˇz no Ljubljana, Portoroˇz
Are HU sites involved? yes no no yes yes yes yes yes yes
Are sites from Austria and Croatia considered? no no no no no no no yes yes
Section 4.1.1 4.1.2 4.2
networks of HU and SI are functioning. These were as follows; the net- works are
●operating in a standalone way, with no information exchange be- tween the countries, and with the condition that any monitoring site can be discarded (Scenarios 1 & 2), or that Ljubljana and Portoroˇz cannot be discarded (Scenario 3), given their long and uninterrupted period of operation since 1981 and 2000, respectively, and historical participation in the GNIP network (Vreˇca et al. 2015; Vreˇca et al.
2014).
● operating in a standalone way with information exchange between the countries and the condition any monitoring site can be discarded (Scenarios 4 & 5), and, as above, the long-term operation of the stations at Ljubljana and Portoroˇz cannot be discarded (Scenarios 6 &
7).
●being managed together with the information gathered from neigh- boring countries being taken into consideration (Scenarios 8 & 9).
4. Results and discussion
The first step after preprocessing the dataset of δp for the Adriatic Pannonian Region of 2018 was the removal of the large-scale governing effect of the spatial trend using multivariate regression. Latitude (Y) and elevation (ELE) were found to explain the effect of geographical factors influencing the δp records (Eqs. (2) and (3)) significantly (p <0.01;
corrected r2 >0.44) with negligible variance inflation (VIF =1.003).
The regression coefficients found for the ‘elevation’ parameter are justified, since these match the estimated isotopic ‘altitude’ effect for modern precipitation for the region for both isotopic species (F´orizs et al. 2011; Kern et al. 2020a; Malík and Michalko, 2010).
δ18Ô= − (5.18±6.361) +(
− 2.21[ ±1.07] ×10−6)
×Y+(
− 1.33[
±0.25] ×10−3)
×ELE (2)
δ2Ĥ=87.77±49.62+(
− 2.45[ ±0.83] ×10−6)
×Y+(
− 7.7[ ±0.19]
×10−3)
×ELE
(3) The assessment of the spatial autocorrelation structure (see Appen- dix) of the regression residuals of the then (2018) currently operating precipitation stable isotope monitoring network in Slovenia and Hungary indicated an average ~ 150 km isotropic spatial range, sug- gesting a complete spatial coverage of Slovenia and Hungary (Fig. 3), and this was even if the active monitoring sites in the neighboring countries were not considered (Fig. 3: white dots). However, the degree of the coverage increases as one moves in a southwesterly direction. As indicated by the numerous overlapping range ellipses (Fig. 3), the (south)western part of the region is much more, even over-represented (Figs. 1 and 3). Moreover, as one moves toward the eastern parts of the study area, the quality of the coverage decreases.
4.1. Exploration of the national precipitation stable isotope monitoring networks of Slovenia and Hungary
4.1.1. Considering the national networks as standalone ones with no information exchange between them (Scenarios 1–3)
It becomes clear from the maps of the kriging variances that although both countries are entirely covered by the currently active precipitation stable isotope monitoring network, in Hungary, the predictability of δ18O values is lower than in Slovenia (Fig. 4a, b). It should be noted that on the maps RKV is reported, which is a statistical measure in ‰2, the square-root of which ( ̅̅̅̅̅̅̅̅̅̅
√RKV
) is the per mil value (‰). The latter is of interest when model uncertainties are compared to actual analytical uncertainties. In Hungary, the ̅̅̅̅̅̅̅̅̅̅
√RKV
is relatively high (min =0.56‰), while in Slovenia the minimum is below 0.36‰ (Fig. 4c). Specifically,
the error of the present prediction is below 3 st. dev. of the typical analytical precision of the currently most frequently used method for stable isotope analysis of δ18O (1 st. dev. =0.1‰ (Lis et al. 2008)) in
~52% and 11% of the territory of Slovenia and Hungary, respectively (Fig. 4a,b inset histograms). The areas where the estimation uncertainty exceeds a value three times that of the analytical error ( ̅̅̅̅̅̅̅̅̅̅
√RKV
>0.3‰) lie along the central south-north axis of Slovenia and most of Hungary, except for a zone within ~25 km of the stations. If the setting up of additional monitoring sites is planned, under the current circumstances, these should be the primary subject areas to the increase quality of the representativity of the region, e.g. NW Hungary. If, however, the opposite occurs, and a monitoring station must cease its activity, the current network will suffer the least information loss if that station is removed which changes the RKV the least (Fig. 4c). In the case of Hungary, discarding Tornyosp´alca would result in the smallest infor- mation loss (Fig. 3c, and illustrated in Fig. A1a), while in the case of Slovenia discarding Zg. Radovna and Rateˇce would result in negligible information loss (Fig. 3c and A1b).
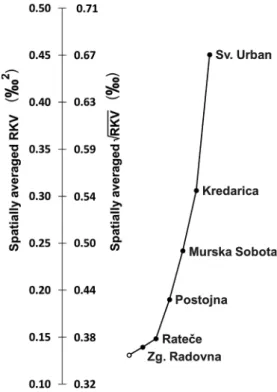
In any monitoring network, there might be stations whose impor- tance is enhanced/increased due to those providing long-term inte- grated environmental monitoring e.g. Beard et al. (1999), baseline information e.g. Bruns et al. (1991), or essential information concerning a specific environment (see Section 1). In the Slovenian network of isotopes in precipitation (SLONIP), the Ljubljana and Portoroˇz stations are such stations because of their long and uninterrupted operation and participation in the global network (Vreˇca and Malenˇsek 2016). Thus, in various scenarios (Scenarios 3, 6, 7 and 9), the question of which sta- tions could be first removed from the network if the previous two must continue operation was addressed (Table 1). In Scenario 3 the picture did not change compared to Scenario 2 (Fig. 4b,c), but discarding Zg.
Radovna and Rateˇce would result in practically negligible information loss in either case. However, the average RKV increases, since in both cases, these two stations do provide some measure of information to the network (Fig. 5).
Fig. 5.Increase in RKV (‰2) depending on which station is discarded from the active precipitation δ18O monitoring network in 2018 across Slovenia, assuming that the Ljubljana and Portoroˇz stations have to remain continuously in operation. The zero state is indicated by an empty circle.
4.1.2. Considering the national precipitation stable isotope networks of Slovenia and Hungary assuming information exchange between them (Scenarios 4–7)
In reality, the information provided by the precipitation stable isotope monitoring networks of Slovenia and Hungary extends across the national borders (Fig. 3), and it can be exchanged by the operating research institutes. Thus, any change in either may result in a change in the degree to which the other country is “covered” by its own network, especially in the case of a very small, geomorphologically and climato- logically diverse countries like Slovenia. The most pronounced effect is obviously expected near the national borders.
The target of the SSA in this case was again the separate countries, considering the information provided by the other country’s precipita- tion stable isotope monitoring network, nonetheless only taking Slovenia and Hungary into account, i.e. evaluating the RKV relative to the two countries’ areas separately. In the case of the Hungarian network, if those Slovenian sites are discarded, the removal of the
Murska Sobota precipitation monitoring station, i.e. the one closest to the Hungarian border from Slovenia (<20 km), has a noticeable effect on the precision (Δ ̅̅̅̅̅̅̅̅̅̅
√RKV
=0.114‰) of δ18O estimation in Hungary (Fig. 6a; Scenario 4). If the Slovenian network is in the focus, only the removal of the Farkasfa station located ~4 km from the Hungarian border with Slovenia has a similarly noticeable effect (Δ ̅̅̅̅̅̅̅̅̅̅
√RKV
=0.1‰) on the RKV of precipitation δ18O estimations for Slovenia (Fig. 6b;
Scenario 5), as seen above for Hungary (Scenario 4: Murska Sobota).
If a scenario is considered in which specific stations cannot be dis- carded (Ljubljana and Portoroˇz; Table 1; Scenarios 6 & 7), there is no change in the RKV of δ18O estimation observable across Hungary (in Scenario 7) as compared to a scenario (Scenario 4) in which these sta- tions could be removed. Although the order in which the removal of the stations is suggested from the Slovenian network does not change as a result of keeping these particular stations, the maximum ̅̅̅̅̅̅̅̅̅̅
√RKV across Slovenia is kept below 0.67‰ even if these are the only two stations functioning (this scenario is not shown in a figure).
Fig. 6. Increase in RKV depending on which station is discarded from the active precipitation stable isotope monitoring network in 2018 across Hungary (a; black;
Scenario 4), and Slovenia: if any station can be discarded (b; blue; Scenario 5). The countries in this case are considered separately but information exchange between them is taken into account.
Fig. 7. Difference maps of RKV from between the scenarios when neither (Scenarios 1 & 2) and both the Hungarian and Slovenian precipitation stable isotope monitoring networks have information exchange (Scenarios 4 & 5). The map showing the difference between Scenario 4 and Scenario 1 (a), and that for Scenario 5 and Scenario 2 (b). The countries in this case are considered separately but information exchange between them is taken into account.
The information exchange between the precipitation stable isotope monitoring networks of Hungary and Slovenia has a minor, but bene- ficial effect when the whole area of the countries is under consideration (average ̅̅̅̅̅̅̅̅̅̅
√RKV
=0.083‰; Fig. 7). However, a meaningful ameliora- tion of δ18O representativity (Δ ̅̅̅̅̅̅̅̅̅̅
√RKV
>0.3‰) was observed mostly near their common border. In Hungary, an increase in the precision of prediction was in the main confined to a ~10 km band along the border with Slovenia (Fig. 7a) covering two 300 km2 regions in SW and W Transdanubia, while in NE Slovenia (Prekmurje region) a 200 km2 area was positively affected by the presence of the Hungarian network at a distance of ~15 km from the border (Fig. 7b). These changes indicate improvements of the prediction model (Hengl et al. 2007) for precipi- tation δ18O estimations in the studied region.
4.2. Assessing the active precipitation stable isotope monitoring networks of Slovenia and Hungary together, with the influence of the station(s) from neighboring countries (Scenarios 8 & 9)
In geostatistics a traditional measure of the uncertainty of a pattern
based on fixed sampling locations is RKV, which is highly dependent on the proper analysis and modeling of spatial correlation structures, and which can be unreliable in the case of insufficient data or a spatial structure which is unreliable (Kanevski et al. 2009). Moreover, it is suggested that, if possible, the information provided by neighboring sites/networks should be exploited, since these can reduce the need to set up new sites (Parr et al. 2002). In the following, an optimal scenario is considered, one in which the Slovenian and Hungarian national pre- cipitation stable isotope monitoring networks are actively cooperating.
In addition, the effect of the precipitation monitoring stations operating in the neighboring countries is also taken into consideration. The dif- ference compared to the previous scenarios (Scenarios 4–7) is that in this case the RKVs are evaluated relative to the area of Slovenia and Hungary together (113 000 km2).
From the RKV map showing the precision of prediction of δ18O values it is clear that the inclusion of the ten eastern Austrian stations decreased the unrepresented areas in the western part of the region (W Hungary and N-NW Slovenia; Fig. 8a), compared to the case in which the countries were evaluated in isolation (Fig. 4). The improved coverage Fig. 8. RVK of the precipitation stable isotope monitoring network of Slovenia and Hungary if those were to be managed together and the neighboring countries’ coverage is also considered. Map (a; Scenario 8) and corresponding change in RKV if any station were to be discarded (b; Scenario 8) and if the Ljubljana and Portoroˇz stations must continue operation (c; Scenario 9). Slovenia and Hungary in this case are considered to be fully managed together.
when the Austrian stations are included (Fig. 3) has a beneficial effect on the Slovenian-Hungarian network. The positive effect of the Zagreb station from Croatia (Krajcar Broni´c et al. 2020) on the representativity of the joint Slovenian-Hungarian network is minor compared to that of the Austrian ones, and mainly manifests itself in the southern parts (Fig. 8a).
The SSA results suggest that if (i) any station could be omitted from the network (Scenario 8), then the Rateˇce and Zgornja Radovna stations would be again the first candidates, since their removal would result in an almost unnoticeable change in the ̅̅̅̅̅̅̅̅̅̅
√RKV
of δ18O estimations (<0.04‰; Fig. 8b), implying an insignificant information loss compared to the zero-state of the precipitation δ18O monitoring network of Slovenia and Hungary taken together (Fig. 8a).
Prior to the removal of a station of any hydrological monitoring network, its importance should be investigated taking into account the key factors of the post-hoc stratification of any environmental moni- toring network (see Section 1 and e.g. Parr et al. 2002). It should be taken into consideration that both Rateˇce (synoptic national meteoro- logical station) and Zg. Radovna (national precipitation meteorological station) are located in different alpine valleys with variable climatic conditions. As such, they are of high climatological and environmental value (Beard et al. 1999; Ogrin and Kozamernik 2020; Torkar et al.
2016), and can also be considered long-term integrated monitoring stations that have been providing isotope in precipitation data since 2010 (Vreˇca and Malenˇsek 2016). Thus, their conservation is of great importance in terms of their providing valuable continuous information on the spatio-temporal variations of long-term precipitation (Ogrin and Kozamernik 2020; Parr et al. 2002), which is required for a variety of fields, e.g. water resources (Torkar et al. 2016), civil engineering, agri- culture, forestry, hydrology (Frei and Sch¨ar 1998) and climatology (Widmann and Sch¨ar 1997). According to the change in RKV, the next station that could be removed is Kredarica. However, this is the highest meteorological station in the studied network (Table A1), and also the highest mountain synoptic station in Slovenia with long-term meteoro- logical observations, having ongoing stable isotope monitoring since 2010 (Vreˇca and Malenˇsek 2016). It is particularly important to have such elevated stations to obtain a robust empirical estimate for the regional ‘altitude’ effect (Kern et al. 2020a). All three stations are very specific due to their location in the vulnerable karstic alpine catchment area, with precipitation amount of up to >3200 mm and which has important influence on water resources (Ogrin and Kozamernik 2020).
If (ii) the Ljubljana and Portoroˇz stations cannot be omitted, and the effect of the neighboring Austrian and Croatian stations is considered, then the order of the first couple of stations that could be removed does not change (from Rateˇce up to Murska Sobota; Fig. 8b,c). As a conse- quence of the preservation of the two Slovenian stations (Ljubljana and Portoroˇz), the effect of the possible removal of the data provided by the Postojna (Δ ̅̅̅̅̅̅̅̅̅̅
√RKV
=0.24‰) and P´ecs (Δ ̅̅̅̅̅̅̅̅̅̅
√RKV
= 0.216‰) stations decreases relative to that of the other stations between Scenario 8 (Fig. 8b) and Scenario 9 (Fig. 8c).
4.3. Added value from the cooperation between neighboring countries’
precipitation stable isotope monitoring networks vs. standalone operation The areal average precision ( ̅̅̅̅̅̅̅̅̅̅
√RKV
) of estimating precipitation δ18O values increased by ~0.2‰ for the study area when the two countries were considered together with neighboring stations. However, along the borders of Hungary and Slovenia with their neighboring countries (Scenario 8) and each other, the improvement in ̅̅̅̅̅̅̅̅̅̅
√RKV
was well above average (Fig. 9). In 7.1% of the total area, the precision of the estimation increased by 0.32‰. This was mostly restricted to the NW corner of Hungary (in the vicinity of the Seewinkel), and in a ~60 km band exceeded ~0.63‰ along the border with Austria. There were also parts of Slovenia where the precision of estimating precipitation δ18O esti- mation was improved. There was improvement in the northern part (Koroˇska region; ̅̅̅̅̅̅̅̅̅̅
√RKV
>0.55‰) and a noticeable one in a narrower band at the SW border with Croatia (Dolenjska region; ̅̅̅̅̅̅̅̅̅̅
√RKV
>0.32‰)
(Fig. 9). The larger improvement along the Austrian border was to be expected, since there are numerous Austrian monitoring stations situ- ated closer than 15 km from the border of the study area, and are therefore closer than Zagreb, which is more than 20 km from the SW Slovenian border (Table A1).
Many approaches of different complexity and design have been applied to optimize/extend the spatial functioning of precipitation monitoring networks, among them ones based on probabilistic GIS e.g.
Shafiei et al. (2013), complex framework e.g. Chang et al. (2016); and geostatistical approaches (e.g. Agou et al. (2019); Barca et al. (2008);
Goovaerts (2000), including spatial annealing (e.g. Feki et al. (2016);
Pardo-Igúzquiza (1998)). The spatial simulated annealing algorithm it- self is a straightforward technique for optimization problems, and has been widely used for finding the best sampling design or monitoring Fig. 9.Difference map of RKV when neither Hungary and Slovenia’s precipitation stable isotope monitoring networks have information exchange (Scenarios 1 & 2), and the situation when these have information exchange between them and the neighboring countries (AT and HR), as well (Scenario 8). The map shows the difference in RKV between Scenario 8 and Scenario1∪Scenario2. The border between Hungary and Slovenia is marked with a white dotted line. The break in the isolines seen at this border is a technical artefact, because when this difference map of RKV was derived, the maps of Scenario 1 and Scenario 2 were stitched together and compared to the map of Scenario 8.
network (Baume et al. 2011; Romary et al. 2011; Szatm´ari et al. 2016;
Szatmari and P´ ´asztor 2019). The application of RKV as a pre-survey quality measure is highly recommended, since it can be derived without knowledge of the exact data values, i.e. it can be computed before the actual sampling takes place, making it a cost-effective pre- survey quality measure (Lark and Lapworth 2012). Besides, KV provides information on the geometric error of the sampling design or the monitoring network, which can be used to express uncertainty if it is reasonable to hold the assumption of normality and homoscedasticity (Szatm´ari and P´asztor 2019).
Environmental monitoring networks are primarily designed to detect variables of interest to human or ecosystem health and are primarily limited by budgetary constraints (Melles et al. 2011; Nunes et al. 2004).
In the case of already functioning networks similar to the precipitation stable isotope monitoring networks in Slovenia and Hungary which were the subject of this study, their optimization consists of two main budgetary factors: investment, in the case of new sites, and exploration, that is, the continuous operation of ongoing sites. The latter is less costly, but both have to be considered during the actual optimization of the network(s).
Data from precipitation stable isotope monitoring can serve as a useful input in hydrological models (Sprenger et al. 2016), and the ac- curacy of the results yielded by the model strongly depends on the input data; this is why precipitation monitoring network optimization is of great importance (Feki et al. 2016). In the present study, despite the presence of some degree of redundancy (Fig. 3), professional consider- ations rule out any suggestion of the removal of any of the monitoring stations functioning in 2018 in Slovenia and Hungary. Indeed, if possible, new stations should be set up in the (S)E and NW parts of Hungary and the E part of Slovenia to improve the precision of esti- mating precipitation stable isotope values in the region yet further. The latter two would assume yet greater importance if the neighboring networks were for any reason to stop operating in future.
5. Where to set up additional precipitation stable isotope monitoring site(s) in Slovenia and Hungary?
The question of the optimal location for additional sampling site(s) to be set up if the possibility arises remains to be addressed. In the case of Hungary, if one new site is installed, it should be placed in the north- west part of the country (47.469◦N, 17.355◦E; Fig. 4a), while a second one in eastern Hungary (47.009◦N, 20.498◦E; Fig. 4a) would also be a valuable addition. The addition of one or two sites would increase the mean accuracy of the estimation of precipitation stable isotopes by 5%
and 11%, respectively (areal average ̅̅̅̅̅̅̅̅̅̅
√RKV
for Hungary).
In Slovenia, the most appropriate location for an additional site would be in the south-eastern part of the country, close to its border with Croatia (45.941◦N, 15.502◦E; Fig. 4b), which would result in a 13%
increase in the precision of modeling the variance of stable isotopes in precipitation across Slovenia. Indeed, new stations set up in the NW and (S)E parts of Hungary and the SE part of Slovenia would improve the precision of estimating precipitation stable isotopes in the region yet further.
6. Conclusions
The current research is the first example of the detailed geostatistical assessment of the spatial representativity of a precipitation stable isotope monitoring network. It provides essential information for pre- sent and future international co-operation in precipitation stable isotope monitoring network across Slovenia and Hungary by providing an
objective overview of the current state of the representativity of the monitoring stations of stable isotopes in precipitation under various scenarios. With variography, the areas that are insufficiently repre- sented, and those that are overrepresented by the current network have been determined. More importantly, the evaluation of the change in regression kriging variance by spatial simulated annealing (SSA) has pointed out that:
(i) the mutual information exchange of the precipitation stable isotope monitoring networks of Slovenia and Hungary increases the precision of estimating precipitation δ18O values by ~0.3‰ in a 15–30 km band near the borders,
(ii) by taking into account data available from stations in other neighboring countries (Austria and Croatia), the real average precision of estimating precipitation δ18O values increased by
~0.2‰ across Slovenia and Hungary, and
(iii) there are certain stations which could be discarded on the basis of their modest influence on the overall network: Rateˇce and Zg.
Radovna in Slovenia and Tornyosp´alca in Hungary, although professional considerations have to be taken into account before any decision is made.
The current network provides an appropriate representation to monitor precipitation stable isotopes across Slovenia and Hungary;
however, to increase the precision of estimating precipitation stable isotopes by at least 10%, one additional station is required in Slovenia, and two in Hungary.
On the basis of an extended regional network, the community would be able to establish more realistic isoscapes of precipitation for this part of Europe. Nevertheless, in the future, when new/additional data rep- resenting a longer timespan become available, the precipitation stable isotope monitoring network design can and should be re-evaluated.
CRediT authorship contribution statement
Istv´an Gabor Hatvani: ´ Conceptualization, Investigation, Data curation, Formal analysis, Writing - original draft. Gabor Szatm´ ´ari:
Methodology, Investigation, Software, Writing - original draft. Zoltan ´ Kern: Conceptualization, Funding acquisition, Supervision, Writing - original draft, Investigation, Project administration. D´aniel Erd´elyi:
Data curation, Formal analysis, Visualization. Polona Vreˇca: Funding acquisition, Supervision, Project administration, Writing - review &
editing. Tjaˇsa Kanduˇc: Resources, Writing - review & editing. Gy¨orgy Czuppon: Resources, Writing - review & editing. Sonja Lojen: Re- sources. Bal´azs Koh´an: Methodology.
Declaration of Competing Interest
The authors declare that they have no known competing financial interests or personal relationships that could have appeared to influence the work reported in this paper.
Acknowledgements
The authors would like to express their gratitude to the staff of the Slovenian Environment Agency and the Hungarian Meteorological Ser- vice at the meteorological stations, in addition thank and Mr. I. Kanduˇc for their valuable help in collecting the precipitation samples, and Mr. S.
ˇZigon for assistance with isotope analysis. The results of this study have been discussed within the COST Action: “WATSON” CA19120. The au- thors applied the SDC approach to the sequence of authors. See https://
doi.org/10.1371/journal.pbio.0050018 for further details. This is
contribution No. 75 of 2 ka Palæoclimatology Research Group.
Funding
This work was supported by the National Research, Development and Innovation Office under Grants SNN118205, PD121387; Slovenian Research Agency ARRS under Grants: N1-0054, J4-8216 and P1-0143;
IAEA CRP F31006 (contract No. 23485). The work of G´abor Szatm´ari was supported by the Premium Postdoctoral Scholarship of the Hun- garian Academy of Sciences under Grant: PREMIUM-2019-390. The research was partly supported by the European Union and the State of Hungary, co-financed by the European Regional Development Fund in the project of GINOP-2.3.2-15-2016-00009 ‘ICER’.
Appendix A
See Table A1 and Fig. A1.
Table A1
Basic geographical information of precipitation stable isotope monitoring stations operating in Slovenia and Hungary and in the neighboring countries within a 150 km band with publicly available data for 2018, arranged by country and longitude.
Name Lat (◦) Lon (◦) Elevation (m) Country Source
Farkasfa 46.91 16.309 312 HU HU-SI cooperation SNN118205 and N1-0054 projects
Si´ofok 46.911 18.041 108 HU
P´ecs 45.994 18.235 198 HU
Budapest 47.432 19.187 139 HU
K´ekes 47.872 20.013 1012 HU
Szeged 46.256 20.09 81 HU
Rakamaz 48.128 21.47 940 HU
Debrecen 47.475 21.494 110 HU
Tornyosp´alca 48.273 22.177 108 HU
Portoroˇz 45.475 13.616 2 SI
Rateˇce 46.497 13.713 864 SI
Kredarica 46.379 13.849 2514 SI
Zg. Radovna 46.428 13.943 750 SI
Postojna 45.766 14.193 533 SI
Ljubljana 46.095 14.597 282 SI
Sv. Urban 46.184 15.591 283 SI
Murska Sobota 46.652 16.191 186 SI
Villacher Alpe 46.603 13.672 2164 AT ANIP; Umweltbundesamt (2019)
Klagenfurt 46.643 14.32 447 AT
Eisenkappl 46.489 14.584 550 AT
Graz Universit¨at 47.078 15.45 366 AT
Karlgraben 47.678 15.56 775 AT
Gutenstein 47.875 15.886 475 AT
Gloggnitz 47.675 15.943 440 AT
Wien Hohe Warte 48.249 16.356 203 AT
Moosbrunn 48.019 16.464 186 AT
Podersdorf 47.855 16.835 120 AT
Zagreb 45.817 15.983 157 HR Krajcar Broni´c et al. (2020)
Fig. A1. RKV maps of Hungary (a), and Slovenia (b) for 2018 under Scenarios 1 and 2, with the omission of sites representing the least valuable information on precipitation δ18O variance in the two countries separately. In the case of Hungary, the map represents the RKV without the information provided by the Tor- nyosp´alca station (a), while for Slovenia, the Zgornja Radovna and Rateˇce stations have been omitted. The countries in this case are considered separately without any information exchange between them.