Quarterly Report on Inflation
- update -
Published by the Magyar Nemzeti Bank
Publisher in charge: Judit Iglódi-Csató, Head of Communications 1850 Budapest, 8–9 Szabadság tér
www.mnb.hu ISSN 1419-2926 ISSN 1585-020X (online)
Act LVIII of 2001 on the Magyar Nemzeti Bank, which entered into effect on 13 July 2001, defines the primary objective of Hungary’s central bank as the achievement and maintenance of price stability.
Low inflation allows the economy to function more effectively, contributes to better economic growth over time and helps to moderate cyclical fluctuations in output and employment.
In the inflation targeting system, from August 2005 the Bank seeks to attain price stability by ensuring that inflation remains near the 3 per cent medium-term objective. The Monetary Council, the supreme decision-making body of the Magyar Nemzeti Bank, undertakes a comprehensive review of the expected development of inflation every three months, in order to establish the monetary conditions that are consistent with achieving the inflation target. The Council’s decision is the result of careful consideration of a wide range of factors, including an assessment of prospective economic developments, the inflation outlook, money and capital market trends and risks to stability.
In order to provide the public with a clear insight into the operation of monetary policy and to enhance transparency, the Bank publishes the information available at the time of making its monetary policy decisions. The Quarterly Report on Inflation, published semi-annually and updated twice a year between the two publications since 2006, presents the forecasts prepared by the Economics and Monetary Policy Directorate’s staff for inflation, as well as the macroeconomic developments underlying the forecast. The forecasts of the Economics and Monetary Policy Directorate’s staff are based on certain assumptions; in producing its forecast, the staff assumes an unchanged monetary and fiscal policy. In respect of economic variables exogenous to monetary policy, the forecasting rules used in previous issues of the Report are applied.
The analyses in this Report were prepared by the Economics analysis and research and the Financial Analysis’s staff under the general direction of Ágnes Csermely,Deputy Director and Mihály András Kovács, Economic Advisor. The project was managed by Barnabás Virág, Economist. The Report was approved for publication by Ferenc Karvalits, Deputy Governor.
Primary contributors to this Report also include Judit Antal, Szilárd Benk, Győző Eppich, Péter Gál, Zoltán Gyenes, Cecília Hornok, Hedvig Horváth, M. Zoltán Jakab, Éva Kaponya, Mihály András Kovács, Zsolt Lovas, Szabolcs Lőrincz, Gábor Orbán, Balázs Párkányi, Márton Peresztegi, Máté Barnabás Róbert Szemere, Tóth, Barnabás Virág, Balázs Vonnák.. Other contributors to the analyses and forecasts in this Report include various staff members of the Economics analysis and research and the Financial Analysis.
The Report incorporates valuable input from the Monetary Council’s comments and suggestions following its meetings on 13th of August and 27th of August 2007. However, the projections and policy considerations
CONTENTS
1 FINANCIAL MARKETS 8
2 LATEST DEVELOPMENTS AT THE MACROECONOMIC LEVEL 11
2. 1 Considerable deceleration in GDP growth 11
2. 2 Strong European economic activity is expected to peak 12
2. 3 Uncertain turning point in investment 13
2. 4 Declining consumption demand 14
2. 5 Labour market: first signs of adjustments of wages, stagnant labour demand and activity 15
2. 6 Inflation developments in line with our expectations 20
3 OUTLOOK FOR INFLATION AND THE REAL ECONOMY 23
3. 1 Significant slowdown in economic activity on the forecast horizon in spite of growing external demand 23
3. 2 Major improvement in the external balance is forecasted 25
3. 3 Inflation: major increases in food prices override our main scenario in the May Report 26
3. 4 Inflation and growth risks 29
Overview
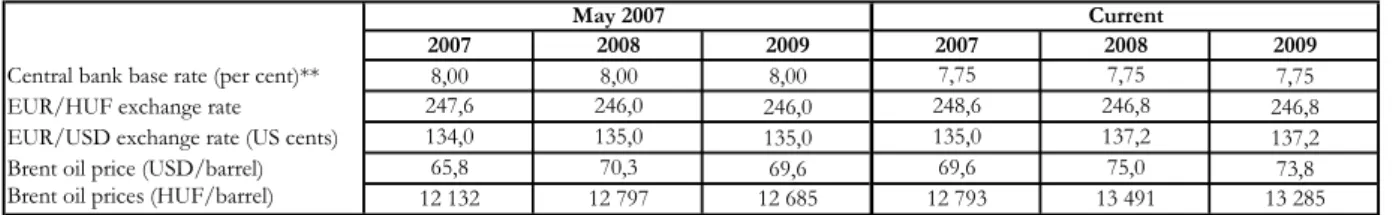
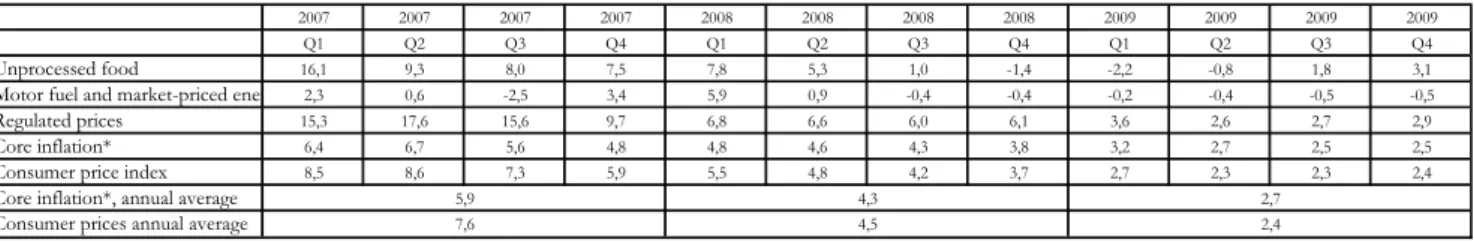
In our updated Report we forecast consistently high inflation until the end of 2008, and CPI below target for 2009In our updated projection which assumes no change in the average monetary conditions for July (EUR/HUF 246, base rate of 7.75%), inflation moderates much more slowly than forecast in May, but drops somewhat below the medium-term target in 2009. While the underlying macroeconomic processes (negative output gap, assumed wage adjustment) still point towards disinflation, the inflation scenario has been changed to take account of recent rises in food and oil prices. In line with our earlier practice and forecasting rules, these shocks are broadly deemed to be temporary developments. Therefore, as compared to May, the inflation projection for 2008 has been raised by nearly 1 percentage point. And disinflation picks up temporarily in 2009, due to the assumed decline in food prices.
In the main scenario we continue to assume that inflation expectations are anchored by the medium-term inflation target
The temporary effect of cost shocks follows from our assumption that inflation expectations will remain anchored. This is reinforced by the disinflationary effect of the negative output gap. Developments in wages play an important role in the adjustment to cost and supply shocks. According to our estimates, wage adjustment started in the first half of 2007; and the pricing strategy recently observed also indicates that the rise in service sector real wages over and above the pace of growth in productivity can be seen as a temporary development. Although the slower decline in inflation increases the probability of a higher wage path, the stronger slowdown in economic growth has an opposite effect. Consequently, as a whole, we have not changed our May projection in respect of rapid wage adjustment: the growth rate of wages in the private sector is forecast to decrease considerably in the course of 2007, and then to settle at a level consistent with the medium-term inflation target and long-term productivity trends.
More pronounced economic slowdown despite more favourable external economic activity
Despite the continued benign international business climate, Hungary’s real economic prospects have changed negatively, mainly due to the very low growth rate in the second quarter. While the unfavourable agricultural developments will mostly influence this year’s GDP growth, according to the economic indicators for Q2 the slowdown may be broader based and it may affect a number of market sectors, in addition to the public sector. The prolonged decline in construction sector output foreshadows moderate developments in investment, which may weaken the long-term growth potential of the economy. As consumption growth will remain very subdued, the expected development of the real economy will continue to facilitate disinflation; however, it will not support the acceleration of long-term economic growth and convergence.
Upside inflation risks
and slightly downside On the forecast horizon, the inflation risks are considered to be on the upside, while the risks related to economic growth are weighted
our main scenario. disinflationary effect is stronger than supposed, this will also mitigate inflation risks. However, as the disinflation process now seems slower than previously expected, this increases the risks of inflation expectations being anchored above the target.
Inflation forecast fan chart
-1 0 1 2 3 4 5 6 7 8 9 10
05:Q1 05:Q2 05:Q3 05:Q4 06:Q1 06:Q2 06:Q3 06:Q4 07:Q1 07:Q2 07:Q3 07:Q4 08:Q1 08:Q2 08:Q3 08:Q4 09:Q1 09:Q2 09:Q3 09:Q4
Per cent
-1 0 1 2 3 4 5 6 7 8 9
10 Per cent
GDP growth fan chart
0 1 2 3 4 5 6
05:Q1 05:Q2 05:Q3 05:Q4 06:Q1 06:Q2 06:Q3 06:Q4 07:Q1 07:Q2 07:Q3 07:Q4 08:Q1 08:Q2 08:Q3 08:Q4 09:Q1 09:Q2 09:Q3 09:Q4
Per cent
0 1 2 3 4 5 6 Per cent
Summary table of the overview of the main scenario
(The forecasts are conditional: the main scenario reflecting the most probable scenario that applies only if all the assumptions presented materialise; unless otherwise specified, percentage changes on a year earlier)
2006 2007 2008 2009
Actual Actual/Estimate Projection
May Current May Current May Current May Current
Inflation (annual average)
Core inflation 1 2.4 5.7 5.9 3.4 4.3 3.1 2.7
Consumer price index 3.9 7.3 7.6 3.6 4.5 2.8 2.4
Economic growth*
External demand (GDP-based)2 3.8 3.3 3.4 2.6 3.0 2.7 3.2
Impact of fiscal demand3 0.8 -3.4 ↓ -1.6 ↔ -0.3 ↔
Household consumption 1.2 1.9 -0.8 -0.9 0.6 0.2 1.8 1.6
Fixed capital formation -1.8 -2.1 2.3 1.8 4.6 4.5 5.9 5.8
Domestic absorption 0.5 0.4 0.0** -0.2** 1.7** 1.1 3.2 3.0
Export 18.0 17.9 15.3 14.7 11.8 12.4 9.5 11.3
Import 12.6 12.4 12.2** 11.9** 10.7** 10.6 9.4 11.0
GDP 3.9(4.0)* 3.9 (4.0)* 2.5 2.0 2.8 2.7 3.4 3.4
Current account deficit4
As a percentage of GDP 5.8 4.7** ↑ 4.4** ↔ 4.2 ↔
EUR billions 5.2 4.9** ↑ 4.9** ↔ 4.9 ↔
External financing requirement4
As a percentage of GDP 5.0 3.3** ↑ 2.3** ↔ 1.8 ↔
Labour market
Private sector gross average earnings5 9.5 8.6 **** 7.1 ↔ 6.3 ↔
Private sector employment6 1.5 0.0 ↔ 0.1 ↔ 0.1 ↔
Household real income 0.1*** -2.8 ↔ 2.3 ↓ 2.3 ↑
1 For technical reasons, the indicator that we project may temporarily differ from the index published by the CSO; over the longer term, however, it follows a similar trend. 2 For technical reasons, our forecasts for external demand relying on the May Inflation Report differ from the official figures contained in the May Inflation Report, for we have included in our projections for external demand the forecasts published relating to Hungary’s trade with Romania. 3 Calculated from the so-called augmented (SNA) type indicator; a negative value means a narrowing of aggregate demand. 4 As a result of uncertainty in the measurement of foreign trade statistics, from 2004 actual current account deficit and external financing requirement may be higher than suggested by official figures or our projections based on such figures. 5 Calculated on a cash-flow basis 6 According to the CSO labour force survey.
* Adjusted for leap-year effect.
** Our projection includes for 2007 the impact of the Hungarian Army’s Gripen purchase, which raises the current account deficit and increases community consumption and imports.
*** An MNB estimate.
**** Our expectations relating to the annual growth rate in the gross average earnings published by the CSO for 2007 have increased in the light of higher than expected actual data. However, according to our judgement, it is due largely to the unforeseen extent of whitening that took place during the first half.
According to our estimate, the wage index – adjusted with the impacts of whitening and offering a better view of trend developments – in 2007 is consistent with the path that was outlined in May.
↑ We are of the opinion that this particular forecast is expected to be higher than what is contained in the Inflation Report of May 2007.
↓ We are of the opinion that this particular forecast is expected to be lower than what is contained in the Inflation Report of May 2007.
↔ We are of the opinion that this particular forecast is expected to be about the same as what is contained in the Inflation Report of May 2007.
1 Financial markets
Since mid-July, uncertainty in the international investment environment has increased considerably. The turbulence on the financial markets was triggered by negative news in relation to problems in the US sub-prime mortgage lending market. Market participants’ risk appetite waned considerably, and as a result, prices of more risky asset classes started falling rapidly. Yield spreads on corporate bonds compared to US government bonds increased to a multi-annual high within a few weeks, and the stock market indices in the developed markets also dropped 5 to 10 per cent.
At the same time, most of the currencies of countries with high interest rates also weakened by more than 5 per cent.
Chart 1-1 Bond and credit indices
150 200 250 300 350 400
2005. Jan 2005. Feb 2005. Mar 2005. Apr 2005. May 2005. Jun 2005. Jul 2005. Aug 2005. Sep 2005. Oct 2005. Nov 2005. Dec 2006. Jan 2006. Feb 2006. Mar 2006. Apr 2006. May 2006. Jun 2006. Jul 2006. Aug 2006. Sep 2006. Oct 2006. Nov 2006. Dec 2007. Jan 2007. Feb 2007. Mar 2007. Apr 2007. May 2007. Jun 2007. Jul 2007. Aug Basis point
20 29 38 47 56 Basis point65
EMBI MAGGIE High yield MAGGIE A (r.h.s.)
The major decline in demand for risky assets triggered a drop in domestic asset prices as well: at the end of July yields increased, on the one hand, and the exchange rate of the HUF depreciated, on the other hand. It weakened to a level around EUR/HUF 250 from the trading band of EUR/HUF 245–247.
On the other hand, the next shock in the middle of August, which was also induced by the international capital markets, was reflected almost exclusively in the decline of the exchange rate of the HUF and did not affect yields. The reason for this was that the inflation rate in July and the unexpectedly bad GDP data in the second quarter supported market participants’ expectations of a reduction in interest rates, resulting in a stabilisation of short-term yields. Thus, the adjustment took place in the currency market. By mid-August the exchange rate depreciated to EUR/HUF 261, the weakest level since the end of January.
Although as a result of macro-economic news the short-term interest rate expectations remained stable, longer-term yields rose. Due to the money market turbulence, the five-year forward premium to the EUR rose back close to the levels observed in March, in spite of the fact that in the period since May, almost all of the data published on the fiscal policy and the external balance were favourable, similarly to the first half of the year.
Compared to developments in exchange rates and yields in the countries in the region, both the depreciation of HUF and the rise in the long forward premium exceeded the rates observed in the Central and Eastern European region. In addition to the fact that − despite the improvement −
Hungary’s macro-economic fundamentals are more unfavourable, another factor which may have contributed to the stronger price losses on Hungarian assets was that a rate rise cycle is taking place in the other countries of the region. In July and August, the weakening of HUF was on par with the depreciation of currencies considered more risky (Brazil real, South African rand, Turkish lira). In general, it can thus be said that in spite of the considerable improvement in internal and external developments in the past half year HUF is more vulnerable to global capital market shocks than the currencies of the region.
According to market expectations derived from the yield curve in late June, the base rate was expected to decline close to 7% by the end of 2007, and around 6,5% by the end of 2008. The Magyar Nemzeti Bank reduced its reference interest rate by 25 basis points in June while no change occurred in May and July. The majority of the market analysts expected the start of a rate reduction cycle in July-August, and therefore some market participants were surprised by the move in June. After the decision, investors priced in a further rate reduction of 25 basis points for this year, and also for next year compared to the previous path. This was, however, scaled back due to the money market turbulence at the end of July. The continued worsening of the international investment environment in August did not affect market expectations of monetary policy steps for this year, but while previously the market had been expecting a reduction in interest rates for 2008, this expectation disappeared in August.
Chart 1-2 MNB policy rate expectations
6 6,25 6,5 6,75 7 7,25 7,5 7,75 8
2006. Mar 2006. Apr 2006. May 2006. Jun 2006. Jul 2006. Aug 2006. Sep 2006. Nov 2006. Dec 2007. Jan 2007. Feb 2007. Mar 2007. Apr 2007. May 2007. Jul 2007. Aug 2007. Sep 2007. Oct 2007. Nov 2007. Dec 2008. Jan 2008. Mar 2008. Apr 2008. May 2008. Jun 2008. Jul 2008. Aug 2008. Oct 2008. Nov 2008. Dec Per cent
6 6,25 6,5 6,75 7 7,25 7,5 7,75 8 Per cent
MNB policy rate 25 Jun 2007 3 Jul 2006 17 Aug 2007
In the quarter since May, monetary conditions have eased. Due to the depreciation of the exchange rate in July and August, the real exchange rate depreciated considerably in August, while the forward real interest rate remained broadly unchanged. Although one-year yields have increased slightly due to the money market turbulence, this effect was counterbalanced by the fact that market participants’ forward-looking inflation expectations have also risen. All in all, this meant that the real interest rate fluctuated around 3 per cent as seen in the recent years, while the real exchange rate depreciated to near the levels observed at the beginning of the year.
Chart 1-3 Monetary conditions*
0 1 2 3 4 5 6 7 8 9 1 0
Jan.97 July.97 Jan.98 July.98 Jan.99 July.99 Jan.00 July.00 Jan.01 July.01 Jan.02 July.02 Jan.03 July.03 Jan.04 July.04 Jan.05 July.05 Jan.06 July.06 Jan.07 July.07
Per cent
95 10 0 10 5 11 0 11 5 12 0 12 5 13 0 13 5 14 0 14 5 Per cent
1 év es reálkamat CPI based real exchange rate (r.h.s.)
* In case of real exchange rate decreasing means depreciation. Data of august 2007 is a technical assumption base on information received up to 17th of August.
2 Latest developments at the macroeconomic level
2. 1 Considerable deceleration in GDP growth
In the first half of 2007, the Hungarian economy continued the deceleration which started in 2005.1 Following a moderate slowdown in the first quarter, in the second quarter the annual growth rate dropped even more than expected. According to preliminary data, the growth rate of 2.1 per cent in the first half of the year is considered low, not only in comparison to the region but also to the expansion of the euro area.
The significant drop in economic growth in 2007 might2 have been negatively influenced by important one-off factors, in addition to the effects of the fiscal balance-improving measures which have lowered domestic demand. Among these factors, the performance of agriculture is worth emphasizing as a significant decline has been observed due to unfavourable weather conditions. On the other hand, the sustained decline in construction sector output also negatively affects the long-term growth prospects in addition to the fact that it calls into question the sustainability of the turn-around seen in investments in the first quarter.
Supported by the favourable international boom, the manufacturing industry continues to be the driving force behind economic activity, providing a historically strong contribution to growth from the side of net exports through the dynamic expansion of export sales with a simultaneous decline in domestic demand. Following growth in the first quarter, household consumption expenditures is expected to show a decline in the second quarter.
Chart 2-1 Economic growth in Hungary*
Seasonally adjusted date
0 1 2 3 4 5 6 7
96:Q1 96:Q4 97:Q3 98:Q2 99:Q1 99:Q4 00:Q3 01:Q2 02:Q1 02:Q4 03:Q3 04:Q2 05:Q1 05:Q4 06:Q3 07:Q2
Percent
0 1 2 3 4 5 6 Percent 7
Annual growth Annualized quaterly growth
* Data for the second quarter 2007 based on preliminary publication of CSO.
Our analysis was conducted based on information received up to 17 August.
2. 2 Strong European economic activity is expected to peak
The development of the domestic real economy continues to be supported by very favourable external market conditions. On the other hand, in 2007 Q1 economic growth stopped accelerating:
the main reason for this was the temporary demand-reducing effect of the VAT rise in Germany.
Business sentiment indices continue to suggest historically strong economic activity, although no further rise was observed in the key confidence indicators in recent months. The Q2 growth data also suggest the international economic cycle is reaching its peak, and the data show slower-than- expected growth throughout the euro area. The sustained slowdown in European economic growth in the last quarter is not reflected in the developments observed in industrial production, which is more relevant for the Hungarian export sector. Deceleration of industrial production did not continue in the economies of the euro area during the second quarter of 2007 which continues to result in favourable economic prospects for Hungarian export companies.
Chart 2-2 Development of the industrial production in the euro area and Germany Trend data, annualised monthly growth
-8 -6 -4 -2 0 2 4 6 8 10
Jan.00 May.00 Sept.00 Jan.01 May.01 Sept.01 Jan.02 May.02 Sept.02 Jan.03 May.03 Sept.03 Jan.04 May.04 Sept.04 Jan.05 May.05 Sept.05 Jan.06 May.06 Sept.06 Jan.07 May.07
Percent
-8 -6 -4 -2 0 2 4 6 8 Percent10
Industrial production - Germany Manufacturing production - Germany Industrial production - Eurozone
On the basis of actual data and the market trend indicators available for the second quarter, net exports are lagging somewhat behind our forecast for May, but still strong net exports can be expected for the first half of 2007. This is attributed partly to the stronger growth of imports in the first quarter and partly to the marked deceleration of the export performance in the second quarter. The rising imports at the beginning of the year partly resulted from the lively investment demand, due to the increase in manufacturing industry investment in the first quarter, and partly from the stronger-than-expected consumption-related demand. According to the most recent foreign trade data, the deceleration observed in the second quarter in export growth did not continue in the summer months. Accordingly, supported by the import-reducing effect of the subdued domestic demand, we can expect a new upturn in export growth from the third quarter, which will result in a more favourable net exports scenario in respect of growth in the remaining part of the year than in the first half of the year.
Growth in industrial production has continuously decelerated since the middle of last year. At the beginning, the slower growth was only caused by a slowdown in domestic sales, but this year, in parallel with the presumably temporary slowdown in international business activity, the decline in export sales is also considerable. The slower growth of total industrial production compared to the countries in the region may be mainly explained by the effect of the fiscal adjustment which has lowered domestic demand, on the other hand, the developments observed in case of export sales
in these sectors also highlight the limits caused by the lack of investments and the rise in capacity utilization in the past few years.
Data about production of last months however – in line with European industrial business climate and Hungarian foreign trade data – refer to a slowdown of temporary kind, thus the Hungarian industry reacted more intensively to this temporary factor than previously.
Chart 2-3 Industrial production in the region and the euro area Annual change
-5 0 5 10 15 20
Jan.01 Apr.01 July.01 Oct.01 Jan.02 Apr.02 July.02 Oct.02 Jan.03 Apr.03 July.03 Oct.03 Jan.04 Apr.04 July.04 Oct.04 Jan.05 Apr.05 July.05 Oct.05 Jan.06 Apr.06 July.06 Oct.06 jan.07 Apr.07
year on year volume indices, per cent
-5 0 5 10 15 20
year on year volume indices, per cent
Czech Republic Poland Slovakia Hungary (CSO) euro area
2. 3 Uncertain turning point in investment
As outlined in the May Report, there was a slight turn in the dynamics of the total investment volume in the first quarter.3 However, the permanent nature of the change in the trend is questioned by several factors. Following declines in earlier quarters, significant growth was recorded only in manufacturing investment, which is the most export oriented, while household and government investment presumably continued to decline. Moreover, the increase in manufacturing investment is mainly attributable to large investments in the rubber industry.
Without excluding this sub-sector, compared to earlier periods of upturns in Europe, our estimations suggest that manufacturing investment dynamics was somewhat weaker. Signs thus indicate that the turn-around in the trend driven by the export sector may have started. At the same time, despite the strong external economic activity, investment activity has been weak in this field since 2005. Therefore, we presently believe that the favourable Q1 data can be interpreted as a partial compensation for unimplemented investment, which is insufficient to reduce the tension in production caused by increasing capacity utilisation and to considerably improve export performance.
3 Although the whole-economy gross fixed capital formation dynamics which appeared in the GDP statistics continue to show negative annual growth, investment statistics indicate a slight growth. The difference is mainly attributable to the different volume calculation methodologies of the two statistics, and not to economic phenomena. As, on a quarterly level, only the investment statistics, which are published with a detailed breakdown as well, reflect the
Chart 2-4 Investment, external demand and capacity utilisation Annual changes
-20 -10 0 10 20 30 40 50 60
98:Q1 98:Q4 99:Q3 00:Q2 01:Q1 01:Q4 02:Q3 03:Q2 04:Q1 04:Q4 05:Q3 06:Q2 07:Q1 year on year volume indices, per cent
50 55 60 65 70 75 80 85 90
in level, per cent
Import based foreign demand Investments in manufacturing
Investments in manufacturing without rubber manufacturing Total investments less manufacturing investments Capacity utilisation in manufacturing (left scale, per cent)
In the sectors which mainly depend on domestic demand, investment dynamics continue to be negative: due to the decline in real income, investment by companies which produce and provide services for the domestic market and investment by households is expected to continue declining strongly.4 As a result of fiscal consolidation, the fall in investment was probably the strongest in the government sector. The risks related to the turning point in Q1 are further increased by the decline in construction output in the second quarter, which again indicates low whole economy investment activity for 2007 Q2.
2. 4 Declining consumption demand
In the May Report, we predicted that during the first quarter of 2007 household consumption expenditure would follow the path of real incomes and decline slightly. However, household consumption increased modestly, rising by 0.6 per cent, despite the significant reduction in real incomes, which occurred as predicted. This growth was funded by a slowing trend in household savings, and by increasing demand for consumer loans, denominated mostly in foreign currency, which rose to heights never seen before.
According to data seen till May, contrary to the favourable consumption indicators seen in Q1, the declining trend in retail sales which began in 2006 Q2 continued. Moreover, following the massive drop in durable goods, according to the data published for May, a substantial decline was also seen in semi-durable as well. In spite of the fact that this statistical figure supports that household spending did not decline at the beginning of 2007 as expected in line with the significant reduction of household incomes in terms of real value, it nevertheless shows a decidedly more significant drop in consumer demand than the GDP-based consumption indicator. The drop in retail sales – including durable, semi-durable and non-durable goods – seen in recent months may be explained by the composition of the consumption basket: lower real incomes and the increases in the inflexible public utility charges combined led to a major decline in demand for industrial products.
The drop in retail sales in April and May, on the other hand, offers an early insight suggesting that consumption expenditures – after a relatively robust first quarter – will settle on the slowing path in 2007 as we outlined in May.
4 Sectoral investment estimates (companies, households, state) are derived from sectoral investment figures, based on
Chart 2-5 Household consumption expenditures and retail sales Annualised quarterly growth rate
-10 -5 0 5 10 15
95:Q2 96:Q1 96:Q4 97:Q3 98:Q2 99:Q1 99:Q4 00:Q3 01:Q2 02:Q1 02:Q4 03:Q3 04:Q2 05:Q1 05:Q4 06:Q3 07:Q2
Percent
-10 -5 0 5 10 Percent 15
Consumption expenditure Retail sales
April-May
2. 5 Labour market: first signs of adjustments of wages, stagnant labour demand and activity
In the May Report, we assessed that wage growth in the private sector, and especially in the services sector, was inconsistent with productivity growth. We looked at this as a temporary loss of profits and in our view the most likely scenario was that the profit margin can be restored primarily by restraining wage inflation, and to some extent by layoffs, so high wages would not lead to any major increase in prices.
During the past three months the overall gross wage index published by the CSO was slightly higher than we predicted. In our opinion, this is due largely to the fact that the process of whitening of the economy continued during the first half of the year, which we did take into account for the data available in May, but we did not predict any further whitening in our forecast.
Nevertheless, on the whole our estimate of the wage index, corrected for whitening and offering a better view of trend developments, managed to comply with the path outlined in May in the first half of 2007.
Chart 2-6 Gross average earnings in the private sector, manufacturing and market services sectors Annual growth rates
4 6 8 10 12 14 16 18
01:Q1 01:Q3 02:Q1 02:Q3 03:Q1 03:Q3 04:Q1 04:Q3 05:Q1 05:Q3 06:Q1 06:Q3 07:Q1
Per cent
4 6 8 10 12 14 16 Per cent18
Private sector Manufacturing Market services
Additionally, in the overall gross average wages there are some signs of adjustments, manifested in the slower trend in the payment of bonuses. As for the structure of wage growth, another favourable sign is that the adjustment of bonuses was particularly intense in the services sector, where extreme wage improvements took place, inconsistent with the growth of productivity. The implementation of adjustments through bonuses undoubtedly appears to be the most logical choice of short-term wage adjustments at the corporate level. At the same time, however, the continued improvement in growth of regular wages bills a shadow over this picture. Moreover, within the overall wage dynamics, the reduction of the bonuses component was due largely to the financial services sector, where the principle of performance based remuneration is supposedly stronger, hence showing more signs of cyclical adjustments. Consequently, there is a risk that the stagnation/slowdown seen in the annual index will not be substantiated by lasting processes, and the strong dynamics of regular wages – which adjust more slowly – will continue to prevail in the future.
Chart 2-7 Gross average earnings without bonuses in the private sector, manufacturing and market services sectors
Annual growth rates
6 7 8 9 10 11 12
04:Q1 04:Q2 04:Q3 04:Q4 05:Q1 05:Q2 05:Q3 05:Q4 06:Q1 06:Q2 06:Q3 06:Q4 07:Q1 07:Q2
Per cent
6 7 8 9 10 11 Per cent 12
Private sector Manufacturing Market services
From the point of view of labour market adjustment, latest labour market survey conducted by the HAY Group provides some favourable news. According to the inquiry conducted at the end of July this year, the mostly large multi-national companies interviewed have increased their regular wages and fix bonuses by 6.3 per cent since May of 2006. For the same period, these companies revealed 6.7 per cent in February in the survey we discussed in our May Report. While the 6.3 per cent increase is higher than the growth rate typically seen in previous years, which is in line with our view formulated on the acceleration of wages last year, the actual wage increase is lower than what was planned in February. This might indicate that wage adjustments are now under way.
Chart 2-8 HAY wage survey and CSO gross average wages Annual average growth rates, in per cent
0 2 4 6 8 10 12 14 16 18
2000 2001 2002 2003 2004 2005 2006 2007
Per cent
0 2 4 6 8 10 12 14 16 Per cent18
CSO gross average wages HAY performance component HAY inflation/living costs component HAY gross average wages
The years covered do not coincide with the calendar years, as they start in the following months: 2000:
from the previous September, 2001-2003: from the previous July, 2004-2007: from the previous May.
CSO data is taken into account up to May of 2007.
Box 1–1 How do we estimate trend wage dynamics?
In this section, we shortly present our whitening-corrected wage dynamics estimates for data published since the May Report. We applied two methods: the first, industry-based method is the one presented in the May Report. The second is based on employment measured firm size. The results are similar in the two cases, which indicates the robustness of our estimates.
Industry-based estimation
Using the industry-based method, we drew the dynamics of regular wages in the sectors presumable going through the whitening process, based on their historical relation with non-whitening sectors, to a level consistent with the processes that took place previously, before the third quarter of last year (See Box 2-2 in the May Report). This provided us with corrected series in addition to the original, uncorrected wage series for all sectors where whitening is suspected.5
Weighting up the corrected wage levels provides us the adjusted wage level for the private sector. The ratio of the corrected and uncorrected wage level is referred to as the ‘whitening factor’. If it is lower in a period than it was in the previous one, it means that further whitening took place in wages. The chart below demonstrates that the whitening factor decreased more robustly during the third and fourth quarter of 2006, and to a lesser degree in the first quarter of 2007, meaning that the impact of whitening was gradually
decreasing. The 2007 Q2 factor is essentially the same as the previous one implying no additional whitening in this last quarter.
Chart 2-9 ‘Whitening factor’* Quarterly, seasonally adjusted data
97,5 98,0 98,5 99,0 99,5 100,0 100,5
06:Q1 06:Q2 06:Q3 06:Q4 07:Q1 07:Q2
Per cent
97,5 98,0 98,5 99,0 99,5 100,0 100,5 Per cent
Whitening factor industry based estimation Whitening factor employment based estimation
* Whitening-corrected wage levels as a percentage of the non-corrected levels. For seasonally adjusted, no-bonus wages for the industry-based method, and seasonally non-adjusted whole private sector wages for the employment based method.
In light of the annual growth rate of corrected and uncorrected regular wages we are to reconfirm the qualitative view we depicted in May: although unadjusted wage dynamics are likely to overshoot the ‘true’, unobserved rate, based on the adjusted index we conclude that the rate of wage growth did in fact increase since the second half of last year.
Chart 2-10 Private sector wages without bonuses: original and whitening-corrected series Year-on-year growth rates of seasonally adjusted quarterly series, in per cent
6 7 8 9 10 11 12
04:Q1 04:Q2 04:Q3 04:Q4 05:Q1 05:Q2 05:Q3 05:Q4 06:Q1 06:Q2 06:Q3 06:Q4 07:Q1 07:Q2
Per cent
6 7 8 9 10 11 Per cent12
Whitening corrected Original
Note: Original level: seasonally adjusted private sector wage level. Corrected level: product of the original level and the whitening factor. The figure plots yoy indices of the levels.
Since our forecast pertains to the full wages, including bonuses, we also need to have the corrected version of the whole private sector wage series. We assume that there is the same degree of whitening in the bonuses as in the case with regular wages.
Employment-based estimation
To asses the robustness of the above estimation, we carried out an alternative estimation of whitening.
Wage and employment data by firm size categories, measured by average number of employees, has been published since 2003 by the CSO.6 Looking at the figure below, one can assess that historically the whole private sector wage dynamics were below that of the no less than 20 employees sector. The difference between the two dynamics had been relatively constant. This historical relationship, however, has been reversed from 2006 Q3.
Chart 2-11 Wage dynamics for firms with no less than 20 employees and for the whole private sector Year-on-year growth rates of not seasonally adjusted quarterly data, in per cent
3 5 7 9 11 13 15
04:Q1 04:Q2 04:Q3 04:Q4 05:Q1 05:Q2 05:Q3 05:Q4 06:Q1 06:Q2 06:Q3 06:Q4 07:Q1 07:Q2
Per cent
3 5 7 9 11 13 15 Per cent
Whole private sector No less than 20 employees
Further analysis of the data reveals that the increase in wage dynamics in 2006 was mainly due to firms employing 5-19 employees. We cannot observe a similar phenomenon in the case of larger firms or only to a negligible extent.
We based our alternative estimation on these observations: we corrected the wage dynamics of the 5-19 employee sector so as the above explained historical difference in the dynamics was restored in the sample.
Then we weighted this corrected, 5-19 sector wage dynamics with the rest and obtained a corrected, private sector level series.
We calculated the whitening factor for this method in a similar manner as in the case of the industry-based estimation (see Chart 2-9). As one can see, the two factors do not differ significantly, so the results can be deemed as robust.
As for movements in the labour flows data, there is a great deal of uncertainty from the point of view of the economic cycle. Based on the first quarter, it appeared that in the private sector, and in particular in the services sector, companies attempted to partly counter the loss of profits by reducing the workforce. Although detailed second quarter data is not available yet, this is not supported by the national level data from the entire first half: both the rate of employment and activity appears stagnant, which casts a doubt as to how much a looser or tighter labour market could be of use for wage adjustments.
Chart 2-12 Unemployment, employment and participation rates*
5 6 7 8 9 10 11 12
95:Q1 95:Q3 96:Q1 96:Q3 97:Q1 97:Q3 98:Q1 98:Q3 99:Q1 99:Q3 00:Q1 00:Q3 01:Q1 01:Q3 02:Q1 02:Q3 03:Q1 03:Q3 04:Q1 04:Q3 05:Q1 05:Q3 06:Q1 06:Q3 07:Q1
Per cent
46 47 48 49 50 51 52 53 54 55 56Per cent
Unemployment rate (right scale) Employment rate Participation rate
* In share of working age population (15-74 years).
2. 6 Inflation developments in line with our expectations
In the second quarter of 2007, inflation trends were in line with our short-term forecast. Both quarterly and monthly data appear to support that trend inflation will settle within the 3%–5%
range. Having received price information for May we were able to clearly identify the turning point of inflation reaching its peak at 9 per cent in March.
Chart 2-13 Consumer price index and core inflation Year-on-year indices
0 1 2 3 4 5 6 7 8 9 10
Jan.02 Apr.02 July.02 Oct.02 Jan.03 Apr.03 July.03 Oct.03 Jan.04 Apr.04 July.04 Oct.04 Jan.05 Apr.05 July.05 Oct.05 Jan.06 Apr.06 July.06 Oct.06 jan.07 Apr.07 July.07
Per cent
0 1 2 3 4 5 6 7 8 9 10 Per cent
Consumer price index Core inflation
The decline in the year-on-year index of consumer prices is attributable to favourable developments in core inflation. This in turn was a consequence of the ongoing disinflation in the processed food category from a rather elevated rate.
Chart 2-14 Trend inflation* and processed food Seasonally adjusted, annualised monthly change
0 1 2 3 4 5 6 7 8 9 10
Jan.05 Mar.05 May.05 July.05 Sept.05 Nov.05 Jan.06 Mar.06 May.06 July.06 Sept.06 Nov.06 Jan.07 Mar.07 May.07 July.07
Per cent
-6 -3 0 3 6 9 12 15 18 21 Per cent 24
Trendinflation*; left scale
Processed food (VAT-change filtered); right scale
* Time series adjusted for VAT changes.
** Time series adjusted for VAT changes and visit fees.
Inflation in manufactured goods, by contrast, particularly that of non-durables was higher than expected in recent months. It is possible that this phenomenon is Hungary-specific: according to a potential interpretation, we are witnessing the correction of the strong disinflation in this product category after our accession to the European Union in 2004–2005, as prices of manufactured goods return to an equilibrium level after a period of restrained pricing behaviour. That said, the stronger-than-expected inflation of non-durables is also observable internationally, so it is also possible that the extra inflation is mostly imported. In the euro area the rise in the inflation rate of these items was followed by a decrease, which suggests that this effect was temporary.
As far as market services are concerned, the annual index is distorted by some one-off items (such as last year’s VAT increase and the medical visit fee); nevertheless, trend inflation has remained at its usual 6 per cent as seen over the past two years, which shows that the strong dynamics of unit labour costs seen in the services sector will not spill over – for the time being – to the prices of this sector.