toxins
Article
Interaction of 2 0 R-ochratoxin A with Serum
Albumins: Binding Site, Effects of Site Markers, Thermodynamics, Species Differences of
Albumin-binding, and Influence of Albumin on Its Toxicity in MDCK Cells
Zelma Faisal1,2, Diána Derdák2,3,4, Beáta Lemli2,3,4 ID, Sándor Kunsági-Máté2,3,4,
Mónika Bálint5, Csaba Hetényi5, Rita Csepregi2,6, Tamás K ˝oszegi2,6ID, Franziska Sueck7, Benedikt Cramer7 ID, Hans-Ulrich Humpf7 ID and Miklós Poór1,2,*
1 Department of Pharmacology, Faculty of Pharmacy, University of Pécs, Szigetiút 12, H-7624 Pécs, Hungary;
faisal.zelma@gytk.pte.hu
2 János Szentágothai Research Center, University of Pécs, Ifjúságútja 20, H-7624 Pécs, Hungary;
derdak.dia@gmail.com (D.D.); lemli.beata@gytk.pte.hu (B.L.); kunsagi-mate.sandor@gytk.pte.hu (S.K.-M.);
ritacsepregi93@gmail.com (R.C.); koszegi.tamas@pte.hu (T.K.)
3 Department of General and Physical Chemistry, University of Pécs, Ifjúságútja 6, H-7624 Pécs, Hungary
4 Department of Pharmaceutical Chemistry, Faculty of Pharmacy, University of Pécs, Rókus u. 2, H-7624 Pécs, Hungary
5 Department of Pharmacology and Pharmacotherapy, Medical School, University of Pécs, Szigetiút 12, H-7624 Pécs, Hungary; monibalint18@gmail.com (M.B.); csabahete@yahoo.com (C.H.)
6 Department of Laboratory Medicine, Medical School, University of Pécs, Ifjúságútja 13, H-7624 Pécs, Hungary
7 Institute of Food Chemistry, Westfälische Wilhelms-Universität Münster, Corrensstr. 45, 48149 Münster, Germany; f_suec01@uni-muenster.de (F.S.); cramerb@wwu.de (B.C.); humpf@wwu.de (H.-U.H.)
* Correspondence: poor.miklos@pte.hu; Tel.: +36-72-536-000 (ext. 31646)
Received: 18 July 2018; Accepted: 27 August 2018; Published: 1 September 2018
Abstract:Ochratoxin A (OTA) is a nephrotoxic mycotoxin. Roasting of OTA-contaminated coffee results in the formation of 20R-ochratoxin A (20R-OTA), which appears in the blood of coffee drinkers.
Human serum albumin (HSA) binds 20R-OTA (and OTA) with high affinity; therefore, albumin may influence the tissue uptake and elimination of ochratoxins. We aimed to investigate the binding site of 20R-OTA (verses OTA) in HSA and the displacing effects of site markers to explore which molecules can interfere with its albumin-binding. Affinity of 20R-OTA toward albumins from various species (human, bovine, porcine and rat) was tested to evaluate the interspecies differences regarding 20R-OTA-albumin interaction. Thermodynamic studies were performed to give a deeper insight into the molecular background of the complex formation. Besides fluorescence spectroscopic and modeling studies, effects of HSA, and fetal bovine serum on the cytotoxicity of 20R-OTA and OTA were tested in MDCK kidney cell line in order to demonstrate the influence of albumin-binding on the cellular uptake of ochratoxins. Site markers displaced more effectively 20R-OTA than OTA from HSA. Fluorescence and binding constants of 20R-OTA-albumin and OTA-albumin complexes showed different tendencies. Albumin significantly decreased the cytotoxicity of ochratoxins. 20R-OTA, even at sub-toxic concentrations, increased the toxic action of OTA.
Keywords: 20R-ochratoxin A; ochratoxin A; serum albumin; albumin-ligand interaction; species differences; cellular toxicity
Key Contribution: Albumin complexes of 20R-OTA and OTA show significant differences (e.g., fluorescence; binding constants and affinity to albumins from various species). Albumin significantly
Toxins2018,10, 353; doi:10.3390/toxins10090353 www.mdpi.com/journal/toxins
Toxins2018,10, 353 2 of 16
decreases the in vitro toxicity of 20R-OTA and OTA in MDCK kidney cell line; furthermore; even at sub-toxic concentrations; 20R-OTA increases the acute cellular toxicity of OTA; both in the absence and presence of fetal bovine serum.
1. Introduction
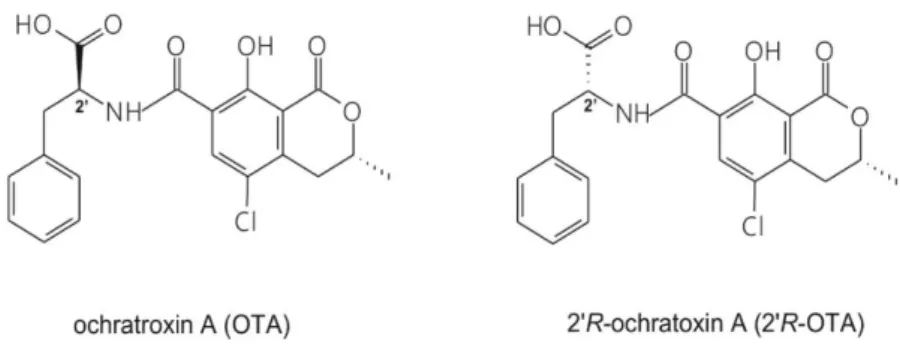
Ochratoxin A (OTA; Figure1) is a widespread mycotoxin produced byAspergillusandPenicillium species [1]. It is present in several foods and drinks, mainly in cereals and cereal products but also in coffee, beer, wine, spices and cocoa [2,3]. Due to its wide occurrence and high thermal stability [4,5], eradication of OTA from the food chain seems impossible. OTA is nephrotoxic, however, other toxic effects (e.g., carcinogenic, teratogenic and immunotoxic) have also been attributed to it. Chronic exposure to OTA may play a role in the development of Balkan Endemic Nephropathy (BEN) [6,7].
During the roasting process of OTA-contaminated coffee, its diastereomer, 20R-ochratoxin A (20R-OTA, previously called 14-(R)-OTA; Figure1) is formed (up to 26% of OTA can isomerize to 20R-OTA), which has been detected in the blood of coffee drinkers [8]. Both mycotoxins appear in the circulation at the lower ng/L range, the concentration of 20R-OTA may be even higher compared to OTA [9]. Based on in vitro studies, 20R-OTA exhibits a lower acute toxicity than OTA [8,10].
Toxins 2018, 10, x FOR PEER REVIEW 2 of 16
furthermore; even at sub-toxic concentrations; 2′R-OTA increases the acute cellular toxicity of OTA;
both in the absence and presence of fetal bovine serum.
1. Introduction
Ochratoxin A (OTA; Figure 1) is a widespread mycotoxin produced by Aspergillus and Penicillium species [1]. It is present in several foods and drinks, mainly in cereals and cereal products but also in coffee, beer, wine, spices and cocoa [2,3]. Due to its wide occurrence and high thermal stability [4,5], eradication of OTA from the food chain seems impossible. OTA is nephrotoxic, however, other toxic effects (e.g., carcinogenic, teratogenic and immunotoxic) have also been attributed to it. Chronic exposure to OTA may play a role in the development of Balkan Endemic Nephropathy (BEN) [6,7]. During the roasting process of OTA-contaminated coffee, its diastereomer, 2’R-ochratoxin A (2′R-OTA, previously called 14-(R)-OTA; Figure 1) is formed (up to 26% of OTA can isomerize to 2′R-OTA), which has been detected in the blood of coffee drinkers [8]. Both mycotoxins appear in the circulation at the lower ng/L range, the concentration of 2′R-OTA may be even higher compared to OTA [9]. Based on in vitro studies, 2′R-OTA exhibits a lower acute toxicity than OTA [8,10].
Figure 1. Chemical structures of the parent compound ochratoxin A (OTA) and its diastereomer 2’R- ochratoxin A (2′R-OTA).
Albumin is the most abundant plasma protein in the circulation, which maintains the oncotic pressure of blood and has buffering, antioxidant, as well as pseudo-enzymatic functions [11].
Albumin interacts with several endogenous and exogenous molecules and may significantly affect the pharmacokinetics/toxicokinetics of these compounds, due to modulation of their tissue distribution and elimination [11,12]. Sudlow’s Site I (in subdomain IIA) and Site II (in subdomain IIIA) are the major drug binding sites of human serum albumin (HSA) [11]. However, recent studies demonstrated the important role of the Heme binding site in subdomain IB [13]. Several mycotoxins form stable complexes with albumin, including aflatoxins, citrinin, ochratoxins, and zearalenone [14–
18]. Interestingly, OTA forms a highly stable complex with HSA, leading to its extremely high plasma protein binding (99.8%), and long plasma elimination half-life (approximately one month) in humans [19,20]. The primary binding site of OTA is located in Sudlow’s Site I on HSA, where ionic interactions of the dianionic OTA (containing deprotonated carboxyl and phenolic hydroxyl groups) with two arginine moieties (R222 and R257) further stabilize the complex [21,22]. Furthermore, unusually large species differences in OTA-albumin interaction have been observed: The stability of OTA-HSA complex is approximately tenfold, and 30-fold higher respectively than the stabilities of OTA complexes formed with bovine and rat albumins [6,17]. 2′R-OTA binds to HSA with approximately a tenfold lower affinity than OTA [23]. Despite its lower affinity, the 2′R-OTA-HSA complex is very stable: The biding constant of this complex (K = 2 × 10⁶ L/mol) is tenfold higher compared to citrinin- HSA (K = 2 × 10⁵ L/mol) or zearalenone-HSA (K = 105 L/mol) complexes [15,18,23], and 100-fold higher than that of aflatoxin-HSA complexes [14]. Similarly to OTA, 2′R-OTA occupies the Sudlow’s Site I as its high-affinity binding site on HSA, close to Trp-214, which allows energy transfer between HSA and the albumin-bound 2′R-OTA molecule [23]. Since 2′R-OTA also forms very stable complexes with
Figure 1. Chemical structures of the parent compound ochratoxin A (OTA) and its diastereomer 20R-ochratoxin A (20R-OTA).
Albumin is the most abundant plasma protein in the circulation, which maintains the oncotic pressure of blood and has buffering, antioxidant, as well as pseudo-enzymatic functions [11].
Albumin interacts with several endogenous and exogenous molecules and may significantly affect the pharmacokinetics/toxicokinetics of these compounds, due to modulation of their tissue distribution and elimination [11,12]. Sudlow’s Site I (in subdomain IIA) and Site II (in subdomain IIIA) are the major drug binding sites of human serum albumin (HSA) [11]. However, recent studies demonstrated the important role of the Heme binding site in subdomain IB [13]. Several mycotoxins form stable complexes with albumin, including aflatoxins, citrinin, ochratoxins, and zearalenone [14–18].
Interestingly, OTA forms a highly stable complex with HSA, leading to its extremely high plasma protein binding (99.8%), and long plasma elimination half-life (approximately one month) in humans [19,20]. The primary binding site of OTA is located in Sudlow’s Site I on HSA, where ionic interactions of the dianionic OTA (containing deprotonated carboxyl and phenolic hydroxyl groups) with two arginine moieties (R222 and R257) further stabilize the complex [21,22]. Furthermore, unusually large species differences in OTA-albumin interaction have been observed: The stability of OTA-HSA complex is approximately tenfold, and 30-fold higher respectively than the stabilities of OTA complexes formed with bovine and rat albumins [6,17]. 20R-OTA binds to HSA with approximately a tenfold lower affinity than OTA [23]. Despite its lower affinity, the 20R-OTA-HSA complex is very stable:
The biding constant of this complex (K= 2×10⁶L/mol) is tenfold higher compared to citrinin-HSA (K= 2×10⁵L/mol) or zearalenone-HSA (K= 105L/mol) complexes [15,18,23], and 100-fold higher
Toxins2018,10, 353 3 of 16
than that of aflatoxin-HSA complexes [14]. Similarly to OTA, 20R-OTA occupies the Sudlow’s Site I as its high-affinity binding site on HSA, close to Trp-214, which allows energy transfer between HSA and the albumin-bound 20R-OTA molecule [23]. Since 20R-OTA also forms very stable complexes with albumin and albumin-binding strongly influences the toxicokinetics of OTA, the deeper understanding of 20R-OTA-albumin complex formation is desired.
In this study, further aspects of 20R-OTA-albumin interactions were examined (and compared with OTA-albumin complexation), including effects of site markers on the albumin-binding of 20R-OTA, thermodynamics of 20R-OTA-HSA complex formation, species differences of its albumin binding (human, bovine, porcine and rat albumins were tested), and influence of albumin on the acute cellular toxicity of 20R-OTA, in the absence and presence of the parent compound OTA. Thermodynamic and modeling studies give a deeper insight into the physicochemical background of the complex formation. Displacement of 20R-OTA from albumin may strongly influence the elimination half-life and/or tissue distribution of the mycotoxin. The effect of site markers on the albumin-binding of 20R-OTA demonstrates which type of molecules are able to disrupt the albumin-binding of 20R-OTA.
The significant interspecies differences regarding the elimination half-life of OTA is mainly attributed to its different binding affinity toward albumins from various species [6,19]. Therefore, investigation of the complex formation of 20R-OTA with albumins from different species is reasonable. It may also help to estimate how effectively we can extrapolate the results of animal studies to humans. Furthermore, we aimed to test in cell experiments the hypothesis that high binding constants of 20R-OTA-albumin complexes result in the entrapment of 20R-OTA in the cell medium, leading to the poor cellular uptake and the decreased in vitro toxicity of the mycotoxin. We demonstrate that albumin significantly alleviate the cytotoxicity of 20R-OTA (and OTA) in MDCK cell line. Finally, we aimed to investigate the influence of 20R-OTA on the cytotoxicity of OTA in the absence and presence of albumin. This study highlights, when simultaneously present 20R-OTA with OTA, 20R-OTA can increase the OTA-induced loss of cell viability despite its relatively lower toxicity.
2. Results and Discussion
2.1. Binding of 20R-OTA and OTA to HSA Based on Modeling Studies
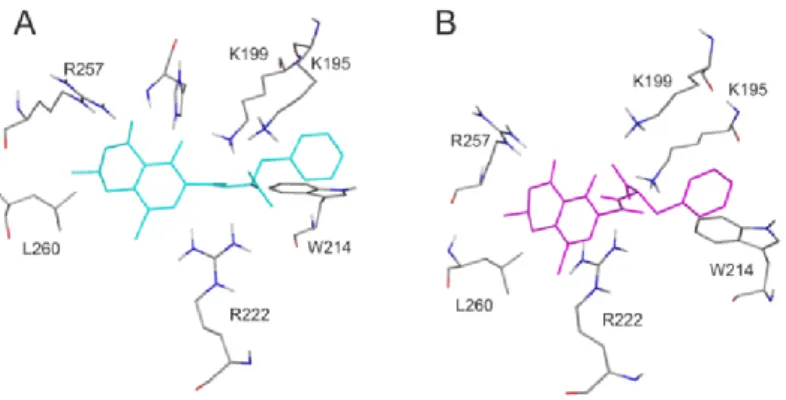
For the deeper insight into the binding position of 20R-OTA in HSA (compared to OTA), modeling studies have been performed. As previous studies demonstrated, OTA is present in both monoanionic (OTA−) and dianionic (OTA2−) forms at physiological pH [24–26]. However, in the human circulation, OTA-is rapidly deprotonated by HSA resulting in the formation of an ion pair by its dianionic form with two arginine moieties of HSA (R222 and R257) [21]. The deprotonation step implies structural modifications both on HSA and the ligand molecule. Since this mechanism is a dynamic process, such modifications cannot be reliably captured with static docking calculations. Using the apo structure of HSA, docking calculations with AutoDock 4 resulted in relevant structural information about the formation of OTA−-HSA complex (initial stage), while experimental analysis provides information regarding OTA2−-HSA complex (final stage). The location of OTA binding site on albumin has been proposed by both computational [23,27] and experimental studies [22]. Our docking calculations focused on the previously reported binding site (Figure2A), to investigate the differences in the binding mode between 20R- and 20S-OTA diastereomers (Figure2B). After docking calculations, multiple ranks were obtained, but only the best ranked ligand conformation was selected for further discussions.
Based on these calculations, OTA−has the same orientation and binding conformation as the previously observed binding mode [27]. The oxygen atoms of the carbonyl and phenolic hydroxyl groups orient towards R257, while the carboxylic group towards amino acid R222 (Figure3A). Interaction with R222, as an important amino acid that stabilizes 20R-OTA-HSA complex, has been described in a recent computational molecular dynamics study as well [23]. A strongπ-stacking with W214 was also observed for monoanionic and dianionic OTA (Figures3A and4A) and for dianionic 20R-OTA (Figure4B). During the complex formation of monoanionic 20R-OTA with HSA,π-stacking interaction
Toxins2018,10, 353 4 of 16
of 20R-OTA−with Y150 was noticed (Figure3B). Therefore,π-stacking between the phenyl group and W214 is not possible due to the switch of the phenyl group towards Y150. Therefore, the carboxylic moiety of 20R-OTA−also changes orientation, resulting in a weaker hydrogen bond with R222 and the absence of the interaction with K195 (Figure3B); the latter was proposed to be among the residues that play an important role in stabilizing the phenyl ring [22]. The above listed differences between initial binding conformations of 20R- and 20S-OTA may provide a structural basis of the differences in experimental logKvalues described [23].
Toxins 2018, 10, x FOR PEER REVIEW 4 of 16
The above listed differences between initial binding conformations of 2’R- and 2’S-OTA may provide a structural basis of the differences in experimental logK values described [23].
Figure 2. Binding site and position of 2′R-OTA verses OTA in Human serum albumin (HSA). (A) HSA is represented with grey cartoon, and ligand conformation bound to Sudlow’s Site I are orange (2′R- OTA−) and green (2’S-OTA−). (B) The binding differences observed between 2′R-OTA− (orange) and 2’S-OTA− (green). The ligands are represented with colored thin sticks, while the protein binding site with grey cartoon. Hydrogen atoms of the docked ligand conformations are not presented.
Figure 3. Interaction of monoanionic forms of OTA and 2′R-OTA with HSA. Amino acids of HSA (grey sticks) are presented with the docked conformation of 2’S-OTA− (green sticks; A) and 2′R-OTA− (orange sticks; B). Hydrogen atoms of the docked ligand conformations are not presented.
Figure 4. Interaction of dianionic forms of OTA and 2′R-OTA with HSA. Amino acids of HSA (grey sticks) are presented with the docked conformation of 2’S-OTA2− (cyan sticks; A) and 2′R-OTA2−
(magenta sticks; B). Hydrogen atoms of the docked ligand conformations are not presented.
2.2. Effects of Site Markers on 2′R-OTA-HSA and OTA-HSA Interactions
Figure 2. Binding site and position of 20R-OTA verses OTA in Human serum albumin (HSA). (A) HSA is represented with grey cartoon, and ligand conformation bound to Sudlow’s Site I are orange (20R-OTA−) and green (20S-OTA−). (B) The binding differences observed between 20R-OTA−(orange) and 20S-OTA−(green). The ligands are represented with colored thin sticks, while the protein binding site with grey cartoon. Hydrogen atoms of the docked ligand conformations are not presented.
Toxins 2018, 10, x FOR PEER REVIEW 4 of 16
The above listed differences between initial binding conformations of 2’R- and 2’S-OTA may provide a structural basis of the differences in experimental logK values described [23].
Figure 2. Binding site and position of 2′R-OTA verses OTA in Human serum albumin (HSA). (A) HSA is represented with grey cartoon, and ligand conformation bound to Sudlow’s Site I are orange (2′R- OTA−) and green (2’S-OTA−). (B) The binding differences observed between 2′R-OTA− (orange) and 2’S-OTA− (green). The ligands are represented with colored thin sticks, while the protein binding site with grey cartoon. Hydrogen atoms of the docked ligand conformations are not presented.
Figure 3. Interaction of monoanionic forms of OTA and 2′R-OTA with HSA. Amino acids of HSA (grey sticks) are presented with the docked conformation of 2’S-OTA− (green sticks; A) and 2′R-OTA− (orange sticks; B). Hydrogen atoms of the docked ligand conformations are not presented.
Figure 4. Interaction of dianionic forms of OTA and 2′R-OTA with HSA. Amino acids of HSA (grey sticks) are presented with the docked conformation of 2’S-OTA2− (cyan sticks; A) and 2′R-OTA2−
(magenta sticks; B). Hydrogen atoms of the docked ligand conformations are not presented.
2.2. Effects of Site Markers on 2′R-OTA-HSA and OTA-HSA Interactions
Figure 3. Interaction of monoanionic forms of OTA and 20R-OTA with HSA. Amino acids of HSA (grey sticks) are presented with the docked conformation of 20S-OTA−(green sticks;A) and 20R-OTA− (orange sticks;B). Hydrogen atoms of the docked ligand conformations are not presented.
Toxins2018,10, 353 5 of 16
Toxins 2018, 10, x FOR PEER REVIEW 4 of 16
The above listed differences between initial binding conformations of 2’R- and 2’S-OTA may provide a structural basis of the differences in experimental logK values described [23].
Figure 2. Binding site and position of 2′R-OTA verses OTA in Human serum albumin (HSA). (A) HSA is represented with grey cartoon, and ligand conformation bound to Sudlow’s Site I are orange (2′R- OTA−) and green (2’S-OTA−). (B) The binding differences observed between 2′R-OTA− (orange) and 2’S-OTA− (green). The ligands are represented with colored thin sticks, while the protein binding site with grey cartoon. Hydrogen atoms of the docked ligand conformations are not presented.
Figure 3. Interaction of monoanionic forms of OTA and 2′R-OTA with HSA. Amino acids of HSA (grey sticks) are presented with the docked conformation of 2’S-OTA− (green sticks; A) and 2′R-OTA− (orange sticks; B). Hydrogen atoms of the docked ligand conformations are not presented.
Figure 4. Interaction of dianionic forms of OTA and 2′R-OTA with HSA. Amino acids of HSA (grey sticks) are presented with the docked conformation of 2’S-OTA2− (cyan sticks; A) and 2′R-OTA2−
(magenta sticks; B). Hydrogen atoms of the docked ligand conformations are not presented.
2.2. Effects of Site Markers on 2′R-OTA-HSA and OTA-HSA Interactions
Figure 4.Interaction of dianionic forms of OTA and 20R-OTA with HSA. Amino acids of HSA (grey sticks) are presented with the docked conformation of 20S-OTA2−(cyan sticks;A) and 20R-OTA2−
(magenta sticks;B). Hydrogen atoms of the docked ligand conformations are not presented.
2.2. Effects of Site Markers on 20R-OTA-HSA and OTA-HSA Interactions
Displacement of 20R-OTA and OTA from HSA was investigated by fluorescence anisotropy in the presence of site markers. Site markers are ligand molecules occupying known and well-characterized binding sites in a protein (e.g., HSA). Therefore, site markers are commonly used compounds during the investigation of protein-ligand interactions. The displacement of a ligand molecule by a site marker demonstrates their competitive or allosteric interaction. Site markers can help to find the binding sites of ligand molecules and highlight which molecules are able to displace the test ligand from the protein. As it has been demonstrated, fluorescence polarization and anisotropy are suitable techniques to follow the complex formation of ochratoxins with albumin, including the displacement of ochratoxins from HSA by other compounds [15,23,24,28]. Site markers of Sudlow’s Site I (warfarin, furosemide and phenylbutazone), Sudlow’s Site II (ibuprofen) and Heme binding site (methyl orange and bilirubin) were applied to investigate their influence on the albumin-binding of ochratoxins [11,13].
In these experiments, anisotropy measurements were performed in PBS (pH 7.4), in the presence of ochratoxins and HSA (1.0 and 1.5µM, respectively) with and without the site markers (0–30µM;
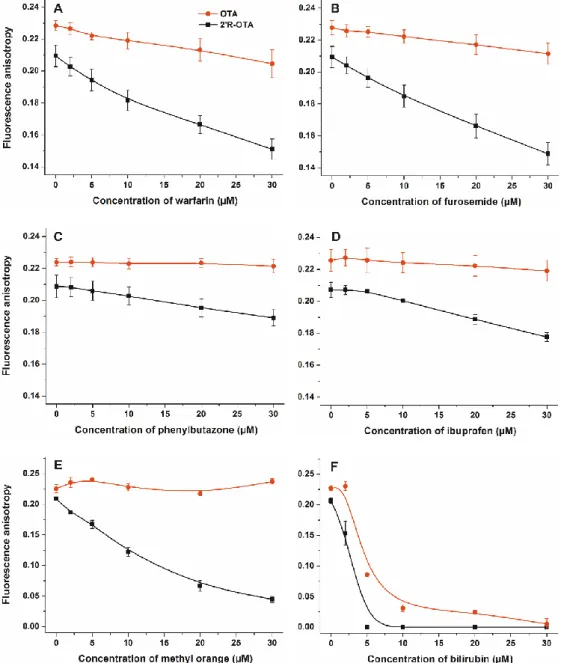
λex= 394 nm,λem= 447 nm). As Figure5demonstrates, each site marker induced stronger decrease in the anisotropy value of 20R-OTA compared to OTA. Fluorescence anisotropy gives information regarding the rotational freedom of fluorophores. The decreased anisotropy values of ochratoxins resulted from the increase of their rotational freedom, suggesting displacement of the mycotoxin from HSA [15,28]. These results support the previous observation that 20R-OTA binds to HSA with much lower affinity than OTA [23]. Interestingly, each site marker induced some displacement of 20R-OTA from HSA. Modeling studies and the energy transfer between Trp-214 residue of HSA and ochratoxins demonstrated that, similarly to OTA, 20R-OTA occupies Sudlow’s Site I on HSA, as its high-affinity binding site [23]. However, the observation that other site markers displaced 20R-OTA (and/or OTA) from albumin is not surprising, as these ligand molecules can allosterically modulate the complex formation. Site markers of Sudlow’s Site I (subdomain IIA) can competitively displace ochratoxins from albumin; however, because of the extremely high affinity of OTA towards HSA only slight displacement occurred (Figure5A–C). Despite the lower stability of 20R-OTA-HSA compared to that of the OTA-HSA complex, the binding constant of 20R-OTA-HSA complex is very high (K ~ 2× 10⁶ L/mol) [23].
Warfarin and furosemide produced strong displacement of 20R-OTA from HSA (Figure5A,B), whereas phenylbutazone induced a slight displacement (Figure5C). Despite ibuprofen being one of the most commonly applied marker of Sudlow’s Site II (subdomain IIIA), we have demonstrated that high concentrations of ibuprofen can displace OTA from HSA [24]. Ibuprofen binds to HSA with comparable affinity to 20R-OTA [12,23], however, it induced only slight displacement (Figure5D), which also supports the allosteric nature of the interaction. Site markers of the Heme binding site (subdomain IB) induced the most significant displacement of 20R-OTA from HSA (Figure5E,F). This can be explained
Toxins2018,10, 353 6 of 16
by the fact that the Heme binding site is allosterically coupled with the Sudlow’s Site I [11], therefore, it is reasonable to hypothesize that binding of methyl orange and bilirubin to subdomain IB induces structural changes on subdomain IIA, resulting in the significant decrease in the binding affinity of 20R-OTA toward HSA. Furthermore, methyl orange binds with much lower affinity to HSA than bilirubin [13,29], which is also in agreement with our observation that bilirubin has stronger influence on the albumin-binding of 20R-OTA. These results emphasize that, besides Sudlow’s Site I ligands, ligands of the Heme binding site can significantly interfere with the albumin-binding of ochratoxins, which has not been reported, to the best of our knowledge.Toxins 2018, 10, x FOR PEER REVIEW 6 of 16
Figure 5. Fluorescence anisotropy values of mycotoxin-HSA complexes (1 µ M OTA or 2′R-OTA and 1.5 µ M HSA) in the presence of increasing concentrations of site markers (0–30 µ M) in PBS (pH 7.4) ((A):warfarin, (B) furosemide, (C) phenylbutazone, (D) ibuprofen, € methyl orange, and (F) bilirubin;
λex = 394 nm, λem = 447 nm).
2.3. Thermodynamics of 2′R-OTA-HSA Interaction
Since thermodynamic data give a deeper insight into the nature of protein-ligand interactions (including binding forces are involved in the complex formation) [30], the binding ability of 2′R-OTA towards HSA was also examined at different temperatures. According to the van’t Hoff equation (Equation (2)), the logK values expressed as the function of the appropriate reciprocal temperatures show good linearity (Figure 6). The ΔG values suggest a non-covalent spontaneous interaction of 2′R- OTA with HSA at room-temperature (−39.04 kJ mol−1). Our results suggest that formation of 2′R-OTA- HSA complex is an entropy-driven process, where smaller enthalpy change is associated with higher entropy gain (in agreement with the known enthalpy-entropy compensation). Furthermore, based on the description of Ross and Subramanian [30], the negative enthalpy change with the positive entropy change suggest the importance of electrostatic forces in stabilization of the formed complexes.
Figure 5.Fluorescence anisotropy values of mycotoxin-HSA complexes (1µM OTA or 20R-OTA and 1.5µM HSA) in the presence of increasing concentrations of site markers (0–30µM) in PBS (pH 7.4) ((A):warfarin, (B) furosemide, (C) phenylbutazone, (D) ibuprofen, (E) methyl orange, and (F) bilirubin;
λex= 394 nm,λem= 447 nm).
Toxins2018,10, 353 7 of 16
2.3. Thermodynamics of 20R-OTA-HSA Interaction
Since thermodynamic data give a deeper insight into the nature of protein-ligand interactions (including binding forces are involved in the complex formation) [30], the binding ability of 20R-OTA towards HSA was also examined at different temperatures. According to the van’t Hoff equation (Equation (2)), the logKvalues expressed as the function of the appropriate reciprocal temperatures show good linearity (Figure6). The∆Gvalues suggest a non-covalent spontaneous interaction of 20R-OTA with HSA at room-temperature (−39.04 kJ mol−1). Our results suggest that formation of 20R-OTA-HSA complex is an entropy-driven process, where smaller enthalpy change is associated with higher entropy gain (in agreement with the known enthalpy-entropy compensation). Furthermore, based on the description of Ross and Subramanian [30], the negative enthalpy change with the positive entropy change suggest the importance of electrostatic forces in stabilization of the formed complexes.
Toxins 2018, 10, x FOR PEER REVIEW 7 of 16
Figure 6. The van’t Hoff plot and thermodynamic parameters of 2′R-OTA-HSA complex formation.
2.4. Effects of Human, Bovine, Porcine and Rat Albumins on the Fluorescence Emission Spectra of 2′R-OTA and OTA
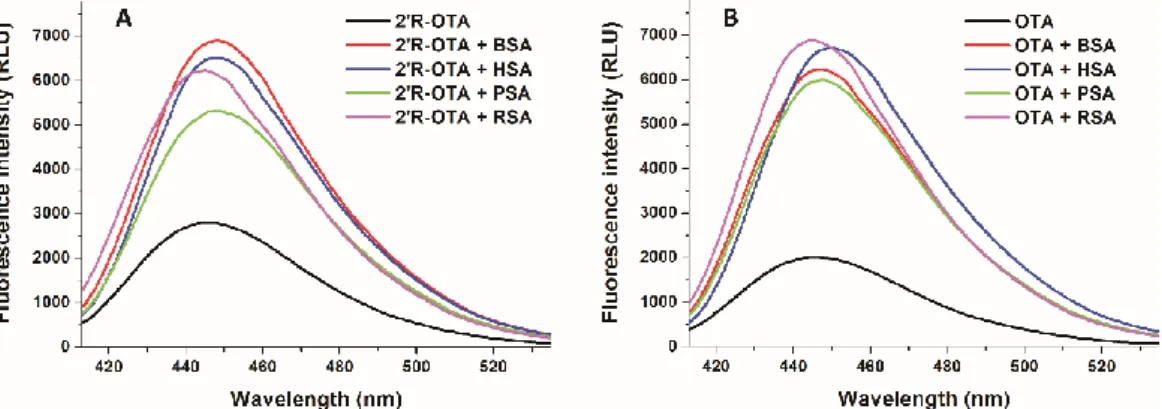
Since ochratoxins exhibit strong intrinsic fluorescence, molecular interactions of ochratoxins with albumin can be precisely followed by fluorescence spectroscopy [23,24]. Isomers can bind to the same protein with different affinity; therefore, it is reasonable to hypothesize that the fluorescence enhancement of 2′R-OTA and OTA by albumins may also show some differences. To test this hypothesis, the fluorescence emission spectra of 2′R-OTA (Figure 7A) and OTA (Figure 7B) were recorded in the absence and presence of albumins from different species, including human (HSA), bovine (BSA), porcine (PSA), and rat (RSA) serum albumins (λex = 394 nm). Under the applied conditions, albumins gave negligible fluorescence emission signal at 447 nm. As Figure 7 demonstrates that each albumin caused significant increase in the fluorescence signal of ochratoxins, and slight changes in the emission wavelength maxima were observed as well. Interestingly, the fluorescence enhancement of ochratoxins by albumins from the other species showed different tendencies. The weakest increase in fluorescence was induced by PSA for both ochratoxins. However, 2′R-OTA showed the highest emission signal with BSA, whereas among the OTA-albumin complexes OTA-RSA complex expressed the highest fluorescence. Fluorescence enhancement (I/I0 values) of 2′R- OTA by albumins are demonstrated in Table 1.
Figure 7. Fluorescence emission spectra of 2′R-OTA (A; 1 µ M) and OTA (B; 1 µ M) in the absence and presence of albumins from different species (each 5 µ M) in PBS (λex= 394 nm, λem = 447 nm; BSA, bovine serum albumin; HSA, human serum albumin; PSA, porcine serum albumin; RSA, rat serum albumin).
Figure 6.The van’t Hoff plot and thermodynamic parameters of 20R-OTA-HSA complex formation.
2.4. Effects of Human, Bovine, Porcine and Rat Albumins on the Fluorescence Emission Spectra of 20R-OTA and OTA
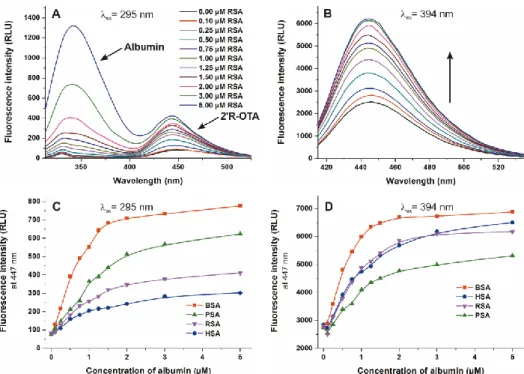
Since ochratoxins exhibit strong intrinsic fluorescence, molecular interactions of ochratoxins with albumin can be precisely followed by fluorescence spectroscopy [23,24]. Isomers can bind to the same protein with different affinity; therefore, it is reasonable to hypothesize that the fluorescence enhancement of 20R-OTA and OTA by albumins may also show some differences. To test this hypothesis, the fluorescence emission spectra of 20R-OTA (Figure 7A) and OTA (Figure7B) were recorded in the absence and presence of albumins from different species, including human (HSA), bovine (BSA), porcine (PSA), and rat (RSA) serum albumins (λex = 394 nm). Under the applied conditions, albumins gave negligible fluorescence emission signal at 447 nm. As Figure7demonstrates that each albumin caused significant increase in the fluorescence signal of ochratoxins, and slight changes in the emission wavelength maxima were observed as well. Interestingly, the fluorescence enhancement of ochratoxins by albumins from the other species showed different tendencies.
The weakest increase in fluorescence was induced by PSA for both ochratoxins. However, 20R-OTA showed the highest emission signal with BSA, whereas among the OTA-albumin complexes OTA-RSA complex expressed the highest fluorescence. Fluorescence enhancement (I/I0values) of 20R-OTA by albumins are demonstrated in Table1.
Toxins2018,10, 353 8 of 16
Toxins 2018, 10, x FOR PEER REVIEW 7 of 16
Figure 6. The van’t Hoff plot and thermodynamic parameters of 2′R-OTA-HSA complex formation.
2.4. Effects of Human, Bovine, Porcine and Rat Albumins on the Fluorescence Emission Spectra of 2′R-OTA and OTA
Since ochratoxins exhibit strong intrinsic fluorescence, molecular interactions of ochratoxins with albumin can be precisely followed by fluorescence spectroscopy [23,24]. Isomers can bind to the same protein with different affinity; therefore, it is reasonable to hypothesize that the fluorescence enhancement of 2′R-OTA and OTA by albumins may also show some differences. To test this hypothesis, the fluorescence emission spectra of 2′R-OTA (Figure 7A) and OTA (Figure 7B) were recorded in the absence and presence of albumins from different species, including human (HSA), bovine (BSA), porcine (PSA), and rat (RSA) serum albumins (λex = 394 nm). Under the applied conditions, albumins gave negligible fluorescence emission signal at 447 nm. As Figure 7 demonstrates that each albumin caused significant increase in the fluorescence signal of ochratoxins, and slight changes in the emission wavelength maxima were observed as well. Interestingly, the fluorescence enhancement of ochratoxins by albumins from the other species showed different tendencies. The weakest increase in fluorescence was induced by PSA for both ochratoxins. However, 2′R-OTA showed the highest emission signal with BSA, whereas among the OTA-albumin complexes OTA-RSA complex expressed the highest fluorescence. Fluorescence enhancement (I/I0 values) of 2′R- OTA by albumins are demonstrated in Table 1.
Figure 7. Fluorescence emission spectra of 2′R-OTA (A; 1 µ M) and OTA (B; 1 µ M) in the absence and presence of albumins from different species (each 5 µ M) in PBS (λex = 394 nm, λem = 447 nm; BSA, bovine serum albumin; HSA, human serum albumin; PSA, porcine serum albumin; RSA, rat serum albumin).
Figure 7.Fluorescence emission spectra of 20R-OTA (A; 1µM) and OTA (B; 1µM) in the absence and presence of albumins from different species (each 5µM) in PBS (λex= 394 nm,λem= 447 nm; BSA, bovine serum albumin; HSA, human serum albumin; PSA, porcine serum albumin; RSA, rat serum albumin).
Table 1. Enhancement of the fluorescence of 20R-OTA by complex formation with albumins from different species (human, bovine, porcine and rat).
Mycotoxin-Albumin Complex I/I0(±SD) (λex= 394 nm,λem= 447 nm)
20R-OTA-HSA 2.35±0.07
20R-OTA-BSA 2.48±0.06
20R-OTA-PSA 1.98±0.05
20R-OTA-RSA 2.22±0.09
2.5. Binding Constants of 20R-OTA-albumin Complexes
Considering the previously published observations that the stability of OTA-albumin complexes show unusually large species differences [6,19], we aimed to evaluate the interaction of 20R-OTA with human, bovine, porcine, and rat serum albumins. To determine the binding constants (K) of 20R-OTA-albumin complexes, which demonstrates the stability of the formed complexes, the fluorescence emission spectra of 20R-OTA (1µM) were recorded in presence of increasing albumin concentrations (0–5µM) in PBS (pH 7.4), using 295 nm (excitation of albumin) and 394 nm (excitation of 20R-OTA) excitation wavelengths. Since the binding site of 20R-OTA is located in Sudlow’s Site I (which is very close to the tryptophan amino acid in albumins), excitation of samples at 295 nm results in energy transfer between albumin and ochratoxins, and consequently the selective excitation of albumin-bound 20R-OTA molecules [23,31]. However, excitation of the same samples at 394 nm leads to the excitation of both free and albumin-bound 20R-OTA [23,24]. Figure8demonstrates the emission spectra and signals at both applied wavelengths. Using 295 nm as excitation wavelength, two emission peaks with their maxima approximately at 340 and 447 nm are observed. The first peak is the emission signal of albumin while the second peak is the fluorescence signal of albumin-bound 20R-OTA (Figure8A) [23]. Using 394 nm as excitation wavelength, the gradual increase in fluorescence at 447 nm can be observed in presence of albumins at increasing concentration (Figure8B), due to the fluorescence enhancement of 20R-OTA by albumins (Figure7A). Binding constants of 20R-OTA-albumin complexes were determined by the Hyperquad program, based on the fluorescence intensities measured at 447 nm (Figure8C,D).
Toxins2018,10, 353 9 of 16
Toxins 2018, 10, x FOR PEER REVIEW 9 of 16
Figure 8. Fluorescence emission spectra of 2′R-OTA (1 µ M) in presence of increasing concentrations of RSA (0–5 µ M) in PBS (pH 7.4), using 295 nm ((A) ex. slit: 5 nm, em. slit: 5 nm) and 394 nm ((B) ex.
slit: 5 nm, em. slit: 10 nm) excitation wavelengths. Fluorescence emission intensity of 2′R-OTA (1 µ M) at 447 nm in the presence of increasing albumin concentrations (0–5 µ M) using 295 nm (C) and 394 nm (D) excitation wavelengths.
Table 2 demonstrates the decimal logarithmic values of the binding constants (K, unit: L/mol) of 2′R-OTA-albumin complexes. Despite OTA shows very large differences in binding affinity for albumins from different species [17,32], we did not observe such discrepancy of 2′R-OTA-albumin complexes. Both evaluations (using 295 nm or 394 nm as excitation wavelengths) suggest that 2′R- OTA binds to BSA and RSA with approximately 2–3 times higher affinity than to HSA and PSA, unlike OTA which showed the following affinity order in previous investigations: Human > bovine >
porcine > rat [17,32]. Experiments using two excitation wavelengths to generate the emission spectra yielded some differences in the binding constants (Table 2). Using 295 nm as excitation wavelength, a slight spectral shift occurred in the peak associated with the 2′R-OTA molecule (Figure 8A,B).
Therefore, it is reasonable to hypothesize that during the energy transfer from albumins to 2′R-OTA, a different orbital of 2′R-OTA is excited than during the direct excitation of the mycotoxin at 394 nm.
As a result, a weaker enhancement of emission intensity was obtained, providing a slightly weaker complex stability.
Table 2. Decimal logarithmic values of binding constants (K, unit: L/mol) of 2′R-OTA-albumin complexes. LogK values were determined based on emission spectra of 2′R-OTA, recorded at 295 and 394 nm as excitation wavelengths.
Mycotoxin-Albumin Complex
logK (± SD)
(λex = 295 nm, λem = 447 nm)
logK (±SD)
(λex = 394 nm, λem = 447 nm)
2′R-OTA-HSA 6.28 ± 0.05 6.64 ± 0.10
2′R-OTA-BSA 6.67 ± 0.07 7.32 ± 0.06
2′R-OTA-PSA 6.21 ± 0.09 6.84 ± 0.12
2′R-OTA-RSA 6.45 ± 0.03 7.19 ± 0.21
Figure 8.Fluorescence emission spectra of 20R-OTA (1µM) in presence of increasing concentrations of RSA (0–5µM) in PBS (pH 7.4), using 295 nm ((A) ex. slit: 5 nm, em. slit: 5 nm) and 394 nm ((B) ex. slit:
5 nm, em. slit: 10 nm) excitation wavelengths. Fluorescence emission intensity of 20R-OTA (1µM) at 447 nm in the presence of increasing albumin concentrations (0–5µM) using 295 nm (C) and 394 nm (D) excitation wavelengths.
Table2demonstrates the decimal logarithmic values of the binding constants (K, unit: L/mol) of 20R-OTA-albumin complexes. Despite OTA shows very large differences in binding affinity for albumins from different species [17,32], we did not observe such discrepancy of 20R-OTA-albumin complexes. Both evaluations (using 295 nm or 394 nm as excitation wavelengths) suggest that 20R-OTA binds to BSA and RSA with approximately 2–3 times higher affinity than to HSA and PSA, unlike OTA which showed the following affinity order in previous investigations: Human > bovine > porcine >
rat [17,32]. Experiments using two excitation wavelengths to generate the emission spectra yielded some differences in the binding constants (Table2). Using 295 nm as excitation wavelength, a slight spectral shift occurred in the peak associated with the 20R-OTA molecule (Figure8A,B). Therefore, it is reasonable to hypothesize that during the energy transfer from albumins to 20R-OTA, a different orbital of 20R-OTA is excited than during the direct excitation of the mycotoxin at 394 nm. As a result, a weaker enhancement of emission intensity was obtained, providing a slightly weaker complex stability.
Table 2. Decimal logarithmic values of binding constants (K, unit: L/mol) of 20R-OTA-albumin complexes. LogKvalues were determined based on emission spectra of 20R-OTA, recorded at 295 and 394 nm as excitation wavelengths.
Mycotoxin-Albumin Complex logK(±SD) (λex= 295 nm,λem= 447 nm)
logK(±SD) (λex= 394 nm,λem= 447 nm)
20R-OTA-HSA 6.28±0.05 6.64±0.10
20R-OTA-BSA 6.67±0.07 7.32±0.06
20R-OTA-PSA 6.21±0.09 6.84±0.12
20R-OTA-RSA 6.45±0.03 7.19±0.21
Toxins2018,10, 353 10 of 16
2.6. Effects of Albumin on the In Vitro Toxicity of 20R-OTA and OTA in MDCK Cell Line
Similarly to OTA, 20R-OTA also forms very stable complexes with albumins (Table2). Therefore, it was reasonable to hypothesize that the presence of albumin may decrease the 20R-OTA-induced toxicity in cell experiments, due to the entrapment of the mycotoxin in the cell medium by albumin.
To test the influence of albumin on the in vitro effects of ochratoxins, the acute cellular toxicity of 20R-OTA and OTA was investigated in the absence and presence of HSA and fetal bovine serum (FBS).
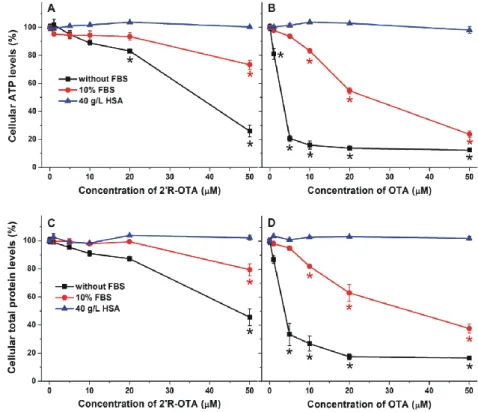
MDCK kidney cells were treated with the mycotoxins at increasing concentrations (0–50µM) for 24 h with and without 10% FBS or 40 g/L HSA. Ten percent FBS is commonly used in cell culture media (it yields approximately 3.5 g/L final concentration of BSA) in cell experiments, whereas approximately 40 g/L HSA circulates in the human blood. The mycotoxin-induced loss of cell viability was evaluated based on ATP and total protein levels. As Figure9demonstrates, 20R-OTA and OTA caused dose-dependent, significant decreases in the concentration of ATP and total protein with slightly stronger effect on ATP levels, due to the ATP depleting effects of ochratoxins [33].
Under the applied conditions, the presence of 10% FBS or 40 g/L HSA (without ochratoxins) had no significant effect on cell viability (data not shown). In agreement with previous studies performed with IHKE (immortalized, human kidney, epithelial) and HepG2 (hepatocellular carcinoma, human liver, epithelial) cell lines [8,10], 20R-OTA exhibited approximately 10 times lower cytotoxicity than OTA. Furthermore, the presence of 10% FBS significantly decreased, while 40 g/L HSA completely abolished the acute toxic action of ochratoxins on MDCK cells, which is in agreement with the report of Gekle et al. [34]. The weaker effect of FBS can be attributed to the lower BSA content of the cell medium (3.5 g/L BSA verses 40 g/L HSA). Since albumins form very stable complexes with both 20R-OTA and OTA, albumin likely reduces the cellular uptake of these mycotoxins, resulting in their lower cellular toxicity.
Toxins 2018, 10, x FOR PEER REVIEW 10 of 16
2.6. Effects of Albumin on the In Vitro Toxicity of 2′R-OTA and OTA in MDCK Cell Line
Similarly to OTA, 2′R-OTA also forms very stable complexes with albumins (Table 2). Therefore, it was reasonable to hypothesize that the presence of albumin may decrease the 2′R-OTA-induced toxicity in cell experiments, due to the entrapment of the mycotoxin in the cell medium by albumin.
To test the influence of albumin on the in vitro effects of ochratoxins, the acute cellular toxicity of 2′R- OTA and OTA was investigated in the absence and presence of HSA and fetal bovine serum (FBS).
MDCK kidney cells were treated with the mycotoxins at increasing concentrations (0–50 µ M) for 24 h with and without 10% FBS or 40 g/L HSA. Ten percent FBS is commonly used in cell culture media (it yields approximately 3.5 g/L final concentration of BSA) in cell experiments, whereas approximately 40 g/L HSA circulates in the human blood. The mycotoxin-induced loss of cell viability was evaluated based on ATP and total protein levels. As Figure 9 demonstrates, 2′R-OTA and OTA caused dose-dependent, significant decreases in the concentration of ATP and total protein with slightly stronger effect on ATP levels, due to the ATP depleting effects of ochratoxins [33]. Under the applied conditions, the presence of 10% FBS or 40 g/L HSA (without ochratoxins) had no significant effect on cell viability (data not shown). In agreement with previous studies performed with IHKE (immortalized, human kidney, epithelial) and HepG2 (hepatocellular carcinoma, human liver, epithelial) cell lines [8,10], 2′R-OTA exhibited approximately 10 times lower cytotoxicity than OTA.
Furthermore, the presence of 10% FBS significantly decreased, while 40 g/L HSA completely abolished the acute toxic action of ochratoxins on MDCK cells, which is in agreement with the report of Gekle et al. [34]. The weaker effect of FBS can be attributed to the lower BSA content of the cell medium (3.5 g/L BSA verses 40 g/L HSA). Since albumins form very stable complexes with both 2′R- OTA and OTA, albumin likely reduces the cellular uptake of these mycotoxins, resulting in their lower cellular toxicity.
Figure 9. Effects of 2′R-OTA (left) and OTA (right) on cellular ATP (top) and total protein (bottom) levels of MDCK cells (% of control) in the absence and presence of 10% fetal bovine serum (FBS) or 40 g/L HSA, after 24 h incubation (* p < 0.01).
Figure 9.Effects of 20R-OTA (left) and OTA (right) on cellular ATP (top) and total protein (bottom) levels of MDCK cells (% of control) in the absence and presence of 10% fetal bovine serum (FBS) or 40 g/L HSA, after 24 h incubation (*p< 0.01).
Toxins2018,10, 353 11 of 16
2.7. Co-Treatment of MDCK Cells with OTA and 20R-OTA in the Absence and Presence of FBS
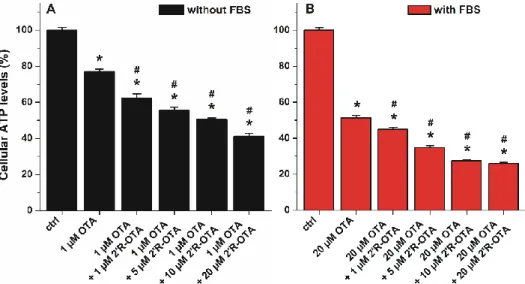
Since 20R-OTA appears in the circulation together with OTA, the toxic action of OTA in the presence of increasing 20R-OTA concentrations was also tested. Both mycotoxins occupy Site I as their primary binding sites in albumin, therefore, 20R-OTA may able to displace OTA from HSA, resulting in the increased cellular uptake and cytotoxicity of OTA in the presence of 20R-OTA. Because 40 g/L HSA completely abolished the acute toxic action of ochratoxins, co-treatment of MDCK cells with OTA and 20R-OTA was investigated without albumin and in the presence of 10% FBS. ATP levels/well were quantified after 24 h incubation. As ochratoxins were significantly less toxic in the presence of albumin, lower OTA concentration (1µM) was applied in the experiments performed without FBS compared to the studies carried out with 10% of FBS (where 20µM OTA was applied). As Figure10demonstrates, 20R-OTA even at sub-toxic concentrations increased significantly the toxic effect of OTA both in the absence and presence of FBS. In the presence of FBS (Figure10B), the 20R-OTA-induced further loss in cell viability may be partly attributed to the displacement of OTA from albumin by 20R-OTA. However, the co-treatment of MDCK cells with 20R-OTA increases the toxic effect of OTA even in the absence of FBS (Figure10A), suggesting that the displacement of OTA from albumin does not play a key role in the interaction. Therefore, other toxicokinetic and/or toxicodynamic mechanism(s) may be involved.
Despite its relatively lower toxicity, when simultaneously present 20R-OTA with OTA, 20R-OTA can increase the effect of OTA.
Toxins 2018, 10, x FOR PEER REVIEW 11 of 16
2.7. Co-Treatment of MDCK Cells with OTA and 2′R-OTA in the Absence and Presence of FBS
Since 2′R-OTA appears in the circulation together with OTA, the toxic action of OTA in the presence of increasing 2′R-OTA concentrations was also tested. Both mycotoxins occupy Site I as their primary binding sites in albumin, therefore, 2′R-OTA may able to displace OTA from HSA, resulting in the increased cellular uptake and cytotoxicity of OTA in the presence of 2′R-OTA. Because 40 g/L HSA completely abolished the acute toxic action of ochratoxins, co-treatment of MDCK cells with OTA and 2′R-OTA was investigated without albumin and in the presence of 10% FBS. ATP levels/well were quantified after 24 h incubation. As ochratoxins were significantly less toxic in the presence of albumin, lower OTA concentration (1 μM) was applied in the experiments performed without FBS compared to the studies carried out with 10% of FBS (where 20 μM OTA was applied). As Figure 10 demonstrates, 2′R-OTA even at sub-toxic concentrations increased significantly the toxic effect of OTA both in the absence and presence of FBS. In the presence of FBS (Figure 10B), the 2′R-OTA- induced further loss in cell viability may be partly attributed to the displacement of OTA from albumin by 2′R-OTA. However, the co-treatment of MDCK cells with 2′R-OTA increases the toxic effect of OTA even in the absence of FBS (Figure 10A), suggesting that the displacement of OTA from albumin does not play a key role in the interaction. Therefore, other toxicokinetic and/or toxicodynamic mechanism(s) may be involved. Despite its relatively lower toxicity, when simultaneously present 2′R-OTA with OTA, 2′R-OTA can increase the effect of OTA.
Figure 10. Effects of OTA with and without 2′R-OTA on MDCK cells in the absence (A) and presence (B) of 10% FBS, after 24 h incubation (compared to the control: * p < 0.01; compared to OTA-exposed cells: # p < 0.01).
3. Conclusions
In summary, the further aspects of 2′R-OTA-albumin interaction were examined and compared with OTA-albumin complex formation. The initial binding conformations of 2’R- and 2’S-OTA may provide a structural basis of the differences in experimental logK values. Since π‐stacking between the phenyl group of 2′R-OTA and W214 in albumin is not possible, the carboxylic moiety of 2′R-OTA changes its orientation, leading to a weaker hydrogen bond with R222 and the absence of the interaction with K195. Site markers induced stronger displacement of 2′R-OTA than OTA from HSA, confirming further the lower binding affinity of 2′R-OTA toward HSA. Interestingly, not only Site I markers but the ligands of the Heme binding site (methyl orange and bilirubin) also strongly displaced 2′R-OTA from HSA. Based on thermodynamic studies, the formation of 2′R-OTA-HSA complex is an entropy-driven process, where electrostatic forces play an important role in the stabilization of the 2′R-OTA-albumin complexes. The fluorescence enhancement of 2′R-OTA and OTA by albumins from different species (human, bovine, porcine and rat) showed different tendencies: 2′R-OTA showed the highest emission signal with BSA while OTA exhibited the highest fluorescence with RSA. Despite the significant interspecies differences in the albumin-binding of
Figure 10.Effects of OTA with and without 20R-OTA on MDCK cells in the absence (A) and presence (B) of 10% FBS, after 24 h incubation (compared to the control: *p< 0.01; compared to OTA-exposed cells: #p< 0.01).
3. Conclusions
In summary, the further aspects of 20R-OTA-albumin interaction were examined and compared with OTA-albumin complex formation. The initial binding conformations of 20R- and 20S-OTA may provide a structural basis of the differences in experimental logKvalues. Sinceπ-stacking between the phenyl group of 20R-OTA and W214 in albumin is not possible, the carboxylic moiety of 20R-OTA changes its orientation, leading to a weaker hydrogen bond with R222 and the absence of the interaction with K195. Site markers induced stronger displacement of 20R-OTA than OTA from HSA, confirming further the lower binding affinity of 20R-OTA toward HSA. Interestingly, not only Site I markers but the ligands of the Heme binding site (methyl orange and bilirubin) also strongly displaced 20R-OTA from HSA. Based on thermodynamic studies, the formation of 20R-OTA-HSA complex is an entropy-driven process, where electrostatic forces play an important role in the stabilization of the 20R-OTA-albumin complexes. The fluorescence enhancement of 20R-OTA and OTA by albumins from different species
Toxins2018,10, 353 12 of 16
(human, bovine, porcine and rat) showed different tendencies: 20R-OTA showed the highest emission signal with BSA while OTA exhibited the highest fluorescence with RSA. Despite the significant interspecies differences in the albumin-binding of OTA (human > bovine > porcine > rat) [17,32], the stability of 20R-OTA-albumin complexes is similar. Similarly to OTA [34], the complex formation of 20R-OTA with albumins alleviates or even abolishes the acute cellular toxicity of the mycotoxin, likely due to the decreased toxin uptake of MDCK cells. Despite its relatively low toxicity, even sub-toxic concentrations of 20R-OTA can increase significantly the OTA-induced loss of cell viability, both in the absence and presence of fetal bovine serum. Therefore, these results also underline the high importance of mycotoxin co-exposure. Finally, we need to mention some limitations of our in vitro results. As it was concluded previously, albumin-binding of 20R-OTA alone does not explain its longer plasma elimination half-life compared to OTA [23]. Furthermore, the toxicological consequence of OTA-albumin interaction is a controversial issue. The significant albumin-binding may limit the cellular uptake of OTA (even in vivo), which can be a protective mechanism. However, the complex formation of OTA with albumin also inhibits the rapid glomerular filtration of OTA (which would be an efficient elimination mechanism in the absence of albumin) [6]. Therefore, further in vivo experiments are necessary in the future to explore the toxicological outcome of 20R-OTA-albumin and OTA-albumin interactions.
4. Materials and Methods
4.1. Reagents
20R-ochratoxin A (20R-OTA) was synthetized as described [23]. Ochratoxin A (OTA), human serum albumin (HSA), bovine serum albumin (BSA), porcine serum albumin (PSA), rat serum albumin (RSA), racemic warfarin, furosemide, phenylbutazone, ibuprofen, methyl orange, bilirubin, and Dulbecco’s Modified Eagle Medium (DMEM) were obtained from Sigma-Aldrich (Saint Louis, MO, USA). Fetal bovine serum (FBS), (Pan-Biotech, Aidenbach, Germany), Bioluminescent ATP Assay Kit CLSII (Roche;
Basel, Switzerland), and Coomassie Brilliant Blue G-250 (Reanal; Budapest, Hungary) were used as received. Stock solutions of 20R-OTA and OTA (both 5000µM) were prepared in ethanol (96v/v%, Reanal, spectroscopic grade) and stored protected from light at−20◦C.
4.2. Modeling Studies
Mycotoxin molecules were built in Maestro [35]. The raw structures were energy minimized, employing the semi-empirical quantum chemistry program package, MOPAC [36], and PM6 parameterization [37]. The gradient norm was set to 0.001. The energy minimized structure was subjected to force calculations. The force constant matrices were positive definite. The minimized ligand structures were inputs of our docking calculations.
During the calculations, an apo crystallographic structure of HSA (PDB code: 1ao6) was used.
Schrödinger Maestro program package v. 9.6 [35] was applied for the attachment of acetyl and amide capping groups to the N- and C-termini, respectively. As 1ao6 contains a homodimer structure, only chain A was used for calculations. Co-crystallized ions and water molecules were removed before minimizing the protein structure. A two-step protocol was applied using GROMACS software package [38], including a steepest descent and a conjugate gradient step, and using AMBER99-ildn force field [39]. Exit tolerance levels were set to 1000 and 10 kJ mol−1nm−1while maximum step sizes were set to 0.5 and 0.05 nm, respectively. The minimized target structure was the input of our docking calculations.
Using the optimized ligand and target structures, docking calculations were carried out with AutoDock 4.2 program [40] as described elsewhere [15,41–43]. Gasteiger-Marsilli partial charges were added to both the ligand and target atoms, using AutoDock Tools [40] and a united atom representation was applied for non-polar hydrogens. A grid box of 90×90×90 points, and 0.375 Å spacing was calculated and centered on Sudlow’s Site I pocket in AutoGrid 4. Lamarckian genetic algorithm was
Toxins2018,10, 353 13 of 16
applied for global search. Flexibility was allowed on the ligand at all active torsions, number of docking runs was set to 100, numbers of energy evaluations and generations were 20 million [42]. Docked ligand conformations were ordered by the corresponding calculated interaction energy values and subsequently clustered using a tolerance of 1.75 Å root mean square deviation (RMSD) between cluster members [41]. Conformations of the lowest energy of a cluster were selected as cluster representatives were further analyzed.
4.3. Fluorescence Spectroscopic Studies
Fluorescence spectroscopic analyses, including anisotropy measurements, were carried out employing a Hitachi F-4500 fluorescence spectrophotometer. Spectroscopic measurements were performed in phosphate buffered saline (PBS, pH 7.4) at 25◦C in the presence of air. Fluorescence emission spectrum of 20R-OTA (1µM) was recorded in the presence of increasing concentrations of albumin (0.0, 0.1, 0.25, 0.5, 0.75, 1.0, 1.25, 1.5, 2.0, 3.0 and 5.0µM) using 295 and 394 nm as excitation wavelengths. At 394 nm, we excited directly 20R-OTA and its albumin complex [23]. However, using 295 nm excitation wavelength, albumin-bound 20R-OTA was excited as a result of the energy transfer between albumins and 20R-OTA [23,31].
Binding constants (K) of mycotoxin-albumin complexes were calculated by non-linear fitting, using the Hyperquad2006 program package (Protonic Software) as described in previous studies [23,44–46]. The stoichiometry of 20R-OTA-albumin complexes was calculated based on the model associated with the lowest standard deviation.
Fluorescence anisotropy measurements were performed using 394 and 447 nm excitation and emission wavelengths, respectively. In these experiments, increasing amounts of site markers (final concentrations: 0, 2, 5, 10, 20, and 30µM) were added to standard mycotoxin (20R-OTA or OTA) and HSA concentrations (1.0 and 1.5µM, respectively) in PBS. Fluorescence anisotropy were calculated using the following Equation:
r= (IVV −G×IV H)
(IVV+2×G×IV H) (1) whererandGdenote the fluorescence anisotropy and the instrumental correction factor, respectively.
IVVandIVHrepresent fluorescence emission intensities determined in vertical position of polarizer at pre-sample site and at vertical and horizontal position of post-sample polarizer, respectively.
4.4. Thermodynamic Studies
For the deeper insight into 20R-OTA-HSA interaction, binding constants of mycotoxin-albumin complexes were also determined at six different temperatures (298, 301, 304, 307, 310 and 313 K).
The binding constants were determined by the Hyperquad2006 program package [23,44–46], using 394 and 447 nm as excitation and emission wavelengths, respectively. Thermodynamic parameters associated to the complex formation between 20R-OTA and HSA were determined based on the van ’t Hoff equation:
logK=−∆G
RT =− ∆H
2.303RT+ ∆S
2.303R (2)
where∆G,∆H, and∆Sdenote the Gibbs free energy, enthalpy, and entropy changes of the binding reaction, respectively; whileRis the gas constant andTrefers the temperature.
4.5. Cell Culturing and Cell Viability Assay
MDCK (Madin-Darby canine kidney epithelial cell line, ATCC: CCL-34) cell culture was maintained in DMEM with 10% FBS, penicillin (100 U/mL), and streptomycin (100µg/mL) at 37◦C in a humidified environment (5% CO2). Cells were trypsinized and plated in 96-well sterile plastic plates (approximately 104cells/well) for overnight pre-incubation. Next day, the culture medium was replaced with fresh one (with or without 10% FBS or 40 g/L HSA), then cells were treated with increasing concentrations of 20R-OTA and/or OTA (0, 1, 5, 10, 20 and 50µM; in 150µL medium/well).
Toxins2018,10, 353 14 of 16
After 24 h incubation, cell viability was evaluated based on cellular ATP and total protein levels.
Analyses of ATP and total protein concentrations/well were performed based on the luciferin-luciferase and Bradford reactions, respectively, during which the previously published method was applied without modifications [47].
4.6. Statistics
Figures demonstrate the means and standard error (SEM) values based on at least three independent experiments. Data were analyzed using one-way ANOVA test withp< 0.01, as the level of significance (IBM SPSS Statistics software 2012, version 21, New York, NY, USA).
Author Contributions:M.P., Z.F., F.S., B.C., and H.-U.H conceived the study and wrote the paper. Z.F. and M.P.
performed fluorescence spectroscopic investigations. D.D. and B.L. carried out thermodynamic studies. B.L. and S.K.-M. determined binding constants employing the Hyperquad program. M.B. and C.H. performed molecular modeling studies. R.C. and T.K. carried out cell experiments. All authors have read, edited, and approved the final version of the paper.
Funding:This study was supported by the Hungarian National Research, Development and Innovation Office (FK125166) and the Deutsche Forschungsgemeinschaft, Bonn, Germany (HU 730/10-2). The work of M.B. and C.H. is supported by the Hungarian National Research, Development and Innovation Office (K123836).
Acknowledgments: This project was supported by the János Bolyai Research Scholarship of the Hungarian Academy of Sciences (M.P.). M.P. is thankful for support of the University of Pécs for the grant in the frame of
“Pharmaceutical Talent” Centre program. We acknowledge a grant of computer time from CSCS Swiss National Supercomputing Centre, and NIIF Hungarian National Information Infrastructure Development Institute. We acknowledge that the results of this research have been achieved using the DECI resource Archer based in the UK at the National Supercomputing Service with support from the PRACE aisbl. M.B. and C.H. are thankful to the University of Pécs for the grant in the frame of “Supporting Individual Research and Innovation Activity of Young Researchers, 2018” program. Financial support of the GINOP-2.3.2-15-2016-00049 grant is highly appreciated (S.K.-M.).
Conflicts of Interest:The authors declare no conflict of interest.
References
1. Wang, Y.; Wang, L.; Liu, F.; Wang, Q.; Selvaraj, J.N.; Xing, F.; Zhao, Y.; Liu, Y. Ochratoxin A producing fungi, biosynthetic pathway and regulatory mechanisms.Toxins2016,8, 83. [CrossRef] [PubMed]
2. el Khoury, A.; Atoui, A. Ochratoxin A: general overview and actual molecular status.Toxins2010,2, 461–493.
[CrossRef] [PubMed]
3. Duarte, S.C.; Pena, A.; Lino, C.M. A review on ochratoxin A occurrence and effects of processing of cereal and cereal derived food products.Food Microbiol.2010,27, 187–198. [CrossRef] [PubMed]
4. Trivedi, A.B.; Doi, E.; Kitabatake, N. Detoxification of ochratoxin A on heating under acidic and alkaline conditions.Biosci. Biotech. Biochem.1992,56, 741–745. [CrossRef] [PubMed]
5. Vidal, A.; Sanchis, V.; Ramos, A.J.; Marín, S. Thermal stability and kinetics of degradation of deoxynivalenol, deoxynivalenol conjugates and ochratoxin A during baking of wheat bakery products.Food Chem.2015,178, 276–286. [CrossRef] [PubMed]
6. K˝oszegi, T.; Poór, M. Ochratoxin A: molecular interactions, mechanisms of toxicity and prevention at the molecular level.Toxins2016,8, 111. [CrossRef] [PubMed]
7. Malir, F.; Ostry, V.; Pfohl-Leszkowicz, A.; Malir, J.; Toman, J. Ochratoxin A: 50 years of research.Toxins2016, 8, 191. [CrossRef] [PubMed]
8. Cramer, B.; Königs, M.; Humpf, H.-U. Identification and in vitro cytotoxicity of ochratoxin A degradation products formed during coffee roasting.J. Agric. Food. Chem.2008,56, 5673–5681. [CrossRef] [PubMed]
9. Cramer, B.; Osteresch, B.; Muñoz, K.A.; Hillmann, H.; Sibrowski, W.; Humpf, H.-U. Biomonitoring using dried blood spots: Detection of ochratoxin A and its degradation product 20R-ochratoxin A in blood from coffee drinkers.Mol. Nutr. Food Res.2015,59, 1837–1843. [CrossRef] [PubMed]
10. Cramer, B.; Harrer, H.; Nakamura, K.; Uemura, D.; Humpf, H.-U. Total synthesis and cytotoxicity evaluation of all ochratoxin A stereoisomers.Bioorg. Med. Chem.2010,18, 343–347. [CrossRef] [PubMed]
11. Fanali, G.; di Masi, A.; Trezza, V.; Marino, M.; Fasano, M.; Ascenzi, P. Human serum albumin: from bench to bedside.Mol. Aspects Med.2012,33, 209–290. [CrossRef] [PubMed]