Contents lists available atScienceDirect
Journal of Inorganic Biochemistry
journal homepage:www.elsevier.com/locate/jinorgbio
Synthesis, characterization and albumin binding capabilities of quinizarin containing ternary cobalt(III) complexes
Máté Kozsup
a, Orsolya Dömötör
b, Sándor Nagy
a, Etelka Farkas
a, Éva A. Enyedy
b, Péter Buglyó
a,⁎aDepartment of Inorganic and Analytical Chemistry, University of Debrecen, Egyetem tér 1, H-4032 Debrecen, Hungary
bDepartment of Inorganic and Analytical Chemistry, Interdisciplinary Excellence Centre, University of Szeged, Dóm tér 7, H-6720 Szeged, Hungary
A B S T R A C T
Four Co(III) ternary complexes with the composition of [(Co(4 N))2(quin)](ClO4)4or [(Co(4 N))2(quinS)](ClO4)3, where 4 N = tris(2-aminoethyl)amine (tren) or tris (2-pyridylmethyl)amine (tpa), quinH2= quinizarin (1,4-dihydroxy-9,10-anthraquinone), quinSH3= quinizarin-2-sulfonic acid (1,4-dihydroxy-9,10-anthraquinone- 2-sulfonic acid), were synthesized, characterized and their human serum albumin (HSA) binding capabilities were also tested. The complexes can be considered as likely chaperons of quinizarins which are structural models for anthracycline-based anticancer drugs like doxorubicin. All the Co(III) complexes are dinuclear and were isolated as mixture of isomers. Comparison of the cyclic voltammograms of the free ligands and the appropriate Co(III) complexes revealed that the new signals belonging to reversible processes in the range −400–0 mV (vs. Ag/AgCl) for the complexes can be attributed to the reversible reduction of the Co(III) centre. These potentials are in the range of typical (O,O) chelated Co(III) ternary complexes bearing 4 N donor ligands and follow the order being more positive for the tpa containing complexes. Presence of the sulfonate group in the quinizarin results in slightly more negative reduction potential of the Co(III) complexes. HSA binding capabilities of the quinH2and quinSH3ligands as well as the appropriate complexes showed that quinSH3has higher affinity to the protein than quinH2while none of the complexes seem to bind to HSA.
1. Introduction
Drawbacks associated with the lack of selectivity of square planar Pt (II) complexes currently used in the treatment of some tumors may be eliminated by taking into consideration the differences of healthy and tumor cells. For this purpose, inert Co(III) complexes for instance may serve as promising candidates since with suitable donor atom en- vironment these compounds can undergo selective reduction in the more reductive environment of the cancer cells caused by hypoxia. As a consequence, ligands with anticancer potential can be released upon dissociation of the less stable Co(II) complex within the cancer cell.
Anthracyclines are a class of antineoplastic drugs derived from Streptomyces sp. First anthracyclines were isolated from Streptomyces peucetius and were named doxorubicin and daunorubicin. These qui- nizarin (1,4-dihydroxy-9,10-anthraquinone, quinH2) based molecules with anticancer activity play an important role in the treatment of breast, ovarian, lung cancer, a range of neuroblastomas and leukemia [1–4]. The cellular target of doxorubicin is topoisomerase II enzyme. By interfering with the topoisomerase II-DNA complex doxorubicin in- hibits the enzyme thus triggers cell death because of the formation of double-strand breaks of DNA by the direct intercalation with DNA du- plex. This event inhibits the DNA replication and transcription to mRNA [1,5–8]. Doxorubicin and other anthracycline drugs suffer from dose- dependent acute and chronic toxicity the latter being due to
cardiotoxicity. The cardiotoxicity of doxorubicin is connected to iron- mediated various electron transfer processes resulting in the formation of reactive oxygen species (ROS) and subsequent generation of oxida- tive phosphorylation and lipoperoxidation [9–18]. Recently it was also reported that doxorubicin-induced cardiotoxicity is mediated by to- poisomerase-IIβ in heart muscle cells [8]. Anthracyclines with O-donors in chelate forming position are good metal ion complexing agents. A large number of literature data indicate that endogenous iron plays an important role in the dose-dependent cardiotoxicity of the anthracy- cline drugs. Iron is believed to be involved in ROS formation and the redox cycling of quinone form of doxorubicin would enable to increase the cellular levels of iron by mobilizing of iron from ferritin resulting in higher level of oxidative stress. On contrary to the “ROS hypothesis” it was also demonstrated that on the one hand iron chelators like dexra- zoxane are capable of decreasing the doxorubicin-related cardiotoxi- city, on the other hand none of the tested antioxidants proved to be protective against chronic cardiotoxicity in clinical settings [4,19–21].
Beside iron the complexation of anthracyclines with some other metal ions were also studied. In earlier works Garnier-Suillerot et al.
have studied the complex formation between Fe(III) or Pd(II) and doxorubicin, daunorubicin or carminomycin. It was found that all these anthracyclines form stable tris complexes with the Fe(III) while with Pd (II) bis and dimeric (Pd:ligand = 2:2) complexes were assumed. Despite the high stability of the Fe(III) complexes, complex dissociation
https://doi.org/10.1016/j.jinorgbio.2019.110963
Received 8 October 2019; Received in revised form 11 December 2019; Accepted 15 December 2019
⁎Corresponding author.
E-mail address:buglyo@science.unideb.hu(P. Buglyó).
Available online 17 December 2019
0162-0134/ © 2019 The Authors. Published by Elsevier Inc. This is an open access article under the CC BY license (http://creativecommons.org/licenses/BY/4.0/).
T
followed by intercalation of the unbound ligand into the DNA base pairs was observed in in vitro studies. Furthermore, all these complexes displayed anticancer activity against P-388 leukemia cells [22–24]. The complexation of doxorubicin with Cu(II) and Fe(II) was also in- vestigated and found that [CuL2] or [FeL3] are the major species at pH = 7.0 [25]. In a more recent study the interaction of doxorubicin and its structural model, 1,4-dihydroxy-9,10-anthraquinone-2-sulfonate (quinizarine-2-sulfonic acid, quinSH3), with Ni(II) was studied. The bis- ligand complexes, found to be present in solution, are able to bind to calf thymus DNA. Notably, the drug complex was reported to have much higher stability than the other model complex [26].
Regarding the simpler structural model of the anthracyclines, qui- nizarin, its dinuclear Ru(III) and Os(II) complexes in which the quini- zarin acts as a bridging ligand were synthesized and characterized. In both cases the redox study of the complexes revealed the non-innocent behaviour of the anthraquinone and several oxidation and reduction steps of the complexes were detected [27,28].
The aim of this work was to synthesize and characterize novel mixed ligand Co(III) complexes bearing the quinH2 ligand or its sulfonate derivative quinSH3as models for the costlier anthracycline drugs, in order to explore the nuclearity, stability, kinetic and redox behaviour of the complexes. In these species four coordination sites of the central Co (III) is taken by tripodal tetramines in order to provide appropriate redox features [29,30]. Tris(2-aminoethyl)amine (tren) and tris(2-pyr- idylmethyl)amine (tpa) tripodal amines were selected for the studies.
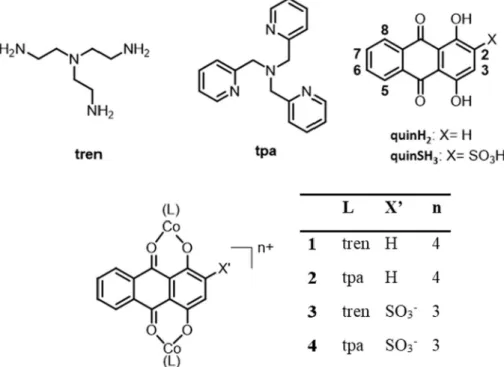
According to our hypothesis these Co(III) mixed ligand species may undergo selective dissociation under hypoxic conditions releasing the bioligand mostly in tumor cells. In an ideal case if the ligand is released selectively in the tumor cells it can be assumed that the dose of the anthracycline drug administered in metal complexed form can be lowered, and the dose-dependent cardiotoxicity of the anthracyclines can be minimized. Herein we present the synthesis, characterization and human serum albumin (HSA) binding results of four novel Co(III) ternary complexes with the model quinH2or quinSH3ligands accessed by elemental analysis, NMR and infrared (IR) spectroscopy, electro- spray ionization mass spectrometry (ESI-MS), cyclic voltammetry (CV), UV–visible (UV–Vis) and fluorimetric methods. The formulae of the used ligands and the complexes are summarized inFig. 1.
2. Experimental 2.1. Materials and reagents
CoCl2∙6H2O, NaNO2, tren, NaClO4, NH4PF6, 1,4-dihydroxy-9,10- anthraquinone (quinH2), 1,4-dihydroxy-9,10-anthraquinone-2-sulfonic acid (quinSH3), D2O, d6-DMSO were commercial products from Merck, Sigma-Aldrich, Reanal, Pflatz and Bauer. Tpa [31], [Co(tren)(NO2)2]Cl, [Co(tren)Cl2]Cl, [Co(tpa)(NO2)2]Cl, [Co(tpa)Cl2]Cl [32] were synthe- sized and purified according to literature procedures. HSA (with fatty acids as lyophilized powder), warfarin (WF), dansylglycine (DG),n- octanol and all buffer components (KCl, NaCl, Na2HPO4∙2H2O, KH2PO4) were Sigma-Aldrich products inpurissquality. Milli-Q ultrapure water was used as solvent for the samples and stock solutions. CAUTION:
Although we never have experienced any problems, perchlorate salts are potentially explosive.
2.2. Synthesis of the complexes 2.2.1. [(Co(tren))2(quin)](ClO4)4(1)
QuinH2 (38 mg, 0.16 mmol) was dissolved in 10 mL isopropanol containing 2 eq. 1M KOH (320 μL), giving a purple solution. [Co (tren)Cl2]Cl (100 mg, 0.32 mmol), dissolved in 5 mL water, was added.
The brown/deep orange mixture was heated at reflux for 4 h. The mixture was kept at room temperature overnight. The solid was filtered off and NaClO4was added to the solution in excess. Purple crystalline solid appeared after a few hours, on standing at 4 °C. The crude product was washed with 2 mL MeOH and recrystallized from acetonitrile. The solid was filtered off and dried in vacuo. Yield: 72 mg (43%).1H NMR (400 MHz, D2O):δ/ppm = 8.46 (m, 2H, AreH); 7.94 (m, 2H, AreH);
7.46 (t, 1H, AreH); 7.37 (t, 1H, AreH); 3.94 (m, 2H, -CH2); 3.84 (m, 2H, -CH2); 3.54 (m, 4H, -CH2); 3.37 (m, 4H, -CH2); 3.24 (m, 4H, –CH2);
3.07 (m, 6H, –CH2); 2.88 (m, 2H, –CH2). (400 MHz, d6-DMSO): δ/
ppm = 8.44 (m, 2H, AreH); 7.96 (m, 2H, AreH); 7.47 (t, 1H, AreH);
7.28 (t, 1H, AreH); 5.48 (m, 4H, -NH2); 5.32 (m, 4H, -NH2); 5.24 (m, 3H, -NH2); 5.13 (m, 1H, -NH2); 3.58 (m, 4H, -CH2); 3.41 (m, 4H, -CH2);
3.21 (m, 4H, -CH2); 3.00 (m, 4H, -CH2); 2.85 (m, 4H, -CH2); 2.78 (m, 4H, -CH2). IR (KBr)/cm−1: 3260, 1543, 1422, 1105, 625. Anal.
Required for C26H42Cl4Co2N8O20∙0.8NaClO4∙0.6 H2O: C, 27.03, H, 3.77,
Fig. 1.Structure and abbreviation of the studied ligands and complexes.
N, 9.70%. Found: C, 27.00, H, 3.78, N, 9.58%. MS (ESI, positive ion):
m/z: 444.122 ([Co(II)(tren)(quin) + H]+); 304.037 ([Co(II)(tren) (ClO4)]+).
2.2.2. [(Co(tpa))2(quin)](ClO4)4(2)
The synthesis was similar to that of1, using [Co(tpa)Cl2]Cl (100 mg, 0.22 mmol), quinH2(26 mg, 0.11 mmol), 1 M KOH (220 μL). The crude product was washed with 2 mL MeOH and Et2O and it was re- crystallized from water. The complex was isolated as an indigo coloured crystalline solid. Yield: 94 mg (47%).1H NMR (400 MHz, d6-DMSO):δ/
ppm = 9.44 (d, 0.5H, AreH); 9.37 (m, 1.5H, AreH); 9.11 (d, 0.5H, AreH); 8.59 (d, 0.5H, AreH); 8.46 (m, 0.5H, AreH); 8.32 (m, 1.5H, AreH); 8.24 (m, 3H, AreH); 8.12 (m, 8H, AreH); 7.85 (m, 8H, ArH);
7.57 (m, 1H, ArH); 7.41 (m, 5H, ArH); 5.86 (m, 2.5H, -CH2); 5.70 (m, 1.5H, -CH2); 5.35–5.17 (m, 6H, -CH2); 5.06–4.96 (m, 2H, -CH2). IR (KBr)/cm−1: 3434, 3083, 1611, 1540, 1424, 1278, 1091, 770, 623.
Anal. Required for C50H42Cl4Co2N8O20∙2 H2O: C, 43.81, H, 3.38, N, 8.18%. Found: C, 43.95, H, 3.34, N, 8.26%. MS (ESI, positive ion):m/z:
588.119 ([Co(II)(tpa)(quin) + H]+); 468.099 ([(Co(II) (tpa))2(quin)]2+); 448.034 ([Co(II)(tpa)(ClO4)]+); 174.542 ([Co(II) (tpa)]2+).
2.2.3. [(Co(tren))2(quinS)](PF6)3(3)
QuinSH3(51 mg, 0.16 mmol) was dissolved in 10 mL MeOH and 2 eq. 1M KOH (320 μL), was added giving a purple solution. [Co (tren)Cl2]Cl (100 mg, 0.32 mmol), was added and the mixture was stirred at 60 °C for overnight. The mixture was filtered after standing at 4 °C for half a day. Purple solid appeared immidiately by adding NH4PF6(78 mg, 0.48 mmol). The mixture was heated at reflux to get a clear solution and left to cool down to room temperature slowly. Purple crystalline solid appeared. The solid was filtered off and dried in vacuo.
Yield: 78 mg (48%).1H NMR (400 MHz, d6-DMSO):δ/ppm = 8.41 (m, 2H, AreH quinS); 7.93 (m, 2H, AreH quinS); 7.75 (s, 0.5H, AreH quinS); 7.60 (s, 0.5H, AreH quinS); 6.02 (m, 1H, -NH2); 5.90–5.67 (m, 7H, -NH2); 5.45 (m, 2H, -NH2); 5.25 (m, 1H, -NH2); 5.06 (m, 1H, -NH2);
4.26 (m, 2H, -CH2); 3.57 (m, 2H, -CH2); 3.42 (m, 2H, -CH2); 3.25–3.11 (m, 4H, -CH2); 2.98 (m, 5H, -CH2); 2.85 (m, 7H, -CH2); 2.63 (m, 2H, -CH2). IR (KBr)/cm−1: 1602, 1413, 1048, 639, 501, 419. Anal.
Required for C26H41Co2F18N8O7P3S: C, 26.86, H, 3.55, N, 9.64, S, 2.76%. Found: C, 26.51, H, 3.46, N, 9.95, S, 2.58%. MS (ESI, positive ion): 363.070 ([(Co(III)(tren))2(quinS)-H]2+); 304.035 ([Co(II)(tren) (ClO4)]+).
2.2.4. [(Co(tpa))2(quinS)](ClO4)3(4)
QuinSH3(51 mg, 0.16 mmol) was dissolved in 10 mL water and 2 eq. 1M KOH (320 μL), was added giving a purple solution. [Co (tpa)Cl2]Cl (146 mg, 0.32 mmol) dissolved in 5 mL water was added and the mixture was stirred at 70 °C for 4 h. 20 mL propanol and NaClO4in excess were added. On standing at 4 °C purple crystalline solid appeared. The solid was filtered and dried in vacuo. Yield: 132 mg (63%).1H NMR (400 MHz, d6-DMSO):δ/ppm = 10.31 (d, 1H, AreH tpa); 9.44 (d, 1H, AreH tpa); 8.83 (s, 1H, AreH quinS); 8.45 (d, 2H, AreH tpa); 8.41 (d, 2H, AreH); 8.34 (m, 2H, AreH); 8.11–7.98 (m, 6H, AreH); 7.84 (m, 3H, AreH); 7.77 (t, 4H, AreH); 7.69 (t, 1H, AreH);
7.62 (t, 2H, AreH); 7.56 (t, 2H, AreH); 7,40 (dd, 2H, AreH); 5.73 (dd, 4H, -CH2); 5.33 (d, 4H, -CH2); 5.19 (dd, 4H, -CH2). IR (KBr)/cm−1: 1612, 1450, 1050, 637, 504, 419. Anal. Required for C50H41Cl3Co2N8O19S∙0.5 propanol∙2 H2O: C, 44.81, H, 3.58, N, 8.12, S, 2.32%. Found: C, 44.82, H, 3.57, N, 7.95, S, 2.53%. MS (ESI, positive ion): 667.068 ([Co(III)(tpa)(quinS) + H]+); 507.573 ([(Co(III)(tpa)) (quinS)(Co(II)(tpa))]2+); 174.543 ([Co(II)(tpa)]2+).
2.3. NMR, IR and ESI-MS measurements
NMR measurements were carried out using Bruker Avance 400 NMR spectrometer at room temperature on samples prepared in D2O or/and
in d6-DMSO. Calibration was performed using the signals of the solvents (2.50 ppm for DMSO and 4.79 ppm for D2O). IR spectra as KBr pellets were recorded on a Perkin Elmer FTIR Paragon 1000 PC instrument at the Department of Organic Chemistry, University of Debrecen. ESI-TOF MS measurements in the positive mode were carried out on a Bruker micrOTOF-Q instrument at the Department of Applied Chemistry, University of Debrecen. The concentration of the samples was 10 μg/mL and the solvent was water or methanol. The instrument was equipped with an electrospray ion source, where the voltage was 4 kV. The drying gas was N2. The flow rate was 4 L/min and the drying temperature was 200 °C. The spectra were recorded by means of a digitizer at a sampling rate of 2 GHz. The mass spectra were calibrated externally, using the exact masses of clusters [(NaTFA)n+ Na]+generated from the elec- trosprayed solution of sodium-trifluoroacetate (NaTFA). The spectrums were evaluated with DataAnalysis 3.4 software from Bruker. The sam- ples were introduced directly into the ESI with a syringe pump at a flow rate of 3 μL/min.
2.4. Cyclic voltammetric (CV) studies
Cyclic voltammetric experiments were performed within the voltage range 0 – −1000 mV, at room temperature in H2O or MeOH, using a Metrohm 746–747 VA Trace Analyser and BASi Epsilon EClipse equipped with a three-electrode system, which consists of a Ag/AgCl/
3 M KNO3reference electrode (E1/2= +209 mV vs. normal hydrogen electrode (NHE)), a platinum wire auxiliary electrode (ALS Co. Japan), and a glassy carbon (CHI104) working electrode. Aqueous solution of K3[Fe(CN)6] was used to calibrate the system (E1/2= +0.458 V versus NHE in 0.50 M KCl) [33]. The samples were degassed before the measurements using argon gas. The concentration of the complexes was 1 mM, the potential sweep rates were 200 mVs− 1 during the de- termination of the redox potentials. The supporting electrolyte con- tentration was 0.20 M in all cases. KNO3was used in aqueous solutions and [NBu4][BF4] was used in methanolic solutions. Ligands quinH2and quinSH3were dissolved in water by adding one drop of base (0.2 M KOH). The samples were dissolved in methanol for pH dependence studies and pH was adjusted by 0.2 M HCl and 0.2 M KOH.
2.5. Lipophilicity measurements
Distribution coefficients (D7.40) of the compounds were determined by the traditional shake-flask method inn-octanol/buffered aqueous solution at pH = 7.40 phosphate buffer saline (PBS) at 25.0 ± 0.2 °C.
Compounds, except for quinH2, were dissolved inn-octanol pre-satu- rated buffered aqueous phase, and final compound concentration was 20–100 μM. Ligand quinH2was dissolved inn-octanol pre-saturated by water in 2 mM concentration. Aqueous buffered phases and water pre- saturatedn-octanolic phases were gently mixed in 1:1, 1:70 (for3,4), or 20:1 (for quinH2) volume ratios with Heidolph Reax 2 overhead shaker (~20 rpm) for 2 h. The mixtures were centrifuged with Eppendorf MiniSpin Plus centrifuge (5000 rpm, 3 min). After phase separation, UV−Vis spectrum of the compound in the aqueous phase (in then-octanolic phase in case of quinH2) was compared to that of the original stock solution andDpHvalues of the compounds were calcu- lated according to the following equations:
= ×
D Abs V
Abs 1 V
pH (stock.sol.) n
(aqueous phase after separation)
(aqueous phase)
( octanol phase) (1)
and for quinH2:
= ×
D Abs V
Abs Abs
V
n
pH (oct.phase after separation)
(stock.sol.) (oct.phase after separation)
(aqueous phase) ( octanol phase) (2) A Hewlett Packard 8452a diode array spectrophotometer was used to measure the UV–Vis spectra in the interval 200–500 nm.
2.6. HSA binding studies
2.6.1. Preparation of stock solutions of HSA and the studied complexes and ligands
HSA solution was prepared in phosphate buffered saline (PBS) strictly on the same day when the experiment was performed. Ligand quinSH3and all complexes were dissolved in PBS buffer atc.a.100 μM concentration. Ligand stock solution of quinH2was prepared in DMSO (100 μM). Ligand stock solutions were kept in dark and were used within 48 h.
2.6.2. UV–Vis spectrophotometric measurements on HSA binding of the compounds
Two-chamber cuvettes (tandem cells) were utilized to monitor the interaction between HSA and compounds quinSH3, 1 and4 in PBS puffer. One chamber contained 60 μM compound and the other con- tained 4–120 μM HSA. Spectra were recorded before and after mixing of the content of the cuvette on an Agilent Cary 8454 diode array spec- trophotometer in the wavelength range between 190 and 1100 nm.
2.6.3. Spectrofluorometric measurements
PBS puffer was used for sample preparation; and emission spectra were recorded after 30 min incubation. Three kinds of experiments were carried out: (i) 1 μM HSA and various amounts of compound (from 0 to 15 eq.) were used for quenching experiments; and (ii) fluorescence of site
markers WF and DG was examined in samples containing 1 μM HSA, 1 μM marker and 0–15 μM compound; while (iii) intrinsic fluorescence of the ligands was followed as well applying 1 or 0.5 μM ligand and various HSA concentrations (0–15 μM). The excitation and emission wavelengths and applied slit widths are listed in Table S1. Computer program PSEQUAD was utilized for calculation of formation constants for HSA – compound adducts as described in our former work [34].
Corrections for self-absorbance and inner filter effect were done as described in our former work using the formula suggested by Lakowicz [35,36].
Model calculations on the binding stoichiometry of quinSH3– HSA interaction were carried out for models assuming one (I), two (II) or three (III) available binding sites on the protein. The two binding constants determined in site marker displacement experiments were used for model II; model I operates with logK’ = 6.30 (average value of the two determined constants), while model III contains the two ex- perimental constant and the average of them assumed for a third site.
Calculations were done with MEDUSA program [37].
3. Results and discussion 3.1. Synthesis and characterization
QuinH2 or quinSH3and stoichiometric amount of [Co(4 N)Cl2]Cl (4 N = tren or tpa) precursors were reacted in isopropanol for1,2, Fig. 2.The aromatic region of the1H NMR spectrum of [(Co(tren))2(quin)](ClO4)4(1) in D2O. A and C are the supposed structures of the symmetrical isomers while B is the asymmetrical isomer.
methanol for3and water for4in the presence of two eq. base at high temperature (60–70 °C) for 4 h or overnight. Purple crystalline solid appeared on cooling at 4 °C by adding bulky ClO4−or PF6−anions to the reaction mixture. The novel complexes are air stable, soluble in water in relatively low (0.7–1.0 mM) concentration and stable in aqu- eous solution at least for 48 h.
The free ligand quinH2was examined by1H NMR in d6-DMSO. The hydroxyl groups appear as one singulet at 12.7 ppm. Resonances of protons2and3(seeFig. 1. for the numbering scheme) at 8.25 ppm,4 and5at 7.99 ppm as multiplets and6,7at 7.44 ppm as a singulet in the spectrum. All of the similar type of protons showed one single peak each in the spectrum, proving the symmetry of the ligand. By adding base to the sample all signals of the aromatic protons showed downfield shift due to deprotonation of the hydroxyl groups. The extent of the shift was 0.29 ppm in the case of protons2,3, 0.15 ppm for5,8and nearly 0 ppm (0.01 ppm) for6,7due to these latter hydrogens are too far from the hydroxyl groups.
The signals of the quinizarin as well as the aliphatic tren protons in the spectra of1and3complexes are separated well resulting a simple assignation. For illustration1H NMR spectrum of1is shown in Fig. S1.
Comparing the integrals of the resonances of the6,7protons of qui- nizarin (around 7.95 ppm) and one of the well separated set of signals of one CH2function (around 3.55 ppm) of the tren ligand for instance, the integration values clearly reveal the dinuclear nature of the com- plexes formed with both of the ligands. In particular, in Fig. 2. the aromatic region of1indicates that the5,8protons of the coordinated ligand exhibit resonances at low field due the neighbouring high elec- tronegativity O donors while the 6,7protons of the same ring show signals at higher field being further apart from these donors. The re- maining two 2, 3protons of the quinizarin backbone can be found around 7.4 ppm. Looking at the above signals of the protons of the quinizarin backbone in each case three sets of them can be seen. For the 2, 3 protons instead of the expected three singulets, however, two singulets and a multiplet are detected. These findings indicate that in1 two symmetrical and one asymmetrical isomers should be present. (This is also clearly demonstrated by the COSY spectrum shown in Fig. S2.) This assumption is further supported by comparing the ratio of integrals of the three isomers for 5, 8and6,7 protons. The structure of the expected three isomers can also be seen inFig. 2. As in isomer B the two Co cores coordinate asymmetrically to the quinizarin the multiplet for the2,3protons at 7.4 ppm belongs to this isomer and, according to the integrals, this is the major one among the isomers.
Assignation was more difficult for the tpa complexes (2and4) due to the aromatic character of the three pyridyl arms of the tpa ligand.
The -CH2groups of tpa appear in the range of 6.00–5.00 ppm. The ratio of the aromatic and aliphatic hydrogens clearly indicates the formation of the same type of dinuclear complexes like in case of the tren ana- logues. Based on the1H NMR spectra of2and4(not shown) the large number of signals in the well separated –CH2region indicate the pre- sence of various isomers.
In order to further elucidate the structure of the complexes ESI-MS analysis in the positive mode was also carried out. In most of the cases in the mass spectra of the products peaks belonging to both mono and dinuclear complexes appeared. Based on the results, Co(III) was re- duced to Co(II) in all of the four novel compounds under ESI-MS con- ditions. Peaks of precursor ions like [Co(II)(tren)(ClO4)]+or [Co(II) (tpa)]2+appeared in the spectra in most cases. While in the spectra of quin complexes only the signals of ions containing Co(II) were detected, for the quinS analogues molecule ions containing Co(III) can also be identified. Interestingly, in the spectrum of4them/z= 507.573 value belongs to the [(Co(III)(tpa))(quinS)(Co(II)(tpa))]2+ with different oxidation state of the two metal ions. All of the mass spectra displayed the correct isotopic pattern; as a representative example, see Fig. S3.
The identity of the complexes was further proved by the elemental analysis data. It was found for the quinS complexes that the sulfonic acid group is deprotonated in both complexes, thus three counter ions
(PF6−for 3and ClO4−for4) were required for crystallization. The results indicate that complexes1,2and4also contain water molecules in their structures. (Despite all our efforts 1 contains some NaClO4
impurity but this did not affect the results of the CV measurements or HSA binding studies.)
The carbonyl functional groups of the novel complexes involved in the coordination were also studied by IR spectroscopy. The change of the absorption band, assigned toυ(C=O) in all of the novel compounds compared to that of the free ligand quinH3was observed. The corre- sponding band at 1630 cm−1 in the spectrum of quinH3 has been shifted to the region of 1540–1548 cm−1 upon bonding for all four complexes [38,39]. The shift of this band due to complexation with other type of metal ion was reported before [40]. These results con- firmed that the ligands are bound to the cobalt ions via the oxygens of the carbonyl groups.
3.2. Electrochemical studies
In order to examine the electrochemical properties of the novel complexes cyclic voltammetric measurements were carried out in the 0 – (−1000) mV voltage range. Since some previous results demonstrated redox activity of the studied ligands, quinH2and quinSH3, in this vol- tage range [9,41] prior to the investigation of the metal complexes, measurements on the free ligands in aqueous solution were also per- formed. In agreement with previous literature findings [9,41] both li- gands showed redox activity. For illustration, representative voltam- mograms are seen in Fig. S4. The voltammograms revealed reversible reduction steps in the range (−450)–(−800) mV vs. Ag/AgCl reference electrode for both of the ligands, but significant differences were also observed when the results for quinSH3 and quinH2were compared.
Namely, the anodic and cathodic peak potential values of quinSH3were shifted to the less negative voltage region by approximately 150 mV compared to the non-sulfonated ligand quinH2, due to the electron withdrawing character of the sulfonate moiety. As it is shown in Fig. S4, two successive (overlapping) reduction processes were indicated by the voltammogram of quinSH3while only one is seen in the case of quinH2. However, evaluation of the cathodic peak shows the uptake of two electrons also in this latter case, using the formula published by Guin et al. [42]. These above discussed differences of the redox character of the two ligands were also reported by Guin et al. [9,42].
Although, neutral pH is relevant in biological aspect, to get further information of the redox character of the ligands, in another experi- ment, pH dependence was also studied. Because of solubility reasons, quinSH3ligand was selected for these investigations. The measurements were carried out in methanol, using [NBu4][BF4] as supporting elec- trolyte (see details in the Experimental part). Selected voltammograms, together with the peak potential values are shown in Fig. S5. Compared to the nearly neutral condition, the voltammograms changed sig- nificantly under acidic conditions (pH ~ 2), but only slightly by ad- justing the pH up to ~ 11.5. (Fig. S5). The reversible successive re- duction steps appear separately at neutral and basic pH, but turn into one overlapped reversible peak shifted to the less negative potential region in acidic solution. This tendency is in a good agreement with the few literature findings [9,43].
Cyclic voltammetric results on the [Co(tren)Cl2]Cl and [Co (tpa)Cl2]Cl precursor complexes were previously reported by us and indicated both compounds to show irreversible reduction, but the peak potential value of the tpa precursor complex was significantly less ne- gative than that of the tren analogue [44].
Electrochemical behaviour of the four novel ternary complexes were characterized as well, representative voltammograms recorded in water (pH ~5) are presented inFig. 3a and b.
pH-dependence of the redox behaviour was also studied. Selected CV curves and peak potential values are shown in Fig. S6 and Table S2, respectively. The results revealed similar pH-dependence for the ternary complex, [(Co(tren))2(quinS)](PF6)3(3) as those of the quinSH3
ligand.
A comparison between the voltammograms of the free ligands and the corresponding ternary complexes, as well as between those regis- tered for the tren-containing and tpa-containing complexes inFig. 3a and b shows one significant difference. Namely, one extra reversible process in each of the latter systems compared to the corresponding free ligand is indicated in the voltammograms in the potential range (−400) – 0 mV. All the successive reduction steps are more separated for4, while appears as one overlapping peak for the other complexes. The measured cathodic peak potential values of the novel complexes are summarized inTable 1.
The registered extra peaks indicating reversible redox processes in the voltammograms most probably belong to the non-dissociated ternary complex species since none of the possible dissociation products (quinH2/quinSH2−, [Co(tren)Cl2]+ (Epc = −439 mV) or [Co (tpa)Cl2]+(Epc= 72 mV)) displays similar pattern [42]. Similar ob- servations have been made for the relevant ruthenium containing complexes [28].
In accordance with earlier reports on [Co(4 N)(O,O)] (4 N = tren or tpa, O,O = hydroxamato or quinolonato) type complexes, [44,45] the reduction potentials of tren complexes are more negative than those of the corresponding tpa containing ones. This difference originates from the distinct characters of the N donor atoms of the tripodal amines.
While only σ-bonding is possible with the aliphatic N atoms of tren, π- back-bonding interaction occurs with the aromatic pyridyl N donor atoms of tpa. Thus a decreased electron density at the cobalt ions in the complexes of tpa results in species more susceptible for reduction compared to the corresponding tren analogues. Regarding the appro- priate quinizarin Co(III) ternary complexes with a given 4 N donor (tren or tpa) auxiliary ligand and (O,O) coordination of the quinizarin the obtained cathodic peak potential values are in the same range as those
obtained for the previusly studied hydroxamato or quinolonato com- plexes with identical (O,O) coordination [44,45].
3.3. Lipophilicity measurements
Lipophilicity of the studied ligands and their complexes has not reported in the literature yet. The extremities in the lipophilic and hydrophilic character of quinH2and the sulfonated complexes required modified experimental conditions, namely the water-to-octanol volume ratio was changed from 1:1 in favor of the less efficient solvent phase (see details in the Experimental part).Table 2comprises the logarithm of distribution coefficients (logD7.40) determined at pH 7.40.
Ligand quinH2appears to be highly lipophilic, while its sulfonated congener quinSH3 is significantly hydrophilic thanks to the deproto- nated sulfonate functional group on the molecule. Complexes1and2 show similar and remarkable hydrophilic character that can be due to the +4 positive charge of the complex cations. For complexes3and4 only a threshold limit (logD7.40 < −3.0) could be estimated. The ex- treme hydrophilicity of these sulfonate complexes however is not sur- prising, considering thec.a.3.5 orders of magnitude difference inD7.40
values obtained for quinH2and quinSH3.
The result of lipophilicity measurements points out the possible cell uptake of the active ligand quinH2 via passive transport, while its complexes require most probably an alternative pathway to enter cells.
3.4. Albumin binding of the ligands and their complexes
HSA is the most abundant transport protein in human blood, pro- viding three hydrophobic binding pockets (site I, II and III) for various types of molecules. Albumin binding may not only increase the ap- parent solubility of a compound but can prevent its early metabolism and excretion. HSA binding of the compounds was investigated by means of UV–Vis and direct and indirect spectrofluorometric techniques at 37 °C. Limited aqueous solubility of quinH2 allowed the Fig. 3.CV curves registered for [(Co(tren))2(quin)](ClO4)4(1), [(Co(tpa))2(quin)](ClO4)4(2), [(Co(tren))2(quinS)](PF6)3(3) and [(Co(tpa))2(quinS)](ClO4)3(4) in water (pH ~5), referenced to Ag/AgCl electrode at a potential sweep rate of 200 mV/s and ccomplex= 1.0 mM.
Table 1
Cathodic peak potential values of the novel ternary complexes in water (pH~
5), referenced to Ag/AgCl electrode at a potential sweep rate of 200 mV/s and ccomplex= 1.0 mM.
Complex Epc(mV) vs. Ag/AgCl
[(Co(tren))2(quin)](ClO4)4(1) −340 [(Co(tpa))2(quin)](ClO4)4(2) −649−182 [(Co(tren))2(quinS)](PF6)3(3) −734−368
−553−658 [(Co(tpa))2(quinS)](ClO4)3(4) −78
−193−506
−677
Table 2
Distribution coefficients (D7.4) determined for ligands quinH2and quinSH3and their Co(III)- complexes (1–4), at pH = 7.40 (PBS buffer), 25 °C.
logD7.40
quinH2 2.95(3)
quinSH3 −0.55(2)
1 −1.33(2)
2 −1.08(2)
3 < −3.0
4 < −3.0
implementation of only certain fluorometric measurements.
Global binding of quinSH3, 1and4on HSA was investigated by UV–Vis spectrophotometry. Fig. 4 shows the spectral changes of quinSH3in the presence of increasing HSA concentration. Absorption maxima are red shifted with an isobestic point at 498 nm, and a new band develops between 550 and 650 nm. Structural rearrangement or even partial deprotonation of the ligand (see Fig. S7 for UV–Vis spec- trum of the completely deprotonated ligand) is probable upon binding to albumin. The binding takes place fairly fast (within some seconds the equilibrium was reached) and seems to be completed upon the addition of < 1 eq. HSA, that strongly suggests the presence of at least two binding sites for quinSH3in HSA. On the other hand, complexes1and4 do not show appreciable spectral changes in the presence of the protein even after 2 h waiting time (see Fig. S8). This phenomenon however does not exclude binding of the complexes in HSA, since this event covers more frequently intermolecular, non-covalent interactions that have little (or not measurable) effect on the UV–Vis spectra of a small molecule.
As next step binding at site I (IIA subdomain) was studied via tryptophan (Trp) quenching experiments in the case of quinSH3,1,2,3 and4. The only Trp (Trp214) in HSA is situated near to site I and can selectively be excited at λ = 295 nm. AsFig. 5shows Trp exerts strong fluorescence around 340 nm that can be quenched by a binding event at or close to site I [46–48]. Quenching curves inFig. 5 suggest con- siderable binding of quinSH3at this site, while complexes1–4could not quench the fluorescence of Trp, and consequently may not bind here.
Solubility problems of quinH2hindered the execution of quenching and marker displacement measurements with this ligand. A conditional binding constant logK'quench= 5.92(1) can be computed by the pro- gram PSEQUAD for the quinSH3− site I interaction [34]. Binding af- finity of quinSH3at site I was determined by WF displacement experi- ments as well. Here competition of the two compounds for site I was revealed again and a similar binding constant (logK’ = 6.14(1)) could
be calculated. Complexes1–4, at the same time, do not compete with WF for site I, which is in accordance with the findings of quenching experiments.
Site marker DG was utilized to follow binding at the other main binding pocket site II (IIIA subdomain). High extent of quinSH3binds to site II; the calculated affinity logK’ = 6.45 (2) exceeds reported binding strength of diazepam that is a well-known high-affinity ligand of site II (logK= 5.6) [46]. The metal complexes do not show binding at site II.
The studied ligands quinSH3and quinH2possess moderate intrinsic fluorescence favorably not overlapping by that of HSA (see Fig. S9); and effect of the protein on this fluorescence was investigated as well.
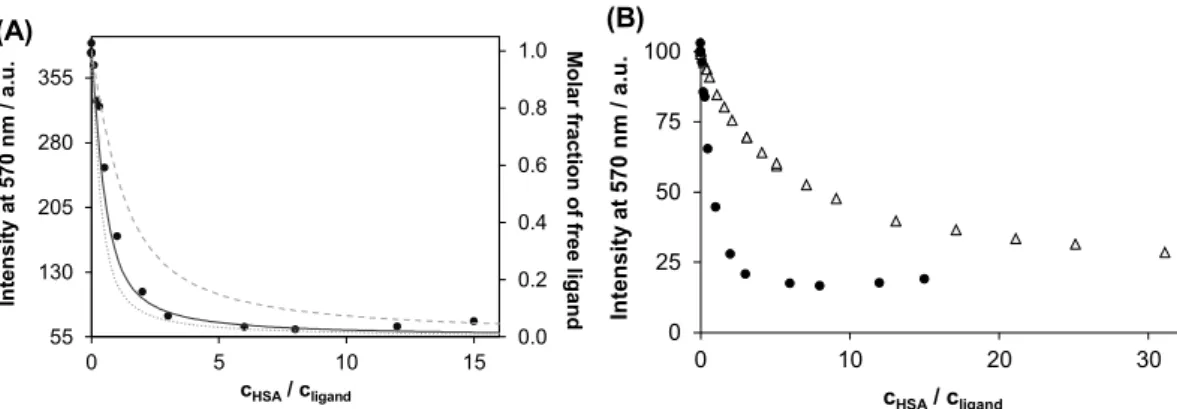
Samples contained ligands in highly diluted solution (1.0 and 0.5 μM for quinSH3and quinH2respectively) and various equivalents of HSA, which allowed to study the HSA binding of quinH2itself.Fig. 6a shows the intensity changes of quinSH3in the presence of the protein and an unequivocal decrease in the intensity can be observed. Albumin binding, providing a solvent protected non-polar environment often enhances fluorescence of a small-molecule. UV–Vis experiments how- ever, formerly suggested structural changes, even partial deprotonation of quinSH3upon binding to HSA. Besides, fluorescence measurements reveal negligible fluorescence of the deprotonated form of quinSH3
(Fig. S9). Namely, assisted deprotonation of quinSH3upon binding to HSA is a possible explanation of the unusual fluorescence quenching effect of the protein on the ligand's intrinsic fluorescence.
Model calculations were performed with the help of binding con- stants determined for sites I and II in order to get an insight into the binding stoichiometry between HSA and this ligand. InFig. 6the two- site model (assuming binding at both sites I and II) gives the best fit to the experimental data, while one-site or three-site models deviate considerably from those. In all, high affinity binding of two equivalents of quinSH3 is probable on HSA, but existence of a low-affinity (logK < 5) third site cannot be excluded. The emission intensity of quinH2is quenched as well upon addition of HSA (seeFig. 6), however 0.0
1 0.2
350 450 550 650
sorbance
λ/ nm
(A) cHSA= 0 M
60 M
0.05 0.10 0.15 0.20
0.0 0.5 1.0 1.5 2.0
Absorbance
cHSA/ cligand
(B)
Fig. 4.UV–Vis absorbance spectra recorded for quinSH3in the absence and presence of HSA in various concentrations (A), and absorbance values followed at 460 nm (Δ) and 530 nm (●) in this system, clig= 30 μM, pH = 7.40 (PBS), 37 °C.
0 100 200 300
310 360 410
Intensity / a.u.
λEM/ nm
(A)
50 75 100
0 5 10 15
Int./ Int.0/ %
ccompound/ cHSA
(B)
Fig. 5.Trp214 fluorescence spectra of HSA in the presence of increasing quinSH3concentrations (0–15 μM) (A) and normalized fluorescence quenching curves registered at λEM= 350 nm for quinSH3(●),1(◊),2(□),3(Δ) and4(○) at various compound-to-HSA ratios, cHSA= 1 μM; λEX= 295 nm; pH = 7.40 (PBS), 37 °C.
its protracted quenching curve assumes considerably lower affinity and/or less accessible binding sites for quinH2 compared to that of quinSH3.
All in all, both ligands bind to HSA, however in different manner.
QuinSH3has two high affinity binding sites (at sites I and II) on al- bumin, while quinH2 shows lower affinity towards the protein. The different affinity of the two types of ligands can be interpreted by the negative charge (− and/or 2−) of quinSH3at pH 7.4 that may con- tribute to the stronger binding on HSA of this ligand over the neutral quinH2. The appropriate Co(III)-complexes of the two ligands do not seem to bind to HSA.
4. Conclusions
Based on their thermodynamic stability, kinetic inertness and redox features the synthesized quinizarin-containing ternary cobalt(III) com- plexes may serve as models for anthracycline type drug chaperons being able to selectively release the drug molecules in hypoxic cancer tissues.
Structural characterization of the complexes supports the formation of dinuclear species being present in various binding isomers. For1the presence of two symmetrical and one asymmetrical isomer was con- fimed by detailed NMR studies. Cyclic voltammetric results indicate redox activity of the ligands quinH2and quinSH3. At the same time for the Co(III) complexes further reversible processes were detected.
Reversible reduction for the tren containing complexes occurs in the potential range of biological relevance (−200 to −400 mV). HSA binding studies of the free ligands as well as the Co(III) complexes re- vealed that quinSH3interacts with hydrophobic pockets site I and II of the protein, while for quinH2a significantly lower affinity towards the protein was demonstrated. On the contrary, complexes 1–4 did not exhibit significant binding to HSA. Based on the reduction potential values the studied complexes may selectively be reduced under hypoxic conditions and both the quin (or anthracycline) ligands and the Co(II) formed, by initiating ROS formation, can exert they biological effect.
Currently further biological studies are in progress with the novel ternary complexes to obtain further information on their in vitro effi- cacy.
Declaration of competing interest
The authors declare no conflict of interest.
Acknowledgement
The research was supported by the EU and co-financed by the European Regional Development Fund under the projects GINOP-2.3.2- 15-2016-00008, GINOP-2.3.2-15-2016-00038 and the Hungarian
Scientific Research Fund (OTKA K112317, FK 124240) and the ÚNKP- 19-3-I-DE-45, ÚNKP-19-3-I-DE-56 New National Excellence Program of the Ministry for Innovation and Technology.
Appendix A. Supplementary data
Supplementary data to this article can be found online athttps://
doi.org/10.1016/j.jinorgbio.2019.110963.
References
[1] D. Agudelo, P. Bourassa, G. Bérubé, H.A. Tajmir-Riahi, J. Photochem. Photobiol.
158 (2016) 274–279.
[2] P. Ma, R.J. Mumper, J. Nano Today 8 (2013) 313–331.
[3] C. Carvalho, R.X. Santos, S. Cardoso, S. Correia, P.J. Oliveira, M.S. Santos, P.I. Moreia, Curr. Med. Chem. 16 (2009) 3267–3285.
[4] G. Minotti, P. Menna, E. Salvatorelli, G. Cairo, L. Gianni, Pharmacol. Rev. 56 (2004) 185–229.
[5] S. Goto, Y. Ihara, Y. Urata, S. Izumi, K. Abe, K. Toji, T. Kondo, FASEB J. 15 (2001) 2702–2713.
[6] F. Yao, J. Duan, Y. Wang, Y. Zhang, Y. Guo, H. Guo, X. Kang, Anal. Chem. 87 (2015) 338–342.
[7] D. Agudelo, P. Bourassa, M. Beauregard, G. Bérubé, H.A. Tajmir-Riahi, PLoS One 8 (2013) 1–8 (e69248).
[8] S. Zhang, X. Liu, T. Bawa-Khalfe, L.S. Lu, Y.L. Lyu, L.F. Liu, E.T. Yeh, Nat. Med. 18 (2012) 1639–1642.
[9] P.S. Guin, S. Das, P.C. Mandal, Int. J. Electrochem. Sci. 3 (2008) 1016–1028.
[10] H. Muhammed, T. Ramasarma, C.K.R. Kurup, Biochim. Biophys. Acta 722 (1982) 43–50.
[11] E. Goormaghtigh, J.M. Ruysschaert, Biochim. Biophys. Acta 779 (1984) 271–288.
[12] E.J.F. Demant, Eur. J. Biochem. 137 (1983) 113–118.
[13] E.J.F. Demant, P.K. Jensen, Eur. J. Biochem. 132 (1983) 551–556.
[14] Y. Iwamoto, I.L. Hansen, T.H. Porter, K. Folkers, Biochem. Biophys. Res. Commun.
58 (1974) 633–638.
[15] T. Goodman, P. Hoschstein, Biochem. Biophys. Res. Commun. 77 (1977) 797–803.
[16] E. Bachmann, E. Weber, G. Zbinder, Agents Actions 5 (1975) 383–393.
[17] V.J. Ferrans, Cancer Treat. Rep. 62 (1978) 955–961.
[18] K.D. Mjos, J.F. Cawthray, G. Jamieson, J.A. Fox, C. Orvig, Dalton Trans. 44 (2015) 2348–2358.
[19] E. Gammella, F. Maccarinelli, P. Buratti, S. Recalcati, G. Cairo, Front. Pharmacol. 5 (2014).
[20] Y. Octavia, G.C. Tochetti, L.K. Gabrielson, S. Janssens, J.H. Crijns, L.A. Moens, J.
Mol. Cell. Cardiol. 52 (2012) 1213–1225.
[21] M. Sterba, O. Popelova, A. Vavrova, E. Jirkovsky, P. Kovarikova, V. Gersl, Antioxid.
Redox Signal. 18 (2013) 899–929.
[22] H. Beraldo, A. Garnier-Suillerot, L. Tosi, F. Lavelle, Biochemistry 24 (1985) 284–289.
[23] M.M.L. Fiallo, A. Garnier-Suillerot, Biochemistry 25 (1986) 924–930.
[24] M.M.L. Fiallo, A. Garnier-Suillerot, Biochim. Biophys. Acta (Gen. Subject) 840 (1985) 91–98.
[25] M. Feng, Y. Yang, P. He, Y. Fang, Spectrochim. Acta A 56 (2000) 581–587.
[26] P.S. Guin, P.C. Mandal, S. Das, J. Coord. Chem. 65 (2012) 705–721.
[27] S. Maji, B. Sarkar, S.M. Mobin, J. Fiedler, F.A. Urbanos, R. Jimenez-Aparicio, W. Kaim, G.K. Lahiri, Inorg. Chem. 47 (2008) 5204–5211.
[28] A. Mandal, A. Grupp, B. Schwederski, W. Kaim, G.K. Lahiri, Inorg. Chem. 54 (2015) 7936–7944.
[29] D.C. Ware, B.D. Palmer, W.R. Wilson, W.A. Denny, J. Med. Chem. 36 (1993) 1839–1846.
0.0 0.2 0.4 0.6 0.8 1.0
55 130 205 280 355
0 5 10 15
Molar fraction of free ligand
.u.a/mn075taytisnetnI
cHSA/ cligand
(A)
0 25 50 75 100
0 10 20 30
.u.a/mn075taytisnetnI
cHSA/ cligand
(B)
Fig. 6.Intrinsic fluorescence of quinSH3(●) at various HSA concentrations monitored at λEM= 570 nm and calculated molar fractions of the non-bound ligand for hypothesized one- (dashed curve), two- (solid curve) or three- (dotted curve) binding sites in HSA (A). Comparison of the fluorescence quenching curves of quinSH3
(●) and quinH2(Δ) upon addition of HSA (B), clig= 1 μM (quinSH3) or 0.5 μM (quinH2), λEX= 480 nm; pH = 7.40 (PBS), 37 °C. Binding constants used for the model calculations: logK'site-1= 6.14, logK'site-2= 6.45, logK'site-3= 6.30.
[30] J. Jiang, C. Auchinvole, K. Fischer, C.J. Cambell, Nanoscale 6 (2014) 12104–12110.
[31] Z. Tyeklár, R.R. Jacobson, N. Wei, N.N. Murthy, J. Zubieta, K.D. Karlin, J. Am.
Chem. Soc. 115 (1993) 2611–2689.
[32] E. Kimura, S. Young, J.P. Collman, Inorg. Chem. 9 (1970) 1183–1191.
[33] E. Farkas, P. Buglyó, É. Enyedy, M.A. Santos, Inorg. Chim. Acta 357 (2004) 2451–2461.
[34] L. Zékány, I. Nagypál, Plenum Press, (1985) 291–353.
[35] O. Dömötör, S. Aicher, M. Schmidlehner, M.S. Novak, A. Roller, M.A. Jakupec, W. Kandioller, C.G. Hartinger, B.K. Keppler, É.A. Enyedy, J. Inorg. Biochem. 134 (2014) 57–65.
[36] J.R. Lakowicz, Principles of Fluorescence Spectroscopy, 3rd ed., Springer, 2006.
[37] Make Equilibrium Diagrams Using Sophisticated Algorithms,https://www.kth.se/
che/medusa, Accessed on 24 September 2019.
[38] G. Smulevich, L. Angeloni, S. Giovannardi, M.P. Marzocchi, Chem. Phys. 65 (1982) 313–322.
[39] X. Xuan, X. Wang, N. Wang, Spectrochim. Acta A 79 (2011) 1091–1098.
[40] M. Shamsipur, A. Besharati-Seidani, React. Funct. Polym. 71 (2011) 131–139.
[41] D. Nematollahi, A. Sayadi, F. Varmaghani, J. Electroanal. Chem. 671 (2012) 44–50.
[42] P.S. Guin, P. Das, S. Das, P.C. Mandal, Int. J. Electrochem. 2012 (2011) 1.
[43] B. Zinger, J. Electroanal. Chem. 239 (1988) 209–225.
[44] P. Buglyó, I. Kacsir, M. Kozsup, I. Nagy, S. Nagy, A.C. Bényei, E. Kováts, E. Farkas, Inorg. Chim. Acta 472 (2018) 234–242.
[45] M. Kozsup, E. Farkas, A.C. Bényei, J. Kasparkova, H. Crlikova, V. Brabec, P. Buglyó, J. Inorg. Biochem. 193 (2019) 94–105.
[46] J. Peters, All About Albumin, Biochemistry, Genetics, and Medical Applications, Academic Press, 1996.
[47] G. Fanali, A. di Masi, V. Trezza, M. Marino, M. Fasano, P. Ascenzi, Mol. Asp. Med.
33 (2012) 209–290.
[48] G. Sudlow, D.J. Birkett, D.N. Wade, Mol. Pharmacol. 12 (1976) 1052–1061.