1
Comparative studies on the human serum albumin binding of the clinically approved EGFR inhibitors gefitinib, erlotinib, afatinib, osimertinib and the
investigational inhibitor KP2187
Orsolya Dömötöra, Karla Pelivanb, Attila Boricsc, Bernhard K. Kepplerb,d, Christian R.
Kowolb,d*, Éva A. Enyedya*
a Department of Inorganic and Analytical Chemistry, University of Szeged, Dóm tér 7. H-6720 Szeged, Hungary
b Institute of Inorganic Chemistry, Faculty of Chemistry, University of Vienna, Waehringer Strasse 42, 1090 Vienna, Austria
c Institute of Biochemistry, Biological Research Centre, Hungarian Academy of Sciences, Temesvári krt. 62. H- 6726 Szeged, Hungary
d Research Cluster “Translational Cancer Therapy Research”, University of Vienna and Medical University of Vienna, Vienna, Austria
Keywords: tyrosine kinase inhibitors, EGFR, spectrofluorometry, albumin binding, binding constants
* Corresponding authors:
E-mail address: christian.kowol@univie.ac.at (C.R. Kowol), enyedy@chem.u-szeged.hu (É.A. Enyedy).
2 ABSTRACT
Binding interactions between human serum albumin (HSA) and four approved epidermal growth factor receptor (EGFR) inhibitors gefitinib (GEF), erlotinib (ERL), afatinib (AFA), osimertinib (OSI), as well as the experimental drug KP2187 were investigated by means of spectrofluorometric and molecular modelling methods. Steady-state and time resolved spectrofluorometric techniques were carried out, including direct quenching of protein fluorescence and site marker displacement measurements. Proton dissociation processes and solvent dependent fluorescence properties were investigated as well. The EGFR inhibitors were predominantly presented in their single protonated form (HL+) at physiological pH except ERL, which is charge-neutral. Significant solvent dependent fluorescence properties were found for GEF, ERL and KP2187, namely their emission spectra show strong dependence on the polarity and the hydrogen bonding ability of the solvents.
The inhibitors proved to be bound at site I of HSA (in subdomain IIA) in a weak-to- moderate fashion (logK’ 3.9-4.9) using spectrofluorometry. OSI (logK’ 4.3) and KP2187 can additionally bind in site II (in subdomain IIIA), while GEF, ERL and AFA clearly show no interaction here. Docking methods qualitatively confirmed binding site preferences of compounds GEF and KP2187, and indicated that they probably bind to HSA in their neutral forms. Binding constants calculated on the basis of the various experimental data indicate a weak-to-moderate binding on HSA, only OSI exhibits somewhat higher affinity towards this protein. However, model calculations performed at physiological blood concentrations of HSA resulted in high (ca. 90%) bound fractions for the inhibitors, highlighting the importance of plasma protein binding.
3 1. Introduction
Tyrosine kinases are important mediators of signalling cascades playing key roles in diverse biological processes such as cell growth, differentiation, proliferation, apoptosis and migration [1]. Since the beginning of this century, several tyrosine kinase inhibitors (TKI) have been approved for cancer treatment including the class of epidermal growth factor receptor (EGFR, also referred as erbB1, Her1) inhibitors. The EGFRs represent a subfamily of tyrosine kinases and the deregulation of this receptor network is well recognized as oncogenic driver of various cancer types [1,2]. Gefitinib (GEF, Iressa®) was the first selective inhibitor drug of the tyrosine kinase domain of EGFR approved in 2003 for the treatment of advanced or metastatic non-small-cell lung cancer (NSCLC) [3]. Similarly to GEF, Erlotinib (ERL, Tarceva®) is a reversible inhibitor of EGFR and binds at the ATP binding site of the receptor. It is utilised for the first-line treatment of EGFR-mutant NSCLC and pancreatic cancer [3]. Afatinib (AFA, Gilotrif®) containing an acrylamide reactive group was the first irreversible inhibitor of EGFR, which was approved by the FDA in 2013 with similar indications as the former two compounds [4]. Unfortunately, cancer patients frequently become resistant to these inhibitors, which initiated their further development. The third- generation inhibitor osimertinib (OSI, Tagrisso®) has been specifically developed for EGFR- gene mutated (T790M) cancers being resistant against the other EGFR inhibitors and was approved in 2017 [4]. EGFR inhibitors are orally administered drugs and enter systemic circulation via the bloodstream. Consequently, the impact of plasma protein binding is of high importance concerning drug distribution, elimination or drug efficacy [5]. Notably plasma half-lives of the EGFR inhibitors GEF, ERL and AFA in patients range from 36 to 48 h and extensive plasma protein binding (>90%) was reported [6-8], whereas for OSI only high plasma protein binding was assumed [9]. Thus, thorough investigation of the nature and primary binding sites on the plasma protein might represent an important issue for the understanding and comparison of the pharmacological activity and the pharmacokinetic behavior of these therapeutic agents.
Human serum albumin (HSA) is the most abundant plasma protein with a concentration of ~630 μM [10]. This protein serves as a transport vehicle for a wide variety of endogenous compounds such as fatty acids, bilirubin, metal ions, but also for a variety of pharmaceutical compounds. HSA is a single chain globular protein comprising three structurally homologous domains (I, II and III), each consisting of two subdomains (A, B). The principal binding sites are located in the hydrophobic pockets in subdomains IIA and IIIA forming site I and II, respectively (according to Sudlow’s classification) [10,11]. A third binding pocket within subdomain IB (site III) has recently been identified which is considered as the third major binding site [12]. Besides HSA, alpha acid glycoprotein (AAG) has been identified as a potent binder of some TKIs including GEF and ERL [13-21]. At the same time its impact on the serum protein bound fraction of most TKIs was claimed to be insignificant compared to the
4 binding capacity of HSA that is present in 20–30-fold excess compared to AAG (20–30 μM) in the human blood [13]. Albumin binding of GEF, ERL and AFA was previously investigated by other research groups by means of spectrofluorometry, circular dicroism, NMR- and Fourier transform infrared spectroscopy, isothermal titration calorimetry, affinity chromatography and molecular modelling. The type of albumin used in these studies was not identical; some used bovine serum albumin (BSA) while others did HSA. Moreover, the location of the binding sites and calculated binding constants showed considerable variance depending mainly on the different (and sometimes questionable) methodological settings and experimental conditions [13-21]. For OSI a high affinity to HSA is merely assumed [9].
Therefore, we aimed to study the interaction of OSI and the experimental drug KP2187 from our group (Chart 1) with HSA and to compare the data with the three approved EGFR inhibitors GEF, ERL and AFA to generate a data set with the same experimental conditions for all drugs. We included the experimental drug KP2187 as it exerts considerable antiproliferative activity and EGFR inhibitory effects on various cancer cell lines including ERL resistant H1975 cells [22]. Herein we report on an extensive comparative study of the EGFR inhibitors regarding their proton dissociation processes, fluorescence properties and their HSA binding affinities investigated by means of UV-Vis spectrophotometry and spectrofluorometric techniques. The experimental data are complemented by molecular modelling calculations.
Chart 1. Chemical structures of the EGFR inhibitors investigated in this work.
2. Materials and Methods 2.1. Chemicals
All solvents were of analytical grade and used without further purification. KCl, NaCl, HCl, KOH, dimethyl sulfoxide (DMSO), NaH2PO4 and Na2HPO4, warfarin (WF),
gefitinib erlotinib afatinib
osimertinib KP2187
5 dansylglycine (DG), HSA containing fatty acids (A8763) and fatty acid free (A1887) were purchased from Sigma Aldrich. Osimertinib (OSI) was purchased from Atomole Scientific, afatinib maleate (AFA-mal) from Chemscene, erlotinib (ERL) hydrochloride, gefitinib (GEF), and afatinib (AFA) free base from LC laboratories all in >98% purity. KP2187 [22] and dansyl sarcosine (DS) [23] were synthesized according to literature. Doubly distilled Milli-Q water was used for sample preparation. Samples for albumin binding studies were prepared in phosphate buffered saline (PBS) at pH 7.40. HSA solution and solutions of WF and DG were prepared as described previously [24,25]. Stock solution of DS was prepared on a weight-in- volume basis and its molar absorbance was determined (328nm = 4397 M−1cm−1).This value was used to estimate the concentration of subsequent stock solutions. Slightly acidic stock solutions (c = 0.2‒1 mM; pH ~3) of the inhibitors were prepared and their concentrations and molar absorptivities were determined based on a weight-in-volume basis (see details in Section S1/Table S1). In HSA binding experiments these stocks were diluted with PBS to get our working solutions (c = 50‒200 μM, pH = 7.40).
2.1. UV–Vis spectrophotometric, spectrofluorometric and pH-potentiometric studies:
determination of pKa values and spectral characteristics in various solvents
The pH-dependent titrations were performed over the pH range 2.0–11.5 at 25.0 ± 0.1 °C and an ionic strength of 0.10 M (KCl) for keeping the activity coefficients constant.
The titrations were performed with carbonate-free KOH solution (0.10 M) and its exact concentration was determined by pH-potentiometric titrations. Samples were degassed by bubbling purified argon through them for ~10 min prior to the measurements and was passed over the solutions during the titrations. The pH-potentiometric titration of KP2187 was performed according to the standard approach used in our previous works [26-28].
A Hewlett Packard 8452A diode array spectrophotometer was used to record the UV–
Vis spectra in the interval 200–800 nm. The path length (l) was 1 or 2 cm. The initial volume of the samples was 10.0 or 20.0 mL and the compound concentrations were 5, 10 or 50 µM.
The pH-dependent fluorescence measurement for KP2187 was carried out on a Hitachi- 4500 spectrofluorometer at 10 μM concentration with an excitation wavelength (λEX) of 370 nm. The emission spectra were recorded in a 1×1 cm quartz cell at 25.0 ± 0.1 °C.
The proton dissociation constants and the UV–Vis or fluorescence emission spectra of the individual species in the various protonation states were calculated by deconvolution of the spectra recorded in the pH range from 2.0 to 11.5 with the computer program PSEQUAD [29]. The calculations were always made from the experimental titration data measured in the absence of any precipitate in the solution.
Fluorescence and UV-Vis spectra were recorded in n-hexane, benzene, n-octanol, ethanol, methanol and water (at pH 7.40 and 11.0) at 1 or 5 μM compound concentration.
Compounds were directly dissolved in the solvents or 10 mM stock solutions in methanol
6 were prepared and stepwise diluted with the appropriate solvent to obtain the desired concentration.
2.2. Lipophilicity
Distribution coefficient (D7.4) value of KP2187 was determined by the traditional shake-flask method in n-octanol/buffered aqueous solution at pH 7.40 (PBS) at 25.0 ± 0.2 °C as described previously [30]. The ligand was dissolved in n-octanol pre-saturated aqueous solution of the buffer at 50 M concentrations.
2.3. Interaction with HSA
2.3.1. Spectrofluorometric steady state measurements
Fluorescence measurements were carried out on a Fluoromax-4P (Horiba Jobin Yvon) and on a Hitachi 4500 spectrofluorometer. Samples were measured in 1×1 cm cells at 37°C.
All samples were prepared in PBS (pH 7.40) and were incubated for 1 h at 37 °C.
Samples usually contained 1 μM HSA and various HSA-to-compound ratios (up to 1:30) were used. In the site marker displacement experiments, the HSA-to-site marker (WF, DG or DS) ratio was 1:1 and the concentration of the EGFR inhibitors was varied from 0 to 30 μM. In some cases the HSA–EGFR inhibitor (1:1) containing samples (cHSA = 1 or 10 μM) were titrated by site markers (up to 30 equivalents). The excitation wavelengths were 295, 310, 340, 370 or 400 nm depending on the type of experiment and the emission intensity was collected in the range 310–650 nm (see Table S2 for details). The conditional binding constants were calculated with the computer program PSEQUAD [29] as described in our previous works [24,31]. Data presented are the mean value ± standard deviation of at least two independent assays.
Job’s method was also used to estimate binding stoichiometry between HSA and ERL, GEF or KP2187. The total concentration was constant (10 μM) and the HSA-to-compound ratio was varied.
3D spectra were recorded between 230–500 nm excitation and 250–550 nm emission wavelengths.
Corrections for self-absorbance and inner filter effect were necessary in the steady-state fluorometric experiments since the emitted light was partly absorbed by the compounds.
Corrections were carried out according to equation (1) [32], 𝐼𝑐𝑜𝑟𝑟 = 𝐼𝑚𝑒𝑎𝑠× 10(𝐴𝐸𝑋+𝐴𝐸𝑀) 2⁄ (1)
7 where Icorr and Imeas are the corrected and measured fluorescence intensities, AEX and AEM are the absorbance values at the excitation and emission wavelengths in the samples, respectively.
2.3.2. Time-resolved fluorescence measurements
Fluorescence lifetime for KP2187 was measured using a nanoLED N-370 (EM = 440 nm) light source (Horiba Jobin Yvon) using FluoroHub-B time correlated single-photon counting (TCSPC) system. The resolution of the detection system was 50 ps. The number of counts on the peak channel was 10,000. The number of channels per curve used for the analysis was ~1,400 with a time scale of 0.05487 ns/channel. Ludox® (from Sigma-Aldrich) was used as the scatter to obtain the instrumental response function. The background (obtained with the blank sample) was subtracted from the decay. The program DAS6 (version 6.6.; Horiba, Jobin Yvon) was used for analysis of the experimental fluorescence decays. The fluorescence intensity decay over time is described by a sum of exponentials,
𝐼(𝑡) = ∑𝑛𝑖=1𝛼𝑖𝑒𝑥𝑝 (−𝑡𝜏
𝑖) (2)
where i and i are the normalized amplitude and lifetime of component i respectively.
From these parameters, the fraction of emitted light by each component i can be calculated through
𝑓𝑖 = 𝛼𝑖𝜏𝑖
∑(𝛼𝑖𝜏𝑖) (3)
The quality of the fit was judged from a 2R value close to 1.0 and a random distribution of weighted residuals.
2.3.3. Ultrafiltration
Ultrafiltration/UV-Vis measurements were performed with AFA, OSI and KP2187.
Samples were prepared in PBS containing 50 µM compound. Two different types of Millipore filters were used for separation: Amicon Ultra-0.5 (cutoff: 10 kDa) and Centrifree Ultrafiltration Device (cutoff: 30 kDa). 0.5 or 1.0 mL portions were filtered with an Eppendorf MiniSpin plus centrifuge (relative centrifugal force ~8000 g, 5–10 min) and the UV-Vis spectrum of the filtrate (‘low molecular mass (LMM)’ fraction) was compared to the reference spectra of the original sample.
2.4. Molecular docking
X-ray crystallographic structures of HSA in complex with WF (site I, PDB code:
2BXD [33]) 3-carboxy-4-methyl-5-propyl-2-furanopropanoic acid (CMPF, site II, PDB code:
8 2BXA [33]) and 4Z,15E-bilirubin-IXα (bilirubin, site III, PDB code: 2VUE [34]) were used as docking targets, after missing amino acid side chains were reconstructed using the Swiss- PDBViewer [35]. Amino acid side chains of HSA within 5 Å from any atom of the bound compounds in the crystal complexes were kept flexible as well as all ligand torsions to simulate 'induced fit' binding mechanism. All ligands were docked in both neutral and single protonated states. Non-polar hydrogens of ligands were merged with the connected carbon atoms. Fixed partial atomic charges were assigned using the Gasteiger method, preserving the net charge corresponding to the protonation state of the ligands. Re-docking of WF, CMPF and bilirubin for the validation of binding sites, as well as flexible docking of GEF and KP2187 to all three sites were performed using the Autodock 4.2 software and the Lamarckian genetic algorithm in a 80 Å x 80 Å x 80 Å grid volume with 0.375 Å grid point spacing. 1000 dockings were done for all compounds and protein binding sites. The resulting ligand-protein complexes were clustered to eliminate duplicate binding poses and then ranked according to their corresponding binding free energies.
3. Results and discussion
3.1. Proton dissociation processes and lipophilicity of the EGFR inhibitors
The proton dissociation constants (pKa) of the approved EGFR inhibitors can be found in the ‘Product monographs’ of their pharmaceutical formulations on the homepages of the respective companies. [6-9]. However, these documentations often do not contain the measurement conditions such as solvent or the applied ionic strength. In addition, the data sometimes differ significantly. Therefore we measured pKa values of these EGFR inhibitors and KP2187 under the same experimental setup (I = 0.1 M KCl), to generate comparable data at physiologically relevant conditions. All calculated pKa values of the five different EGFR inhibitors are listed in Table 1.
0.0 0.1 0.2 0.3
230 280 330 380 430
Absorbance
/ nm
0 10000 20000 30000
230 330
/ M-1cm-1
/ nm H2L2+
L HL+
2.12
10.87
9 Fig. 1. UV–Vis absorbance spectra of AFA recorded at various pH values. Inset shows the individual molar absorbance spectra of the inhibitor in different protonation states denoted as H2L2+, HL+ and L {clig = 5 μM; l = 2 cm; T = 25 °C; I = 0.10 M (KCl)}.
Fig. 1 shows the UV-Vis absorbance spectra of AFA recorded in the pH range 2–11.5.
The spectra change considerably between pH 4.0 and 6.5, which can be attributed to the deprotonation of the quinazolinium NH+. The second step is followed by smaller spectral changes due to the deprotonation of the terminal NMe2H+ moiety situated far from the chromophore moiety. Similar behavior was found for the other four inhibitors (except ERL that possesses only one dissociable proton in the studied pH range).
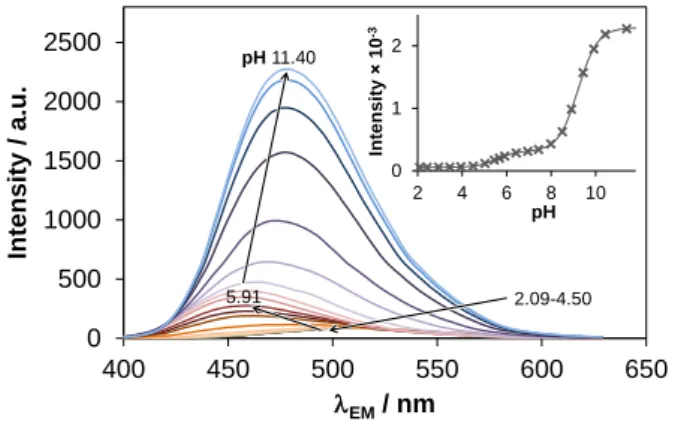
The relatively good water solubility and fluorometric activity of KP2187 allowed us to determine its pKa values additionally by both pH-potentiometric and spectrofluorometric titrations. Emission spectra of KP2187 recorded at various pH values are shown in Fig. 2. The first deprotonation process (pH 4–7) resulted in a blue shifted emission maximum (456 nm (HL+) vs. 506 nm (HL2+)) and somewhat elevated intensity. On the other hand, the second proton dissociation step (pH 7–10) was accompanied by a red shift (λEM(max) 477 nm) and strongly increased emission intensities in contrast to the only slight alteration of the UV-Vis spectra in the same pH range (Fig. S1). Probably the formation of the charge neutral L species reduces the efficacy of non-radiative relaxation processes resulting in a high increase of the fluorescence signal [32]. The data obtained with pH-potentiometric and spectrofluorometric titrations are in good agreement with the results of the spectrophotometric titration (Table 1).
Fig. 2. Fluorescence emission spectra of KP2187 measured at various pH values. Inset shows intensity changes at 477 nm {clig = 10 μM; EX = 370 nm; T = 25 °C}.
It was found that the first pKa of the EGFR inhibitors bearing a quinazoline ring varies within 5.05 and 5.58, whereas the trend of the ligand basicities is: AFA < GEF < ERL <
KP2187. In case of OSI pKa1 was previously attributed to the aniline-like nitrogen [9]. Instead
0 500 1000 1500 2000 2500
400 450 500 550 600 650
Intensity / a.u.
EM/ nm
0 1 2
2 4 6 8 10
Intensity 10-3
pH pH11.40
2.09-4.50 5.91
10 deprotonation of a pyrimidinium NH+ is more likely as the first step (Fig. S2) [36]. The second pKa is characteristic for aliphatic nitrogens, namely NMe2H+ in AFA and OSI, NH3+ in KP2187 and NmorpholineH+ in GEF. Calculated acidity constants are in reasonable agreement with data reported in literature (see Table 1). The knowledge of these dissociation constants allowed us to compute fractions for the actual protonation states at physiological pH (Table 1).
Lipophilicities of the approved inhibitors are already reported in the literature but not for KP2187. Table 1 comprises the measured and reported distribution coefficients (logD7.40) at pH 7.40. All compounds appear to be highly lipophilic, with a somewhat lower lipophilicity in case of KP2187.
Table 1. Proton dissociation constants (pKa) of the studied inhibitors determined by UV-Vis spectrophotometry, calculated distribution (%) of the species in different protonation states at physiological pH (pH 7.40) and the distribution coefficients (logD7.40) at pH 7.40 {T = 25 C;
I = 0.1 M (KCl)}.
GEF ERL AFA KP2187 OSI
pKa1 5.27 ± 0.02 lit: 5.4 [6]
5.38 ± 0.02 lit: 5.6 [7]
5.05 ± 0.03 lit: 5.0 [8]
5.58 ± 0.01 5.56 ± 0.01b 5.56 ± 0.01c
4.74 ± 0.01 lit: 4.4 [9]
pKa2 8.00 ± 0.05 lit: 7.2 [6]
- 8.80 ± 0.02 lit: 8.2 [8]
9.20 ± 0.06 9.21 ± 0.01b 9.21 ± 0.02c
8.99 ± 0.05 lit: 9.5 [9]
Protonation states at pH 7.40 (%)
H2L2+ - - - 1.5 -
HL+ 80 1 96 97 97
L 20 99 4 1.5 3
logD7.40 lit: 2.5a lit: 2.9 [7] lit: 3.8 [8] 1.86 ± 0.03 lit: 3.4 [9]
a Calculated from logP = 3.2 reported in Ref. [37] (logD = logP + log(molar fraction of L)).
b Determined by spectrofluorometric titrations. c Determined by pH-potentiometric titrations.
3.2. Fluorescence properties of the inhibitors
The knowledge of the fluorescence properties of the studied EGFR inhibitors is essential as protein binding studies often use fluorescence based techniques. Consequently, solvent dependent fluorescence properties of the different EGFR inhibitors were investigated.
11 Among the five studied EGFR inhibitors only KP2187 exerts measurable fluorescence emission in aqueous solution as shown in Fig. 2. The four approved inhibitors displayed negligible fluorescence in aqueous solution at any protonation state. However, ERL and GEF were reported to be fluorescent in some non-aqueous solvents [38]. We measured the fluorescence properties of the inhibitors in the organic solvents such as n-hexane, benzene and n-octanol. The relative emission intensities and positions of λ(max) in the emission, excitation and absorption spectra are listed in Table 2.
Table 2. Relative fluorescence intensities and (max) values of the emission, excitation and absorption spectra of ERL, GEF and KP2187 recorded in various solvents (T = 25 °C) and in the presence of HSA.
solvent relative
intensitya
λEM(max) (nm)
λEX(max) (nm)
λAbs(max) (nm)
ERL
n-hexane 1.00 372 328, 340 332, 344
benzene 0.38 423 334, 342 336, 346
n-octanol 0.07 400–470b 337, 344 336, 346
water pH 7.40 - - - 332
HSAc - 380–400b 336, 347 -
GEF
n-hexane 1.00 368 330, 341 332, 344
benzene 0.30 446 332, 342 332, 340
n-octanol 0.08 390–450b 334, 343 334, 344 water pH 11.0
pH 7.40
- -
- -
- -
330 330
HSAc - 378 334, 347 -
KP2187
n-hexane 0.002 416 370 -
n-octanol 1.000 449 383 378
ethanol 0.264 452 378 378
methanol 0.226 452 378 378
water pH 11.0 pH 7.40
0.019 0.003
477 457
366 370
368 368
HSAc - 441 372 -
12
a Compared to the most emissive form of each compound and calculated from the intensities measured at λEM(max) and λEX(max), b Broad plateau . c Recorded in the presence of 5 eq. HSA in aqueous solution at pH 7.40 (PBS) and at 37 °C.
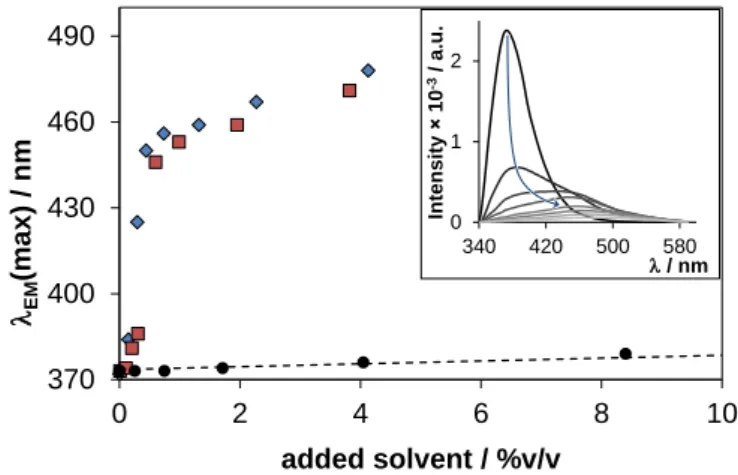
The emission maximum of ERL is shifted to higher wavelength and the peak intensity is lower in benzene compared to n-hexane (EM(max) = 423 nm and 372 nm, respectively). This red shift and intensity loss are even more pronounced in n-octanol (Table 2 and Fig. S3). The anomalous and broad emission band in n-octanol may indicate specific solvent-solute interaction(s) [32,39]. Fig. 3 represents large red shift of λEM(max) of ERL dissolved in n- hexane upon addition of ca. 1% methanol or ethanol. Most probably interaction via hydrogen bonding occurs between ERL and the alcohols [39].While benzene causes only a gradual shift in λEM(max), corresponding to general solvent effect. The shape of the excitation spectra was rather similar in all solvent(s) or solvent mixture(s) displaying a doubled excitation peak in accordance with the absorbance spectra measured in the same solvents (Table 2 and Fig. S4).
Fig. 3. Effect of solvent mixture composition on the emission maximum (max)) of ERL, dissolved in n-hexane with indicated amounts of methanol (♦), ethanol (■) or benzene (●) added. The dotted line depicts the gradual increase of the max) (R2 = 0.997, and the linearity remains up to 100% benzene content). Inset shows the spectral changes upon addition of methanol {clig = 1 μM; EX = 334 nm; T = 25 °C}.
The same solvent dependent behavior and spectral characteristics were found for GEF (Table 2). The fluorescence of ERL and GEF in pure ethanol and methanol was negligible.
Notably, our data in ethanol and n-hexane are in contrast to the observations of Trummer et al., where ERL and GEF proved to be moderately emissive in ethanol and weakly in n- hexane. However, their spectra were recorded at 15-fold higher concentration compared to levels used in our studies and emission was not monitored below 390 nm [38] although we found the emission maxima in n-hexane at ~370 nm.
370 400 430 460 490
0 2 4 6 8 10
EM(max)/ nm
added solvent / %v/v
0 1 2
340 420 500 580 Intensity 10-3/ a.u.
/ nm
13 KP2187 displays considerably different fluorescence behavior compared to ERL and GEF. Specific effect of hydrogen bonding solvents was observed here as well (Table 2 and Fig. S5), but measured intensities revealed an unusual pattern. Relatively weak fluorescence observed in water (for the neutral form at pH 11) largely increases in alcohols, in the order of water << methanol < ethanol << n-octanol, but the compound exerts only a minimal fluorescence in n-hexane. This behavior is most probably due to an inversion of the electronic transition (n→π* vs. π→π*). Namely, in non-polar aprotic solvents relaxation is originated mainly from the n-π* state via radiationless processes, while emission occurs with high efficiency from the lowest excited state π-π* in hydrogen bonding solvents [39].
Summarizing, the fluorescence properties of ERL, GEF and KP2187 proved to be primarily dependent on the hydrogen bonding ability and polarity of their environment. AFA and OSI were non-fluorescent in all types of media used above. These findings are important concerning the interpretation of the fluorescence spectra recorded in the presence of HSA.
3.3. Albumin binding: fluorometric studies
The reason for the choice of spectrofluorometric techniques to investigate the HSA binding of the selected EGFR inhibitors is their generally poor water solubility at pH 7.40.
Ultrafiltration, a powerful tool to examine global binding events on a protein proved to be useless in our case, since even AFA and KP2187 (the two compounds with relatively good water solubility) stacked on the filter in 20–85% depending on the type of filter used. Often UV-Vis spectrophotometry is utilised to follow protein adduct formation processes. We also recorded such UV-Vis spectra of the inhibitors in the presence of HSA, which revealed weak but sometimes tendentious spectral alterations in some cases; while UV-Vis spectra recorded for the OSI–HSA system did not provide convincing evidence of any interaction (spectra shown for ERL–HSA and OSI–HSA systems in Fig. S6).
3.3.1. Fluorometric studies via the intrinsic fluorescence of GEF, ERL and KP2187
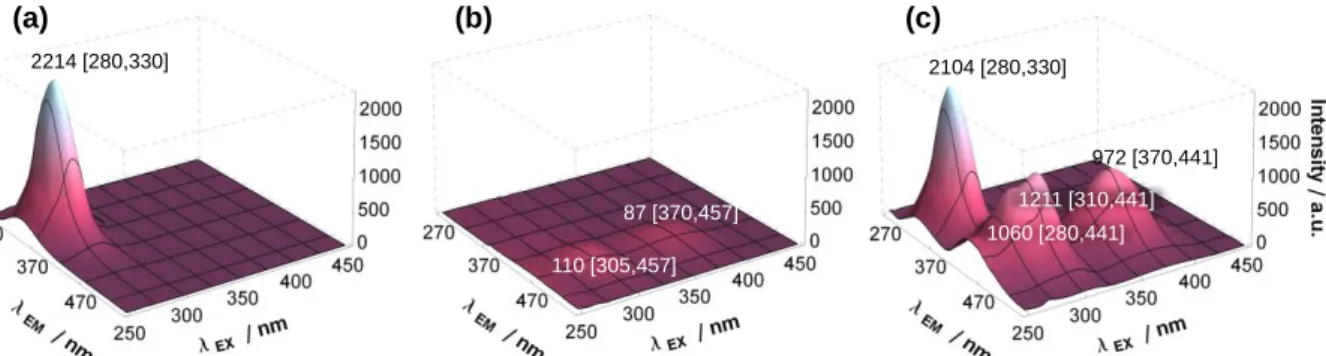
As described in Section 3.2 the inhibitors GEF, ERL and KP2187 were proved to be intrinsically fluorescent under certain conditions. Thus, the changes of their fluorescence properties were studied in the presence of HSA. First the binding kinetics of the interaction with HSA were investigated, the equilibria were reached within few minutes. Incubation time of 1 h was used for all samples. The 3D fluorescence spectra in Fig. 4 recorded for HSA and/or KP2187 depict the effect of HSA on the fluorescence of KP2187 and vice versa. It is clearly observable that the emission peak of HSA at λEM = 330 nm (that originates mainly from the tryptophan at position 214 (Trp214) near to site I in subdomain IIA) is slightly decreased in the presence of five equivalents of KP2187, which is a result of the binding of
14 this compound near to site I. On the other hand the emission intensity of KP2187 is increased up to ~10 fold in the presence of HSA.
Fig. 4. 3D fluorescence spectra of (a) HSA, (b) KP2187 and (c) the HSA–KP2187 (1:5) system. Peak intensities and wavelength coordinates (I [λEX, λEM]) are indicated in the figure {cHSA = 1 µM; cKP2187 = 5 µM; T = 37 °C; pH = 7.40 (PBS); the spectra are corrected by self- absorbance and inner filter effect}.
These observations are a typical case of the (fluorescence) resonance energy transfer (often mentioned as FRET, or more correctly RET) phenomenon. The emission of the donor (HSA in our case) decreases while its electronic energy is transferred to the acceptor molecule (KP2187). The latter compound emits the excess energy as light (or its non-radiative relaxation can take place as well) [32,39]. Proper orientation and distance of the donor and acceptor and spectral overlap between the emission of the donor and absorption spectra of the acceptor moieties are required criteria of RET. The latter is fulfilled for the HSA–KP2187 system (Fig. S7/a). And Fig. 4c provides a more convincing evidence for RET with the appearance of an extra ‘cross peak’ at λEX 280 nm/λEM 441 nm: the energy of the exciting light should be absorbed by HSA (at λEX 280 nm) than transferred to and emitted by KP2187 (λEM 441 nm). The appearance of RET is considered as a proof for the binding of KP2187 on HSA nearby Trp214. Comparing the emission maximum of KP2187 in the presence of HSA (441 nm) to the values recorded in various solvents (Table 2) it can be seen that they are rather blue shifted compared to the aqueous or alcoholic solvents. Additionally, the intensity increased considerably in comparison with the aqueous solution at pH 7.40 (or even at pH 11). These findings refer to the existence of at least one (mainly non-polar i.e. hydrophobic) binding site, where hydrogen bonding occurs between KP2187 and corresponding amino acid side chains (eg. with imidazole-, carboxylate-, hydroxyl groups). The protonation state of the bound KP2187 could not be determined based on its spectral characteristics, although binding in neutral form is probable under these conditions taking into consideration that HSA possesses binding pockets for mainly neutral or negatively charged compounds [10,40].
2214 [280,330]
110 [305,457]
87 [370,457]
2104 [280,330]
1060 [280,441]
972 [370,441]
1211 [310,441]
(a) (b) (c)
15 Similarly to KP2187, ERL and GEF become highly fluorescent in the presence of HSA.
Emission spectra of ERL and GEF show an irregular prolate shape similar to that recorded in n-octanol or in n-hexane/methanol mixtures (Figs. 3, S3). λEX(max) values fall between the maxima recorded in n-hexane and benzene denoting again hydrophobic binding pocket(s) which provide hydrogen bonding interaction(s). Kabir et al. came to the same conclusion by careful analysis of thermodynamic parameters derived from the GEF–HSA interactions [14].
Appearance of RET is highly probable in case of GEF and ERL: required spectral overlap is fulfilled (Fig. S7b) and 3D spectra imply the appearance of the ‘cross peaks’ (Fig S8;
although they are not that well separated as in case of KP2187). Interestingly induced fluorescence of ERL and GEF upon binding to albumin was not reported previously, probable reasons are that (i) in some studies BSA was used that possesses a somewhat different structure compared to that of HSA [15,18,19], or (ii) incorrectly this fluorescence was attributed to HSA [14]. Corrections by the absorbance are strongly recommended also in case of 3D spectra (one example is represented in Fig. S8), otherwise non-corrected data can easily lead to false conclusions.
In order to estimate the binding stoichiometry of the HSA adducts formed with ERL, GEF and KP2187 Job’s method was applied. Fairly uncertain results were obtained, which might be explained by the relatively weak binding affinity of the compounds towards HSA.
Our model calculations proved the limited availability of Job plot in case of binding affinities where logK’ < 6 (see details in SI/Section S2 and Fig.S14). Another possibility in case of the fluorescent KP2187 was to measure fluorescence lifetime decays. Lifetime measurements might provide information not only about the number of emitting species with different lifetimes but also about their quantitative contribution to the measured steady-state fluorescence and potentially their quantity in a sample. KP2187 alone displayed a very short lifetime at pH 7.40, that could not been separated from the scattered light component (Fig. 5), it is under the detection limit of this technique (<50 ps). In contrast, in the KP2187–HSA system (Fig. 5) the fluorescence intensity decay can be described very well by a sum of three exponentials. The lifetime of free KP2187 (τ1 = 30 ps) was kept constant and the two further lifetimes were fitted, which were widely independent of the various KP2187-to-HSA ratios as shown in Fig. 6. Mean lifetime values are τ2 = 4.8 ± 0.4 ns and τ3 = 10.1 ± 0.1 ns for these species. Pre-exponentials (α values, relative amplitudes) holding quantitative information became fairly uncertain, since the relative amplitude of the τ1 component incorporates the scattered light as well. Thus, we could correlate only pre-exponentials of the HSA bound species to each other by calculating α’ values presented in Fig. 6, where α’2 = α2 / (α2 + α3) and α’3 + α’2 = 1. These α’ values (i.e. the ratio of the two HSA bound forms) seem to be independent of the various KP2187-to-HSA ratios. Namely the binding affinities of the two forms are within approximately one order of magnitude. In summary, lifetime measurements
16 revealed and confirmed: (i) binding of KP2187 to HSA and (ii) the plausible existence of two accessible binding sites (iii) whose binding affinities are similar to each other.
Fig. 5. Intensity decay of the fluorescence emission of (a) HSA–KP2187 1:1 and (b) 1:10, (c) KP2187 alone and (d) only the scatter {cHSA = 10 (a) or 1 (b) μM; cKP2187 = 10 μM; λEX = 370 nm; λEM = 440 nm; T = 37 °C; pH = 7.40 (PBS)}. Bottom: residuals plot for the fitting of each decay in the HSA containing systems with a sum of three exponentials (τ1 = 30 ps (fixed); τ2 = 4.8 ns; τ3 = 10.1 ns).
Fig. 6. Fitted lifetime values τ2 and τ3 and normalized amplitudes α’2 and α’3 (where α’3 + α’2 = 1) at various KP2187-to-HSA ratios. τ1 = 30 ps was kept constant {cHSA = 1-10 µM, cKP2187 = 1-10 µM; EX = 370 nm; EM = 440 nm; T = 37 °C; pH = 7.40 (PBS)}.
The effect of fatty acid free HSA on the fluorescence properties of KP2187 was investigated as well, and no considerable differences could be observed between the fluorescence spectra of KP2187 recorded at various ratios with both types of albumin.
Unfortunately the LED light source (λEX = 370 nm) of the instrument could excite GEF and ERL only in their red edge excitation region. Poor quality of the preliminary decay curves
1 10 100 1 000 10 000
10 20 30 40 50
Counts
-6 0 6
10 20 30 40 50
Res.
Time / ns
(a) (b) (d) (c) 103
104
102 101 100
4.0 6.0 8.0 10.0
0 2 4 6 8 10
/ ns
0.0 0.5 1.0
0 2 4 6 8 10
'
cKP2187/ cHSA
’2
’3
3 = 10.1 ns
-
2= 4.8 ns
-
17 recorded for HSA‒ERL and HSA‒GEF samples hindered further detailed characterisation of these systems.
3.3.2. Binding at site I and II: Trp quenching and site marker displacement studies
Our studies revealed the binding of ERL, GEF and KP2187 on HSA, thus we aimed to explore the location of the binding sites and to gain information about the binding of the non- fluorescent compounds AFA and OSI.
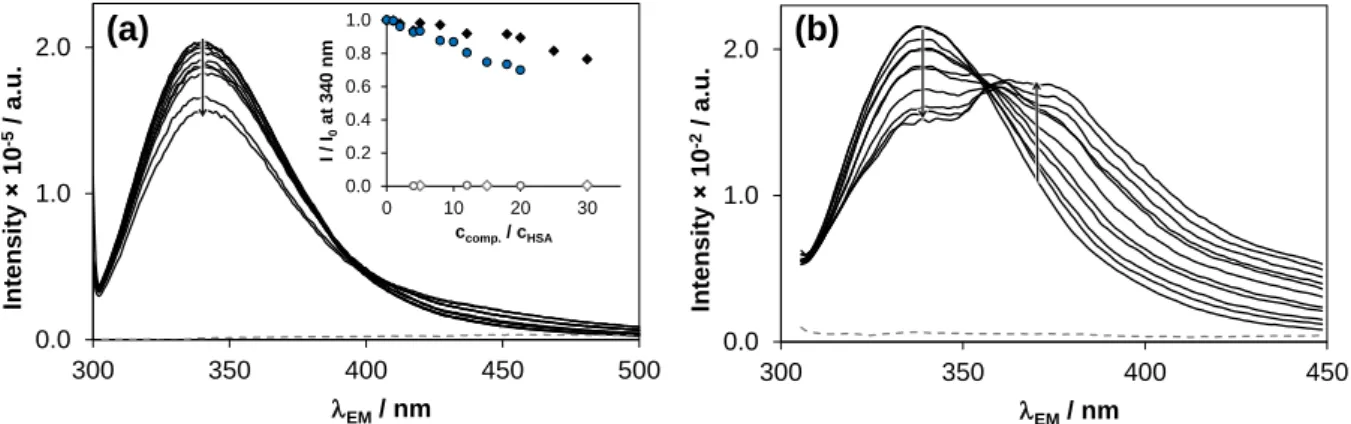
First, binding at site I was investigated via Trp quenching studies. Following the selective excitation of Trp214 at 295 nm, the fluorescence emission intensity can be attenuated by the binding at (or in close proximity to) this amino acid, as briefly mentioned in Section 3.3.1. Representative quenching curves and emission spectra are presented in Fig. 7 for AFA and GEF. The different ability to bind at site I is clearly seen in the inserted plot. GEF displays higher affinity towards this site compared to AFA. In case of GEF a new band is developed in line with the quenching of the Trp emission, indicating the existence of RET discussed in Section 3.3.1. Quenching via RET is also likely in case of AFA and OSI, but transferred energy can be eliminated only in a non-radiative manner. Intensities under 340 nm were used to compute binding constant of GEF, where the induced emission of GEF was negligible (similarly to ERL). The calculated binding (quenching) constants in Table 3 indicate relatively weak binding (logK’ ~4.0) of the compounds at site I, which is ~100 µM expressed as dissociation constant (KD). Only OSI (logK’ ~4.9, KD ~ 12.6 µM) possesses somewhat higher affinity. Two constants are shown in Table 3 for AFA: the higher binding constant (logK’ 4.2) belongs to the maleate salt form implying the parallel binding of maleate on the same site.
Fig. 7. Quenching of Trp214 fluorescence in HSA in the presence of (a) AFA and (b) GEF, grey dashed spectra denote the emission of the compounds alone. Inset shows the relative emission intensities at 340 nm for HSA–AFA (♦) and HSA–GEF (●) systems and for AFA (◊) and GEF (○) alone {cHSA = 1 μM; ccomp = 0–30 μM (AFA) and 0–20 μM (GEF) EX = 295 nm; T = 37 °C; pH = 7.40 (PBS)}.
0.0 1.0 2.0
300 350 400 450
Intensity 10-2/ a.u.
EM/ nm 0.0
1.0 2.0
300 350 400 450 500
Intensity 10-5/ a.u.
EM/ nm
0.0 0.2 0.4 0.6 0.8 1.0
0 10 20 30
I / I0at 340 nm
ccomp./ cHSA
(a) (b)
18 Quenching constants for site I were already reported in literature for GEF, ERL and AFA (Table 3). Our HSA–ERL data (logK’ 4.4) are in reasonably good agreement with the constant of Ye et al. with logK’ 4.29 determined in quenching experiments at 35 °C [17].
Similar data is reported for the binding of ERL on the related protein BSA by Liu et al., with logK’ 4.30 [19]. The reported constant for BSA-ERL of Rasoulzadeh et al. (logK’ 4.75) is somewhat higher; however the inner filter effect was not taken into account in their work [18]. In case of GEF logK’ 4.16 (30 °C) derived from corrected spectra agrees well with our data (logK’ 4.2) [14], while non-corrected intensities result in a somewhat overestimated constant of logK’ 4.69 (37 °C) [15]. The binding constant for the AFA-BSA system was measured by Alanazi et al. and reported a rather high value of logK’ 5.87 [20] compared to logK’ 3.89 in our measurements. All of the reported constants are determined graphically by the use of the log-log linearization method.
Table 3. Conditional binding constants (logK’) of the compounds at binding sites I and II of HSA determined by spectrofluorometric measurements and HSA-bound quantities (%) calculated for the theoretical systems containing HSA at physiological concentration (630 µM) and 10 µM compound {pH = 7.40 (PBS); 37 °C}.
GEF ERL AFA KP2187 OSI
Trp214 quenching (site I) literature data for HSA:b
literature data for BSA:b
4.2 ± 0.1 4.16 [14]c 4.69 ,[15]
4.4 ± 0.1 4.29 [17]d 4.75 [18]d 4.30 [19]d 4.36 [21]f
3.9 ± 0.1a
5.87 [20]e
4.2 ± 0.1 4.9 ± 0.1
WF displacement (site I) 4.0 ± 0.1 4.3 ± 0.1 4.3 ± 0.1g 4.3 ± 0.1 4.6 ± 0.1 DG displacement (site II) n.m.h n.m.h n.m.h binding i 4.3 ± 0.1
HSA bound fraction (%)j 89 92 83 > 92 98
a logK’(quench) = 4.2 ± 0.1 measured for the maleate salt. b Calculated by log-log linearization method. c-f Measured at 30 °C (c), 35 °C (d), 36 °C (e), 25 °C (f). g Measured for the maleate salt.
h No measurable displacement. i Not quantified. j Calculations based on the averaged binding constants measured at site I together with the binding constant at site II if applicable; potentially underestimated values.
Additionally, binding affinity at site I was followed via WF displacement experiments.
Emission bands originating from the HSA bound compounds ERL and GEF overlap with the bands of WF and HSA–WF, which made it difficult to follow the displacement reactions and to compute binding constants. Two different kinds of data treating approaches were utilised, see details in the caption of Fig. S9. Both approaches gave similar displacement constants for
19 the HSA–ERL adduct logK’ 4.27 ± 0.01 and 4.36 ± 0.01 respectively, and the average value is listed in Table 3. The same procedure was used for GEF.
HSA bound KP2187 emits at somewhat higher wavelengths, thus emission intensities measured between 335–390 nm were suitable for calculations. It is noteworthy that lifetime measurements followed at the emission of KP2187 revealed static quenching of HSA bound KP2187 in the presence of WF confirming real competition at site I. Most probably this site binds the shorter lived component (τ2 = 4.8 ns, see Section 3.3.1) showing decreasing normalized amplitudes in the presence of elevating WF concentration. Computed displacement constants are in good agreement with those obtained in quenching studies (Table 3).
Site markers DG and DS [41,42] were applied to follow binding at site II. Clearly, no displacement could be detected in the case of AFA, ERL and GEF neither for the use of DG or for DS. OSI displaced DG in a weak but significant manner from its binding site (see Table 3). Competition between DG and KP2187 was detected as well (Fig. S10) however excessive spectral overlap hindered the calculation of any binding constant.
In all, the structurally similar inhibitors GEF, ERL and AFA clearly show no binding at site II, while site I was proved to be relatively weak but unequivocal binder. Site I and site III are reported in the literature for both ERL and GEF as primary binding sites [14,15,17,19].
Possible binding at site III was not subject of our investigations, thus involvement of site III cannot be precluded. However, our lifetime data on KP2187 denote the presence of two binding sites which corresponds well with the steady-state results indicating binding at site I and II, thus additional binding at site III is not feasible. OSI, as representative of a different structural class however displays somewhat stronger (but still moderate) affinity to site I compared to the other inhibitors and even site II is involved in its binding event. To the best of our knowledge binding constants and locations on HSA for OSI and KP2187 are reported here as first.
3.3.3. Model calculations on the HSA binding of the studied compounds
Equilibrium model calculations were performed using the computed binding constants in order to predict the HSA bound fraction of the studied EGFR inhibitors in human serum.
For lack of overall binding data, the average constant of quenching and WF displacement studies, representing affinity towards site I, and displacement constant for site II (applicable only for OSI) were used in the model containing physiological amount of HSA (630 μM) and 10 μM compound. These type of calculations may provide potentially underestimated protein- bound fractions, as further binding sites (over site I and II) may exist which were not taken into account in this work. Considerable HSA binding of these compounds is revealed in our calculations (89 and 92% for GEF and ERL, respectively; see Table 3), which is in reasonably
20 good agreement with data reported in pharmacokinetic studies for marketed compounds GEF and ERL indicating 90% and 95% binding to serum proteins, respectively [6,7]. The calculated 83% HSA bound AFA are in fairly good correspondence with literature data: in vitro studies reported 80% AFA bound to HSA [8]. No data are reported on plasma distribution of OSI, but a high binding level is assumed [9] in good correlation to the 98%
HSA binding from our model calculations.
In all, despite the weak-to-moderate binding affinities determined in the present study and in literature [14,17] for the investigated EGFR inhibitors, extensive HSA binding in blood plasma can be expected mainly due to the very high levels of HSA.
3.4. Molecular docking
Docking methods are generally designed to study pharmacologically relevant, high- affinity protein-ligand (receptor-ligand) interactions (logK’ ~7–12; pico-, nanomolar affinities expressed in KD). The same docking calculations are readily applied for lower affinity interactions including binding towards high capacity binding sites on HSA. However, in the latter case the results are usually more qualitative than quantitative.
The experimental compound KP2187 and one of the marketed drugs containing the N- phenylquinazolin-4-amine moiety, namely GEF were chosen to study the binding preferences towards site I, II and III on HSA. (Notably, GEF was considered to display the closest structural similarity to KP2187 among GEF, ERL and AFA regarding the flexibility of the substituent at position 6 on the quinazoline ring in addition to their protonation states at pH 7.4 and their lipophilic character.) The possible protonation state of the binding forms was also in scope of these investigations since the single protonated HL+ form of GEF and KP2187 is predominant at physiological pH in water (see Table 1) but binding at the highly apolar binding pockets may force a deprotonation to the charge neutral L0 form. Interestingly, most papers pay no attention to this topic and in their studies only charge-neutral forms are used for docking calculations [14-16,19].
To confirm reliability of docking results dockings of well-known site markers were performed. Docked complexes of WF (site I marker), 3-carboxy-4-methyl-5-propyl-2- furanopropanoic acid (CMPF, site II marker) and the endogenous ligand 4Z,15E-bilirubin-IXα (bilirubin, site III marker) were compared to the reported crystallographic structures [33,34].
Details are discussed in SI/Section S3. Binding poses of WF and CMPF in sites I and II of HSA, respectively, were sufficiently reproduced. Less accurate reproduction of the bilirubin binding pose at site III may be attributed to the fact that docking calculations are more reliable for small molecules with limited number of rotatable bonds, such as WF and CMPF.
21 The binding of the protonated (HL+) and charge neutral (L0) forms of GEF and KP2187 to certain sites was studied in the next step. The drug binding site I of HSA is described as a continuous non-polar cavity with three hydrophobic sub-chambers and two polar patches formed at the bottom and at the entrance of the pocket. The former polar patch includes Tyr150, His242 and Arg257, while the latter consists of Lys195, Lys 199, Arg218 and Arg222. This fairly large, structurally resilient pocket was shown to bind ligands of various size and structure [12,33] and even compounds which have similar chemical structure could bind to this site in different relative orientations [43]. The pocket is positively charged; therefore interactions with anionic or partially negative moieties of ligands are favoured for binding.
Protonated GEF and KP2187 were found to bind to this site in an orientation similar to that of WF (Figs. 8. and Fig. S13,S15a). The positively charged morpholine moiety of GEF and the primary amino group of KP2187 were positioned outside the pocket, in fair distance from the polar patches formed by the basic amino acid side chains. The morpholine group of neutral GEF was, however, found to form polar contacts with the Arg side chains of the above mentioned positive patch. KP2187 in neutral form was found to bind in a pose highly similar to that observed for the protonated form.
Site II of HSA is smaller in volume than site I. It consists of one hydrophobic chamber and one main polar patch formed by Arg410, Tyr411 and Lys414 [33]. Similarly to site I, the entrance of this pocket is lined with positively charged residues. It is difficult to compare the docked complexes of GEF and KP2187 (Fig. S11) to that of CMPF (Fig. S15b), because these compounds differ in size and structure significantly from the site marker. Similarly to that observed in the case of site I-bound ligands, the positively charged groups of protonated GEF and KP2187 were positioned away from the Arg410 and Lys414 side chains in the low-energy docked complexes. Halogenated aromatic moieties of GEF and KP2187 were found to group with a hydrophobic cluster formed by Phe403, Leu407, Leu430, Val433 and Leu453. Neutral forms of both GEF and KP2187 were found to bind in similar poses.
22 Fig. 8. Low-energy docked complexes of GEF and KP2187 in protonated and neutral forms in binding site I. Non-polar hydrogen atoms are omitted for clarity. (For the 2D ligand interaction diagrams see Fig. S13.)
Concerning site III the docking calculations revealed that GEF and KP2187 insert in the groove formed by the four helices covered by residues 110-119 (Figs. S12). Such deep insertion as observed for bilirubin in the crystallographic structure of the bilirubin-HSA complex [34] was not observed, however, this may be explained by the smaller size of these compounds. Ligands bound at site III were proposed to form polar interactions with Arg117 and Arg186. Such interactions were present in the docked protonated KP2187, but not in case of GEF in its protonated form. The morpholine moiety of GEF and the amino group of KP2187 were found to be projected away from Arg117 and Arg186, similarly to that observed for protonated ligands at the other two binding sites. These groups inserted deeper into the binding pocket in case of neutral ligands, but only the amino group of KP2187 was engaged in polar interactions.
Table 4. Binding free energies of the docked complexes of GEF and KP2187 with HSA.
G (site I) / G (site II) / G (site III) /
23 kcal mol-1 kcal mol-1 kcal mol-1
GEF+ -8.26 -9.82 -7.77
GEF0 -8.13 -7.87 -7.29
KP2187+ -7.54 -10.03 -9.04
KP21870 -8.64 -8.22 -7.24
Calculated binding free energies (Table 4) suggest that the neutral ligands have a slight preference for site I, which is in qualitative agreement with experimental observations. Data obtained for protonated ligands did not confirm this trend. This suggests that although these ligands were shown to be protonated in aqueous solutions at neutral pH, they may bind to HSA in their neutral forms. This is further corroborated by the abundance of basic amino acid side chains in the binding pockets of HSA, which would disturb binding of positively charged ligands. Accepting the assumption regarding the neutral protonation state of the binding compounds, one can see the significantly lower affinity of GEF and KP2187 towards site III compared to site I and site II. In the case of both KP2187 and GEF binding at site I seems to be preferred slightly over site II, which corresponds well to the experimental results with GEF but not with KP2187 (Table 4). This contradiction between experimental and in silico results suggest that binding may take place through a more complex, multi-step mechanism or is modulated by some experimental conditions, which not taken into account for the dockings and are yet to be revealed.
4. Conclusions
In this work, the binding interactions between HSA and four approved EGFR inhibitors (GEF, ERL, AFA and OSI) as well as the experimental inhibitor KP2187 were investigated by means of spectrofluorometric and molecular modeling techniques. The albumin binding ability of OSI and KP2187 was not studied previously, and literature data reported for the other three are often not comparable to each other as a cause of the different experimental setups used. Steady-state and time resolved measurements, as well as fluorescence quenching and site marker displacement experiments were carried out. Proton dissociation constants and solvent dependent fluorescence properties were also investigated in order to get more insight into the nature of HSA binding.
According to the proton dissociation constants, the studied inhibitors were found predominantly in their single protonated (HL+) form at physiological pH except ERL that was neutral under these conditions. GEF, ERL and KP2187 display solvent-dependent fluorescence properties, where the detected emission was highly sensitive to the polarity and
24 the hydrogen bonding ability of the solvent. AFA and OSI were non-fluorescent at any applied condition.
All of the studied EGFR inhibitors proved to be bound to HSA with weak-to-moderate strength. Fluorescence characteristics of GEF, ERL and KP2187 in the presence of HSA referred to the existence of mainly hydrophobic binding pockets providing hydrogen bonding groups in HSA. This finding is supported by the observed binding of these compounds at the hydrophobic pocket site I (logK’ 3.9–4.4). Furthermore, fluorescence lifetime measurements performed with KP2187 implied the existence of two binding sites, which was confirmed by steady-state displacement measurements at site II. OSI was also proved to be bind at site II (logK’ 4.3), while other compounds (GEF, ERL and AFA) clearly show no binding at this site. Calculated binding constants showed only moderate binding to HSA, although OSI has somewhat higher binding constants. Although docking methods are generally tailored to study pharmacologically relevant, high-affinity protein(receptor)-ligand interactions, our docking calculations could qualitatively confirm the binding site preferences of GEF and KP2187, and indicated that these ligands may bind to HSA in their neutral forms. At the same time model calculations using the binding constants and simulating physiological concentrations of HSA resulted in fairly high, ca. 90% bound fraction for the inhibitors. These results are in good agreement with reported plasma distribution values of the approved EGFR inhibitors and underline the role of plasma protein binding in the pharmacokinetic profile of OSI and KP2187 even if the binding constants determined are not high values.
Acknowledgements
This work was supported by the National Research, Development and Innovation Office FK 124240 project, the UNKP-17-4 New National Excellence Program of the Ministry of Human Capacities (E.A.E), the J. Bolyai Research Scholarship of the Hungarian Academy of Sciences (A.B.), Austrian Science Fund (FWF) grant P28853 (C.R.K.) and Austrian- Hungarian Scientific & Technological Cooperation TÉT_15-1-2016-0024.
Appendix A. Supplementary material
Supplementary data associated with this article can be found, in the online version, at …
References
[1] M.K. Paul, A.K. Mukhopadhyay, Int. J. Med. Sci. 1 (2004) 101–115.
[2] S.V. Sharma, D.W. Bell, J. Settleman, D.A. Haber, Nat. Rev. Cancer 7 (2007) 169–181.