New computational studies to support
cyclin-dependent kinase 9 inhibitor screening and design
MÁRK FÁBIÁN1, BALÁZS BALOGH2, ZSÓFIA CZUDOR1, LÁSZLÓ ŐRFI1,3*
1Department of Pharmaceutical Chemistry, Semmelweis University, Hőgyes Endre St. 9. 1092, Budapest, Hungary
2Department of Organic Chemistry, Semmelweis University, Hőgyes Endre St. 7. 1092, Budapest, Hungary
3Vichem Chemie Research Ltd , Rákóczi utca 5. 8200, Veszprém, Hungary
*Corresponding author: László Őrfi, email: orfi.laszlo@pharma.semmelweis-univ.hu
1. INTRODUCTION
Cyclin-dependent kinases (CDK) are character- ized as Ser/Thr kinases. Twenty members of this group have been discovered so far [1]. In most cas- es their activity depends on cyclins, which bind to them and act as regulatory subunits to control ki- nase activity and substrate specificity. These CDK- cyclins complexes are usually involved in cell cy- cle and transcription regulation, therefore their overexpression or amplification can easily lead to improper operation of cell cycle or transcription, which may cause uncontrolled proliferation and thus tumor formation [2].
CDK9 can be expressed in two isoforms, a light- er 42 kDa protein and a heavier 55 kDa protein [3].
Both are capable of forming complexes with cyclin T1, T2a, T2b and K [4]. The structure of CDK9 shows typical features of its class. There is an N-terminal lobe (residues 16-108), which contains five segments of β-sheet completed with a single α-helix, while the C-terminal lobe (residues 109-330) is comprised of four β-strands and seven main α-helices [5]. The ATP binding site is located in a cleft between the two lobes of the protein and
there is also a loop behind them called ‘hinge’. All these three parts are involved in the ATP binding.
The binding pocket has a characteristic sickle-like shape, with a volume of approximately 360 Å3 (calculated by Schrödinger’s SiteMap application) [6, 7]. It is relatively narrow and flat with a hydro- phobic region in the middle. The structure of CDK9 is very similar to that of CDK2, as they have 40% sequence identity [5].
The determination of its crystallographic struc- ture became possible only 14 years after the dis- covery of CDK9 [5]. Sixteen crystal structures of it were deposited in the RCSB database until present day. For our project we retrieved one from the Protein Database (PDB ID: 4BCF). It is in complex with cyclin T and what is more important with a 2-amino-4-heteroaryl-pyrimidine inhibitor. We have selected this structure, because the co-crys- tallized inhibitor was similar to our ligands, so it probably binds with similar interactions to the protein.
Physiologically, cyclin T is needed for the acti- vation of the enzyme by the phosphorylation of Thr186. After that the complex can fulfill its role [8], which is the following: CDK9/cyclin T is a part of Received: 13 March 2019 / Accepted: 19 March 2019 / Published online: 3 April 2019
Abstract:
Aims: Cyclin-dependent kinase 9 (CDK9) plays a major role in the regulation of transcription. Its overexpression – which occurs in several types of cancer – increases the levels of certain antiapoptotic proteins that can lead to tumorigenesis, therefore the identification of new, more potent and more selective inhibitors is essential.
Methods: In this study we present a computational approach, which can facilitate lead selection and optimization.
Results: First, a pharmacophore hypothesis based on the active compounds has been developed to identify the key features for the ligand-target interaction. This was followed by the docking of the compounds into the active site of CDK9, the poses and interactions with the amino acids were compared with those of the co-crystallized ligand. The mode of their binding further explained the character- istics of these inhibitors while the docking scores can be a factor in the selection of active compounds in the future. Finally, a field-based QSAR model was also created, to predict the activity of inhibitor candidates.
Conclusion: With our current work we deepened our knowledge about the interactions between CDK9 and its inhibitors, which can contribute to the discovery of novel CDK9 inhibitors.
Keywords: CDK9 inhibitor, docking, QSAR, pharmacophore model
a larger protein complex called positive transcrip- tion elongation factor b (P-TEFb) in which the CDK9 can phosphorylate the C-terminal domain (CTD) of RNA polymerase II (RNAPII). This is a key regulatory mechanism during elon- gation [4]. CDK9 mediated phosphorylation of the CTD in RNAPII increases the levels of antiapoptotic proteins such as Mcl-1 and XIAP. If CDK9 is overexpressed or amplified, this process can lead to tumorigenesis [9, 10].
Additionally, through the hexamethylene bi- sacetamide-inducible protein 1 (HEXIM1), CDK9 can be associated with the replication of Human Immunodeficiency Virus (HIV) [11]. Therefore, CDK9 inhibitors could be used in HIV and cancer therapy as well.
Several CDK and CDK9 inhibitors have been developed so far. Roscovitine (seliciclib) was the first CDK inhibitor to enter clinical trials [12], but palbociclib was the first that obtained FDA approval [13, 14]. As for CDK9, one of the most significant inhibitors is dinaciclib that reached the most advanced clinical phase [13, 15]. One of the main prob- lems regarding the current CDK9 inhibitors is the lack of selectivity, which may lead to severe side effects during therapy [16]. There- fore, the need for more selective CDK inhibi- tors has been emerged. Our work aims to provide a useful method in compound pre- screening to reduce the time and costs of lead selection and optimization.
2. MATERIALS AND METHODS 2.1 Data set
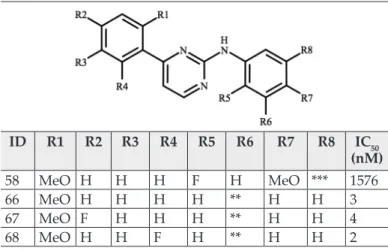
All models we created were based on a set of 41 CDK9 inhibitors that was synthesized by our research group [17]. We kept the number- ing of the compounds as it is in the above- mentioned paper. The structures and IC50 val- ues of the compounds are listed in Table I.
During our work we used Schrödinger’s Maestro software [18] to run calculations and create models.
2.2 Protein and ligand preparation
The first task was to prepare the crystal structure of 4BCF with Protein Preparation Wizard [19], which included preprocessing, H-bond assessment and restrained minimi-
zation. Default settings were used in all parts of the preparation. Ligand structures were drawn with Schröd inger’s Maestro graphical user inter- Table I Structure and CDK9 inhibitory activity of N-aryl pyrimid- inamines [17].
ID R1 R2 R3 R4 Ar IC50
(nM) 21 MeO H H H 3,4-dimethyl-isoxazole 3 22 MeO F H H 3,4-dimethyl isoxazole 2 23 MeO H F H 3,4-dimethyl-isoxazole 9 24 MeO H H F 3,4-dimethyl-isoxazole 1 25 MeO F F H 3,4-dimethyl-isoxazole 8 26 MeO H F F 3,4-dimethyl-isoxazole 1 27 MeO CL H H 3,4-dimethyl-isoxazole 12 28 MeO H H Cl 3,4-dimethyl-isoxazole 25 29 MeO MeO H H 3,4-dimethyl-isoxazole 9 30 EtO F H H 3,4-dimethyl-isoxazole 8 31 EtO H H F 3,4-dimethyl-isoxazole 2 32 EtO Cl H H 3,4-dimethyl-isoxazole 17 33 iPro F H H 3,4-dimethyl-isoxazole 49 34 H H iPro F 3,4-dimethyl-isoxazole 458 35 MeS F H H 3,4-dimethyl-isoxazole 13 36 Me F H H 3,4-dimethyl-isoxazole 6 37 F F H H 3,4-dimethyl-isoxazole 11 38 F MeO H F 3,4-dimethyl-isoxazole 21 39 Cl F H H 3,4-dimethyl-isoxazole 55 40 MeO Cl H H 3,4-dimethyl-isoxazole 50 41 MeO H H H 4,5-dimethyl-isoxazole 4 42 MeO F H H 4,5-dimethyl-isoxazole 3
43 MeO F H H benzo[d]isoxazole 5
44 MeO H H H thiazole 33
45 MeO F H H thiazole 122
46 MeO H H F thiazole 2
47 EtO F H H thiazole 210
48 EtO Cl H H thiazole 378
49 MeO H H H * 12
50 MeO F H H * 6
51 MeO H F H * 9
52 MeO H H F * 2
53 MeO F F H * 10
54 MeO H F F * 0.4
55 MeO MeO H H * 14
56 EtO F H H * 2
57 EtO Cl H H * 5
*: 2-methyl-[1,3,4]thiadiazol
Continuation on next page
face (GUI), then the LigPrep module was used to generate energy-minimized 3D conformations of each compound. To perform this, the optimized potential for liquid simulations 2005 (OPLS-2005) force field [20] was adopted. One stereoisomer per ligand was studied. As for ionization forms, we generated the most possible state of each molecule with Ionizer at target pH of 7.4. The negative loga- rithm values (pIC50) of the previously published inhibitory activities were calculated and used for the model building [17]. Flexible Ligand Align- ment procedure of the Maestro GUI was utilized for the superposition of the ligands. The best alignment was received by using the ‘Common scaffold alignment’ with ‘fuzzy matching’ option.
2.3 Docking
Schrödinger’s Grid-based Ligand Docking with Energetics (GLIDE) was used in the docking stud- ies. Firstly, we created the grid box for the dock- ing. The co-crystallized ligand was used to deter- mine the place of the binding pocket and after measuring the size of our ligands we decided to
set the size of the grid box for 20×20×20 Å to surely have enough space in it for all ligands.
The co-crystallized ligand was re-docked with both the ‘score in place’ and the stan- dard precision (SP) procedures in order to validate our model. Then all the examined li- gands were docked via both the SP and the extra precision (XP) methods. Flexible ligand sampling was used with the standard set- tings during all docking procedures.
2.4 Pharmacophore Hypothesis
Schrödinger’s Phase module [21] was used for pharmacophore model development. We developed two kinds of pharmacophore hy- potheses. For the first one, we used the previously aligned ligands and defined entries with pIC50 val- ue above 7.0 as active. Then several hypotheses were developed. As for the second kind, we used the XP docked ligand conformations for the mod- el, thus there was no need to generate conformers during the development of these pharmacophore hypotheses. In both cases there were 4-7 features in the hypotheses, which matched 66%, 75% or 90% of the active ligands. Hereby we present one model, which we found the best based on Survival score and compatibility with our data from dock- ing and pharmacophore hypothesis.
2.5 Field-Based QSAR
Our Quantitative Structure–Activity Relationship (QSAR) models were developed with Schröding- er’s Field-based module. The previously aligned 41 ligands were used for this part. The activity prop- erty was pIC50. The data set was randomly divided into training (66 %) and test sets (33%). Partial least squares regression (PLS) method with up to 6 fac- tors with standard settings was used, except that ID R1 R2 R3 R4 R5 R6 R7 R8 IC50
(nM)
58 MeO H H H F H MeO *** 1576
66 MeO H H H H ** H H 3
67 MeO F H H H ** H H 4
68 MeO H H F H ** H H 2
**: 1H-benzimidazole-1-yl-methyl
***: carboxamide
Table II Statistical parameters of the final field-based QSAR model
Number of PLS factors 4
Standard deviation of the regression (SD) 0.3847
Training set regression (R2) 0.8046
Cross-validated R2 (R2-CV) 0.4567
R2 with scrambled activities (R2 scramble) 0.4154
Stability of the model predictions to changes in the training set composition (maximum value
is 1, meaning stable) 0.799
F – variance ratio (large values indicate a more statistically significant regression) 23.7 P – significance level of variance ratio (smaller values indicate a greater degree of confidence) 7.19E-08
Test set regression (Q2) 0.5329
Continuation from previous page
we eliminated variables with
|t-value| <2. The model with the best statistical attributes was selected as the final one.
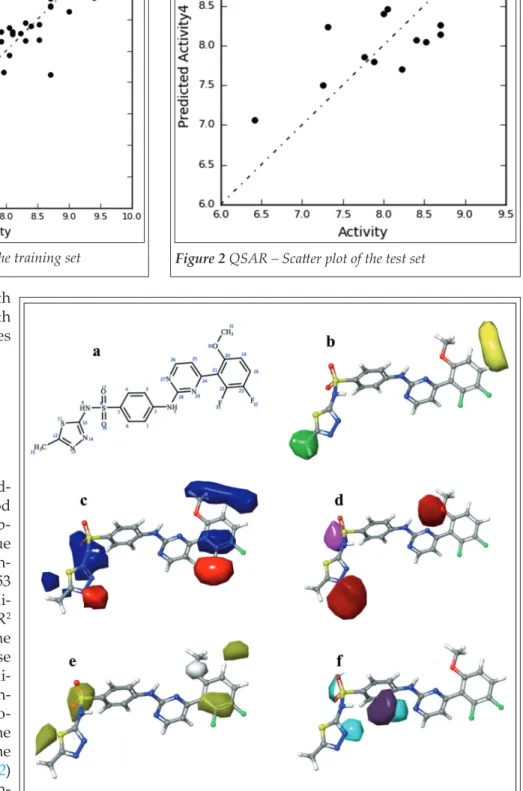
3. RESULTS AND DISCUSSION 3.1 Field-Based QSAR As shown in Table II, the mod- el we found best, offered good predictive power and descrip- tive capability. The R2 value for the regression of the train- ing set was above 0.8 and 0.53 for the test set, the cross-vali- dated R2 and scrambled R2 values were also within the range of acceptance. These data together with the Stabili- ty and F and P values were in- dicating the reliability and ro- bustness of our model. The graphical representation of the R2 (Figure 1) and Q2 (Figure 2) also indicated a good align- ment with only a few outliers.
Moreover, after visualization of the model, we could get more valuable information about CDK9 inhibitors (Figure 3).
As it is illustrated, generally,
Figure 3 QSAR Visualization via Contour maps using compound 54 as an example:
a: numbering of compound 54, b: Gaussian Steric Force Field, green: favorable, yellow:
unfavorable c: Gaussian Electrostatic Force Field, blue: favorable, red: unfavorable d: Gaussian H-bond Acceptor, red: favorable, magenta: unfavorable e: Gaussian Hydrophobic, yellow: favorable, white: unfavorable f: Gaussian H-bond Donor, purple:
favorable, cyan: unfavorable
Figure 1 QSAR – Scatter plot of the training set Figure 2 QSAR – Scatter plot of the test set
Figure 4 XP docking results a: side view of the site with all docked ligands included b: top view of the site, which reveals the characteristic narrow, flat shape of the pocket (together with compound 54 as an example of ligand positioning)
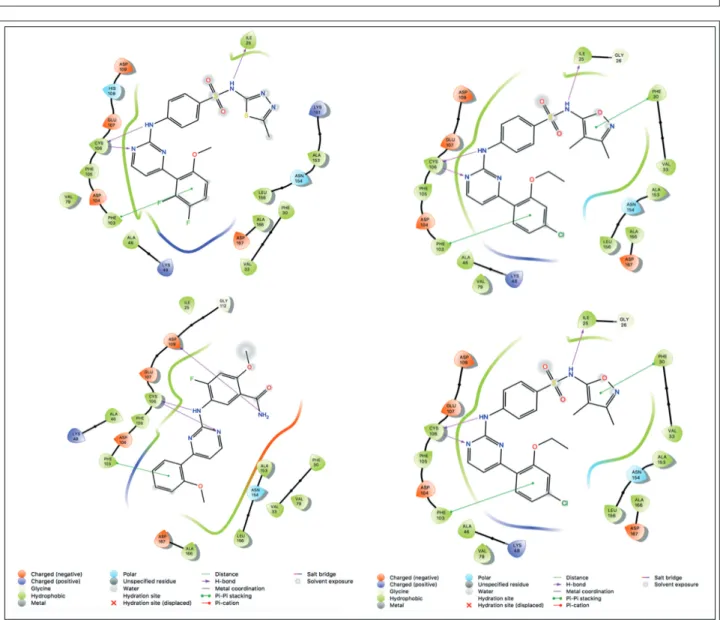
Figure 5 Ligand interaction diagrams showing the most common interactions between the inhibitors and the binding site
introducing various substituents at the ends of the molecule can lead to changes in activity. The steric contour map (Figure 3b) suggested that a bulky group at C-12 on the thiadiazole ring could be a
good way the improve binding, while substitution at C-18 may be disadvantageous. From the electro- static field contour map (Figure 3c) we could con- clude that electrostatic groups at C-12, 19 and 20 may increase the activity while at C-22 an electro- negative group could lead to a similar result.
Judging from Figure 3d, the introduction of a hy- drogen bond acceptor moiety near C-20 and N-13 could also possibly improve the inhibition of CDK9. After having a look at Figure 3e it is easy to see that a hydrophobic substituent at C-19, 22 and 23 could be desirable in order to increase the in- hibitor activity.
3.2 Docking
Each ligand of our compound set was docked into the binding pocket of 4BCF. As expected, XP scores were better than SP scores, however, no real correlation with the biological data was found as some lower activity compounds (eg. 34, 47, 48 and 58) were overscored (especially in terms of the XP method), which may be caused by the relatively low resolution of the X-ray structure.
As it can be seen in Figure 4a, the docked li- gands are very well aligned and fit in the binding pocket quite easily. Every ligand formed two H- bonds with Cys106 (both as a hydrogen bond do- nor and acceptor), while Ile25 usually acted as a hydrogen bond acceptor. Phe30 often had a π-π stacking with heterocyclic rings such as thiazoles or isoxazols, while Phe103 was often involved in a π-π stacking interaction with one of the aromatic rings. In some cases His108 and Asp109 also formed secondary bonds with the inhibitors. Simi- larly to the co-crystallized inhibitor, the conforma- tion of our compounds was bent and usually parts like the sulfonamide group, triazole and isoxazole rings were solvent exposed as they were (at least partially) positioned outside of the binding pocket granting more conformational freedom for these moieties, but as a result they were less likely to es- tablish connections with the protein. Although they are not shown in this figure, there was a sig- nificant amount of Van der Waals bonds between the ligands and the protein, which we believe plays a significant role in the binding process, which is in line with our knowledge about the hy- drophobic nature of this binding site.
3.3 Pharmacophore Hypotheses
Our best pharmacophore model hypotheses Table III Docking scores
ID pIC50 XP docking score SP docking score
54 9.398 -11.387 -9.498
25 8.097 -11.184 -9.245
32 7.770 -11.134 -8.702
35 7.886 -11.046 -9.294
33 7.310 -11.026 -9.435
28 7.602 -10.943 -8.737
27 7.921 -10.942 -9.366
42 8.523 -10.928 -9.257
30 8.097 -10.914 -9.326
68 8.699 -10.912 -9.891
40 7.301 -10.911 -9.158
37 7.959 -10.911 -9.453
26 9.000 -10.897 -9.740
67 8.699 -10.883 -9.250
53 8.000 -10.855 -9.208
22 8.699 -10.850 -9.248
24 9.000 -10.833 -9.610
34 6.339 -10.830 -9.195
46 8.699 -10.815 -9.120
23 8.046 -10.812 -8.876
39 7.260 -10.757 -9.265
52 8.699 -10.753 -9.447
36 8.222 -10.751 -9.288
50 8.222 -10.715 -9.113
51 8.046 -10.700 -9.225
56 8.699 -10.690 -9.373
43 8.301 -10.676 -9.136
48 6.423 -10.657 -8.986
47 6.678 -10.653 -9.389
21 8.523 -10.632 -9.262
49 7.921 -10.572 -9.092
57 8.301 -10.522 -9.082
45 6.914 -10.491 -9.155
44 7.481 -10.462 -9.225
66 8.523 -10.311 -9.472
31 8.699 -10.265 -9.659
38 7.678 -10.135 -9.140
58 5.802 -10.012 -8.837
29 8.046 -9.936 -8.947
42 8.398 -9.907 -8.795
55 7.854 -9.749 -9.238
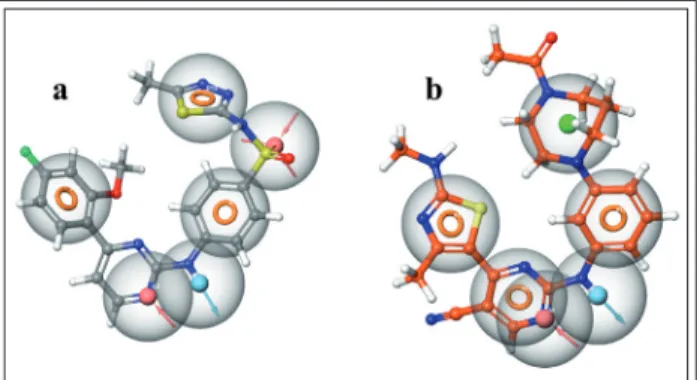
were obtained using the superposition of the conformations obtained from the XP docking poses. The knowledge we got from the docking experiments was also taken into consideration regarding the selection of pharmacophoric groups. Our best model, AADRRR can be char- acterized with a Survival score of 6.21 and a Se- lectivity score of 2.14. The Fitness of compound 54 in this hypothesis was 2.633653. This model contained a hydrogen bond donor (D) and an acceptor (A) at exactly the same position we could observe in the docking part. There were also two rings (R), which were also observed as π-π interaction participants with the protein.
There was another hydrogen bond acceptor (A), namely an oxygen atom in the sulfonamide group. As we saw earlier, this part of the mole- cule is usually out of the binding pocket, thus less likely forms any bonds. The high scores may indicate that this unique model could be suitable for the identification of new, potentially CDK9 selective inhibitors.As a comparison, a hypothesis based on the co-crystallized ligand was also developed. This model consisted of three aromatic rings (R), one hydrogen bond do- nor (D) and one acceptor (A) and also a hydro- phobic region (Figure 6b). It must be pointed out, that despite the structural differences of the in- hibitors, these hypotheses showed some signifi- cant similarities (four out eight groups had a perfect match), which further indicates the va- lidity of our model.
4. Conclusions
Based on a previously published CDK9 X-ray structure and 41 CDK9 inhibitor compounds, a docking study was completed. Our investigations
also included ligand-based pharmacophore-, and QSAR modeling studies. Judging from our best pharmacophore hypothesis and the docking pos- es, a hydrogen bond donor and acceptor at close proximity are essential in the binding, because they both interact with the backbone atoms of Cys106. These interactions presumably help to fas- ten the compound in the binding pocket. Accord- ing to our opinion, the orientation and presence of the aromatic rings could also be important, be- cause they are able to form π-π interactions with Phe30 and Phe103. The importance of the sulfon- amide group lies in the fact, that its NH group is able to form a hydrogen bond with Ile25, while other components of the inhibitors like thiazole- and dimethylisoxazole groups are usually un- bound so their orientations were varied in the poses. The bent conformation of the ligands and the shape and surface of the binding pocket are also key factors that determine the nature of the interactions between CDK9 and its inhibitors. To sum up, we generated a pharmacophore hypothe- sis and determined the main features of these molecules that play a role in their activity as in- hibitors. Then we docked all of these compounds to deepen our understanding of the binding, and reveal new interactions and connections, and fi- nally we built a robust field-based QSAR model with a strong predictive power, which might be able to predict the activity of inhibitor candidates in the future. If we apply the three above detailed methods in the right order, it gives us a powerful tool that can facilitate our CDK9 inhibitor re- search. We could screen databases and compound libraries by using our pharmacophore hypothesis.
After that we could dock the selected ligands to compare their ability to bind to CDK9 and finally test them with a QSAR model to predict their ac- tivities. We are confident that all the models and knowledge that we gathered by this project can improve the CDK9 inhibitor design and can lead to new and – after completing the protocol with further targets – probably more selective inhibi- tors. We also believe that our method can reduce time and costs of CDK9 inhibitor drug develop- ment and can assist in lead selection and optimi- zation.
ACKNOWLEDGEMENTS
Supported By The ÚNKP-18-2 New National Excellence Program Of The Ministry Of Human Capacities.
Figure 6 Comparison of pharmacophore models a: Our best (AADRRR) pharmacophore hypothesis superimposed on compound 54 b: Pharmacophore hypothesis developed from the 4BCF co-crystallized ligand
5. REFERENCES
1. Malumbres M. Cyclin-dependent kinases. Genome Biol. 2014;15(6):122. https://doi.org/10.1186/gb4184 2. Lim S, Kaldis P. Cdks, cyclins and CKIs: roles be-
yond cell cycle regulation. Dev Camb Engl. 2013 Aug;140(15):3079–93. https://doi.org/10.1242/
dev.091744
3. Liu H, Herrmann CH. Differential localization and expression of the Cdk9 42k and 55k isoforms.
J Cell Physiol. 2005 Apr;203(1):251–60. https://doi.
org/10.1002/jcp.20224
4. De Luca A, De Falco M, Baldi A, Paggi MG. Cy- clin T: three forms for different roles in physio- logical and pathological functions. J Cell Physiol.
2003 Feb;194(2):101–7. https://doi.org/10.1002/
jcp.10196
5. Baumli S, Lolli G, Lowe ED, Troiani S, Rusconi L, Bullock AN, et al. The structure of P-TEFb (CDK9/cyclin T1), its complex with flavopiridol and regulation by phosphorylation. EMBO J. 2008 Jul 9;27(13):1907–18.https://doi.org/10.1038/em- boj.2008.121
6. Bossemeyer D. Protein kinases--structure and func- tion. FEBS Lett. 1995 Aug 1;369(1):57–61. https://
doi.org/10.1016/0014-5793(95)00580-3
7. Hanks SK, Hunter T. Protein kinases 6. The eukary- otic protein kinase superfamily: kinase (catalytic) domain structure and classification. FASEB J Off Publ Fed Am Soc Exp Biol. 1995 May;9(8):576–96.
https://doi.org/10.1096/fasebj.9.8.7768349
8. Li Q, Price JP, Byers SA, Cheng D, Peng J, Price DH.
Analysis of the large inactive P-TEFb complex in- dicates that it contains one 7SK molecule, a dimer of HEXIM1 or HEXIM2, and two P-TEFb molecules containing Cdk9 phosphorylated at threonine 186.
J Biol Chem. 2005 Aug 5;280(31):28819–26. https://
doi.org/10.1074/jbc.M502712200
9. Wang S, Fischer PM. Cyclin-dependent kinase 9:
a key transcriptional regulator and potential drug target in oncology, virology and cardiology. Trends Pharmacol Sci. 2008 Jun;29(6):302–13. https://doi.
org/10.1016/j.tips.2008.03.003
10. Bose P, Simmons GL, Grant S. Cyclin-dependent kinase inhibitor therapy for hematologic ma- lignancies. Expert Opin Investig Drugs. 2013 Jun;22(6):723–38. https://doi.org/10.1517/13543784.
2013.789859
11. Peterlin BM, Brogie JE, Price DH. 7SK snRNA: a noncoding RNA that plays a major role in regulat- ing eukaryotic transcription. Wiley Interdiscip Rev RNA. 2012 Feb;3(1):92–103. https://doi.org/10.1002/
wrna.106
12. Meijer L, Borgne A, Mulner O, Chong JP, Blow JJ, Inagaki N, et al. Biochemical and cellular effects of roscovitine, a potent and selective inhibitor of the cyclin-dependent kinases cdc2, cdk2 and cdk5. Eur J Biochem. 1997 Jan 15;243(1–2):527–36. https://doi.
org/10.1111/j.1432-1033.1997.t01-2-00527.x
13. Sonawane YA, Taylor MA, Napoleon JV, Rana S, Contreras JI, Natarajan A. Cyclin Dependent Ki- nase 9 Inhibitors for Cancer Therapy. J Med Chem.
2016 Oct 13;59(19):8667–84. https://doi.org/10.1021/
acs.jmedchem.6b00150
14. Vijayaraghavan S, Moulder S, Keyomarsi K, Lay- man RM. Inhibiting CDK in Cancer Therapy: Cur- rent Evidence and Future Directions. Target On- col. 2018 Feb;13(1):21–38. https://doi.org/10.1007/
s11523-017-0541-2
15. Rajput S, Khera N, Guo Z, Hoog J, Li S, Ma CX. In- hibition of cyclin dependent kinase 9 by dinaciclib suppresses cyclin B1 expression and tumor growth in triple negative breast cancer. Oncotarget. 2016 Aug 30;7(35):56864–75. https://doi.org/10.18632/on- cotarget.10870
16. Asghar U, Witkiewicz AK, Turner NC, Knudsen ES.
The history and future of targeting cyclin-depen- dent kinases in cancer therapy. Nat Rev Drug Dis- cov. 2015 Feb;14(2):130–46. https://doi.org/10.1038/
nrd4504
17. Czudor Z, Balogh M, Bánhegyi P, Boros S, Breza N, Dobos J, et al. Novel compounds with potent CDK9 inhibitory activity for the treatment of myeloma.
Bioorg Med Chem Lett. 2018 Feb 15;28(4):769–73.
https://doi.org/10.1016/j.bmcl.2018.01.002
18. Schrödinger Release 2018-2: Field-based QSAR, Schrödinger, LLC, New York, NY, 2018.
19. Sastry GM, Adzhigirey M, Day T, Annabhimoju R, Sherman W. Protein and ligand preparation:
parameters, protocols, and influence on virtual screening enrichments. J Comput Aided Mol Des.
2013 Mar;27(3):221–34. https://doi.org/10.1007/
s10822-013-9644-8
20. Shivakumar D, Williams J, Wu Y, Damm W, Shel- ley J, Sherman W. Prediction of Absolute Solva- tion Free Energies using Molecular Dynamics Free Energy Perturbation and the OPLS Force Field. J Chem Theory Comput. 2010 May 11;6(5):1509–19.
https://doi.org/10.1021/ct900587b
21. Dixon SL, Smondyrev AM, Knoll EH, Rao SN, Shaw DE, Friesner RA. PHASE: a new engine for phar- macophore perception, 3D QSAR model develop- ment, and 3D database screening: 1. Methodology and preliminary results. J Comput Aided Mol Des.
2006 Nov;20(10–11):647–71. https://doi.org/10.1007/
s10822-006-9087-6