1
Interaction of the mycotoxin metabolite dihydrocitrinone with serum albumin
1 2
Zelma Faisal,1,2 Virág Vörös,1 Beáta Lemli,2,3,4 Diána Derdák,3,4 Sándor Kunsági-Máté,2,3,4 3
Mónika Bálint,5 Csaba Hetényi,5 Rita Csepregi,2,6 Tamás Kőszegi,2,6 Dominik Bergmann,7 4
Franziska Sueck,7 Hans-Ulrich Humpf,7 Florian Hübner,7 Miklós Poór 1,2,*
5 6
1Department of Pharmacology, University of Pécs, Faculty of Pharmacy, Szigeti út 12, Pécs 7
7624, Hungary 8
2János Szentágothai Research Center, University of Pécs, Ifjúság útja 20, Pécs 7624, Hungary 9
3Department of Pharmaceutical Chemistry, University of Pécs, Faculty of Pharmacy, Rókus u.
10
2, Pécs 7624, Hungary 11
4Department of General and Physical Chemistry, University of Pécs, Ifjúság útja 6, Pécs 7624, 12
Hungary 13
5Department of Pharmacology and Pharmacotherapy, Medical School, University of Pécs, 14
Szigeti út 12, Pécs 7624, Hungary 15
6Department of Laboratory Medicine, University of Pécs, Medical School, Ifjúság útja 13, 16
Pécs 7624, Hungary 17
7Institute of Food Chemistry, Westfälische Wilhelms-Universität Münster, Corrensstr. 45, 18
48149 Münster, Germany 19
20
*Corresponding author: Miklós Poór, PharmD, PhD 21
Department of Pharmacology, University of Pécs, Faculty of Pharmacy, Szigeti út 12, 7624 22
Pécs, Hungary 23
Phone: +36-72-536-000 / 35052 24
Fax: +36-72-536-218 25
E-mail address: poor.miklos@pte.hu 26
2 Abstract
27
Citrinin (CIT) is a nephrotoxic mycotoxin produced by Penicillium, Monascus, and 28
Aspergillus species. CIT appears as a contaminant in cereals, cereal-based products, fruits, 29
nuts, and spices. During the biotransformation of CIT, its major urinary metabolite 30
dihydrocitrinone (DHC) is formed. Albumin interacts with several compounds (including 31
mycotoxins) affecting their tissue distribution and elimination. CIT-albumin interaction is 32
known; however, the complex formation of DHC with albumin has not been reported 33
previously. In this study, we aimed to investigate the interaction of DHC with albumin, 34
employing fluorescence spectroscopy, circular dichroism, and molecular modeling studies.
35
Furthermore, species differences and thermodynamics of the interaction, as well as the effects 36
of albumin on the acute in vitro toxicity of DHC and CIT were also tested. Our main 37
observations/conclusions are as follows: (1) Fluorescence signal of DHC is strongly enhanced 38
by albumin. (2) Formation of DHC-albumin complexes are supported by both fluorescence 39
spectroscopic and circular dichroism studies. (3) DHC forms similarly stable complexes with 40
human albumin (K ~ 105 L/mol) as CIT. (4) DHC-albumin interaction did not show 41
significant species differences (tested with human, bovine, porcine, and rat albumins). (5) 42
Based on modeling studies and investigations with site markers, DHC occupies the Heme 43
binding site (subdomain IB) on human albumin. (6) The presence of albumin significantly 44
decreased the acute in vitro cytotoxic effects of both DHC and CIT on MDCK cell line.
45 46
Keywords: Dihydrocitrinone; Citrinin; Serum albumin; Fluorescence spectroscopy; Albumin- 47
ligand interaction 48
3 Introduction
49
Citrinin (CIT; Fig. 1) is a nephrotoxic mycotoxin produced by filamentous fungi, including 50
Penicillium, Monascus, and Aspergillus genera (de Oliveira Filho et al., 2017). CIT appears as 51
a contaminant in cereals, cereal-based products, fruits, nuts, and spices (Bennett and Klich, 52
2003; de Oliveira Filho et al., 2017). Several CIT-producing fungi are used in food industry 53
during the production of cheese or some Asian foods. Monascus purpureus is applied even 54
nowadays as a natural food colorant, despite the fact that it commonly produces CIT (da 55
Rocha et al., 2014). The frequent occurrence of CIT in food was likely responsible for the 56
“yellow rice toxins” syndrome/disease in Japan (1971) (Ciegler and Bennett, 1980).
57
Antibacterial activity of CIT has also been reported because some Gram-positive bacteria are 58
sensitive to CIT; however, it is not used in the pharmacotherapy due to its nephrotoxic effect 59
in humans and animals (de Oliveira Filho, et al., 2017). Based on our current knowledge, the 60
chronic CIT exposure may play a role in the development of endemic nephropathy in pigs and 61
in human (Flajs and Peraica, 2009; Peraica et al., 2008). After oral exposure, CIT is 62
extensively biotransformed in humans, during which its major urinary metabolite, 63
dihydrocitrinone (DHC; Fig. 1) is formed (Ali et al., 2015; Huybrechts et al., 2014; Gerding et 64
al. 2015; Degen et al., 2018). Based on previous reports, DHC appears in a wide 65
concentration range in human blood and urine samples (0.00-1.44 ng/mL and 0.01-2.75 66
ng/mL, respectively) (Ali et al., 2015; Huybrechts et al., 2014; Gerding et al., 2015; Ali et al., 67
2018). The conversion of CIT to DHC is known as a detoxification reaction, due to the 68
production of the more polar and less toxic metabolite. In vitro cellular toxicity and 69
genotoxicity of DHC is significantly lower compared to the parent compound (Dunn et al., 70
1983; Föllmann et al., 2014). Under acidic conditions, CIT expresses strong fluorescence (λex
71
= 330 nm; λem = 505 nm); however, fluorescence signal of CIT strongly decreases with the 72
4 elevation of the pH and disappears approximately at pH 5, due to the deprotonation of the 73
molecule (Poór et al., 2016).
74
Human serum albumin (HSA) is the most abundant protein in the human circulation. HSA 75
maintains the oncotic pressure of the blood and displays buffering, antioxidant, and pseudo- 76
enzymatic activities (Fanali et al., 2012). HSA forms stable complexes with several 77
endogenous and exogenous compounds (Fanali et al., 2012; Yamasaki et al., 2013). HSA 78
consists of three domains (I, II, and III), each domain is built up from two subdomains (A and 79
B). The most important binding sites on HSA are Sudlow’s site I (subdomain IIA) and 80
Sudlow's site II (subdomain IIIA); however, recent studies draw the attention to the 81
importance of Heme binding site (subdomain IB) (Fanali et al., 2012; Zsila, 2013). The 82
interaction of CIT with HSA and with albumins from other species has been described 83
(Damodaran, 1977; Damodaran and Shanmugasundaram, 1978; Poór et al., 2015); on the 84
other hand, the DHC-albumin complex formation has not been reported. CIT binds to HSA 85
with similar affinity to the oral anticoagulant warfarin (K = 2 x 10⁵ L/mol), and its binding 86
site is located in Sudlow’s site I (Poór et al., 2015).
87
In this study, the complex formation of DHC with albumin was investigated employing 88
fluorescence spectroscopy, circular dichroism, and molecular modeling. Stability of formed 89
DHC-albumin complexes were evaluated based on the fluorescence quenching effect of DHC 90
on albumins. Furthermore, binding constants were also determined, based on the fluorescence 91
enhancement of DHC by albumins. To test the potential species differences, interaction of 92
DHC with human, bovine (BSA), porcine (PSA), and rat (RSA) serum albumins was 93
investigated. To get a deeper insight into the DHC-HSA complex formation, circular 94
dichroism and thermodynamic studies were performed. Binding site of DHC on HSA was 95
evaluated based on modeling studies and experiments with site markers. Finally, to 96
5 investigate the influence of albumin on the cellular uptake of the mycotoxin, acute toxicity of 97
DHC and CIT was tested in MDCK kidney cell line, in the absence and presence of albumin.
98 99
Materials and Methods 100
Reagents 101
All reagents and solvents were of analytical or spectroscopic grade. The chemical synthesis of 102
(±)-dihydrocitrinone (DHC, MW = 266.25 g/mol) was carried out according to the synthetic 103
procedure for (±)-[13C3]-dihydrocitrinone described by Bergmann et al. (Bergmann et al., 104
2018), while (+)-DHC was purchased from AnalytiCon Discovery (Potsdam, Germany). As 105
the natural metabolite (+)-DHC has only limited availability, most studies were performed 106
with synthetic (±)-DHC and only the circular dichroism experiments with (+)-DHC. Citrinin 107
(CIT, MW = 250.25 g/mol), human serum albumin (HSA, MW = 66.4 kDa), bovine serum 108
albumin (BSA, MW = 66.4 kDa), porcine serum albumin (PSA, MW = 67.5 kDa), rat serum 109
albumin (RSA, MW = 64.6 kDa), ochratoxin A (MW = 403.8 g/mol), warfarin (WAR, MW = 110
308.33), phenylbutazone (MW = 308.37 g/mol), furosemide (MW = 330.74 g/mol), ibuprofen 111
(MW = 206.28 g/mol), methyl orange (MW = 327.34 g/mol), bilirubin (MW = 584.66 g/mol), 112
zearalenone (MW = 318.36 g/mol), L-thyroxine (MW = 776.87 g/mol), and Dulbecco’s 113
Modified Eagle Medium (DMEM) were purchased from Sigma-Aldrich. Fetal bovine serum 114
(FBS, from Pan-Biotech) and Bioluminescent ATP Assay Kit CLSII (from Roche) were used 115
as received. Stock solution of DHC (2500 µmol/L, 0.666 g/L), CIT (2500 µmol/L, 0.626 g/L), 116
ochratoxin A (5000 µmol/L, 2.019 g/L), zearalenone (5000 µmol/L, 1.592 g/L), ibuprofen 117
(2500 µmol/L), furosemide (2500 µmol/L), phenylbutazone (2500 µmol/L), warfarin (2500 118
µmol/L), and L-thyroxine (2500 µmol/L)were prepared in 96 v/v% ethanol (Renal, 119
spectroscopic grade); while methyl orange (2000 µmol/L) and bilirubin (500 µmol/L) were 120
dissolved in dimethyl sulfoxide (Fluka, spectroscopic grade). Stock solutions were stored at - 121
6 20 °C protected from light. To mimic extracellular physiological conditions, measurements 122
were carried out in phosphate-buffered saline (PBS: 8.00 g/L NaCl, 0.20 g/L KCl, 1.81 g/L 123
Na2HPO4 × 2H2O, 0.24 g/L KH2PO4; pH 7.4).
124 125
Spectroscopic measurements 126
Steady-state fluorescent spectroscopic and fluorescence anisotropy measurements were 127
carried out employing a Hitachi F-4500 fluorescence spectrophotometer (Tokyo, Japan).
128
Analyses were performed at 25 °C (except thermodynamic studies) in the presence of air. In 129
order to exclude the inner filter effect, UV-Vis spectra of DHC, CIT, warfarin, 130
phenylbutazone, furosemide, ibuprofen, methyl orange, bilirubin, zearalenone, and L- 131
thyroxine were also recorded, applying a Specord Plus 210 (Analytic Jena AG, Jena, 132
Germany) spectrophotometer. Fluorescence emission intensities were corrected with the 133
following equation (Hu and Liu, 2015):
134
𝐼𝑐𝑜𝑟 = 𝐼𝑜𝑏𝑠∗ 𝑒(𝐴𝑒𝑥+𝐴𝑒𝑚)/2 (1) 135
where Icor and Iobs denote the corrected and observed fluorescence emission intensities, 136
respectively; while Aex and Aem are the absorbance values of compounds (DHC, CIT 137
ibuprofen, warfarin, phenylbutazone, furosemide, methyl orange, bilirubin, zearalenone, L- 138
thyroxine) at the excitation and emission wavelengths used, respectively.
139
During fluorescence quenching studies, increasing concentrations of DHC (0.0, 0.5, 1.0, 2.0, 140
3.0, and 4.0 μmol/L; 0.00-1.07 mg/L range) were added to standard amount of albumin (2 141
μmol/L) in PBS (pH 7.4). Quenching experiments were evaluated based on the Stern-Volmer 142
equation (Hu and Liu, 2015):
143
𝐼0
𝐼 = 1 + 𝐾𝑆𝑉∗ [𝑄] (2)
144
7 where I0 and I are fluorescence intensities of albumin without and with DHC, respectively (λex
145
= 295 nm, λem = 340 nm), KSV is the Stern-Volmer quenching constant (unit: L/mol), while 146
[Q] is the concentration of the quencher (unit: mol/L).
147
Binding constants (K) of DHC-albumin complexes were determined by non-linear fitting, 148
using the Hyperquad2006 program package (Protonic Software), during which the following 149
equations were implemented in the Hyperquad code (SA: serum albumin) (Faisal et al., 2018):
150
𝑝𝑆𝐴 + 𝑞𝐷𝐻𝐶 ↔ 𝑆𝐴𝑝𝐷𝐻𝐶𝑞 (3)
151
𝛽𝑝𝑞 = [𝑆𝐴𝑝𝐷𝐻𝐶𝑞]
[𝑆𝐴]𝑝[𝐷𝐻𝐶]𝑞 (4)
152
where p and q indicate the stoichiometry of the equilibrium in the solution. In Hyperquad2006 153
computer fitting program all equilibrium constants were defined as overall binding constants 154
(see below).
155
𝑆𝐴 + 𝐷𝐻𝐶 ↔ 𝑆𝐴 𝐷𝐻𝐶 𝛽1 = [𝑆𝐴 𝐷𝐻𝐶]
[𝑆𝐴][𝐷𝐻𝐶] (5)
156
𝑆𝐴 + 𝑞𝐷𝐻𝐶 ↔ 𝑆𝐴 𝐷𝐻𝐶𝑞 𝛽𝑞 = [𝑆𝐴 𝐷𝐻𝐶𝑞]
[𝑆𝐴][𝐷𝐻𝐶]𝑞 (6)
157
The relationship between the overall binding constants and the stepwise binding constants were 158
calculated by the Hyperquad based on the followings.
159
𝛽1 = 𝐾1; 𝛽𝑞= 𝐾1× 𝐾2… × 𝐾𝑞 (7) 160
The stoichiometry and binding constant of DHC-albumin complexes were determined using the 161
model associated with the lowest standard deviation.
162
Fluorescence spectra of DHC and DHC-albumin complexes were recorded applying 325 and 163
405 nm as excitation and emission wavelengths, respectively. Increasing albumin 164
concentrations (0, 0.5, 1.0, 1.5, 2.0, 3.0, 4.0, 5.0, 6.0, 8.0, 10.0, 12.5, and 15.0 µmol/L) were 165
added to standard amount of DHC (2 µmol/L, 0.533 mg/L) in PBS (pH 7.4). Binding 166
constants were determined by the Hyperquad2006 software (see Eqs. 3-7).
167
8 To investigate the displacement of DHC from HSA by site markers, increasing concentrations 168
of ibuprofen, phenylbutazone, furosemide, methyl orange, bilirubin, zearalenone, and L- 169
thyroxine (0, 1, 2, 4, and 6 µmol/L each) were added to standard amount of DHC and HSA (2 170
and 4 µmol/L, respectively). Fluorescence emission spectra were recorded in PBS (pH 7.4) 171
using the wavelength maximum of DHC-albumin complexes (λex = 325 nm, λem = 405 nm).
172
Since the complex formation of DHC with albumin results in significant enhancement of the 173
fluorescence of the mycotoxin metabolite, displacement of DHC from HSA leads to the 174
significant decrease of its fluorescence signal.
175
Thereafter, the influence of DHC (vs. CIT and warfarin) on the fluorescence anisotropy of 176
ochratoxin A-HSA complex was examined using the previously described method (Poór et 177
al., 2015). Increasing concentrations of DHC, CIT, and warfarin (0-30 µmol/L each) were 178
added to standard amounts of ochratoxin A and HSA (1 µmol/L and 1.5 µmol/L, respectively) 179
in PBS (pH 7.4). Then fluorescence anisotropy values of these samples were determined using 180
394 and 447 nm as excitation and emission wavelengths, respectively (wavelength maxima of 181
albumin-bound ochratoxin A). Fluorescence anisotropy (r) data were calculated employing 182
the following equation (Lakowicz, 2006):
183
𝑟 = (𝐼𝑉𝑉−𝐺×𝐼𝑉𝐻)
(𝐼𝑉𝑉+2×𝐺×𝐼𝑉𝐻) (8)
184
where G is the instrumental factor, IVV and IVH are emission intensities measured in vertical 185
position of polarizer at pre-sample site, and at vertical and horizontal position of post-sample 186
polarizer, respectively.
187 188
Circular dichroism 189
The circular dichroism spectra of (+)-DHC were measured at room temperature using a 1 cm 190
cell with a Jasco J-600 CD spectrometer (Jasco, Groß-Umstadt, Germany). The spectra were 191
recorded between 200-270 nm with 1 nm step size, 1 nm bandwidth, 100 nm/min speed and 192
9 an average time of 0.5 s. Five measurements from each sample were performed and averaged 193
without using the smoothing function. Two different DHC concentrations (0.48 µmol/L = 194
0.128 mg/L and 0.96 µmol/L = 0.256 mg/L) were incubated in duplicates with 0.48 µmol/L 195
HSA in 30 mmol/L phosphate buffer (4.4 g/L Na2HPO4, 0.6 g/L KH2PO4, pH was adjusted to 196
7.4 with 0.1 mol/L H3PO4) for 5 h at room temperature while shaking. The same HSA 197
solution at a concentration of 0.48 µmol/L (determined by Bradford assay) was used for all 198
experiments. Ellipticity (θMRE) was used for converting the observed ellipticity (θobs) to the 199
mean residue based on the following equation:
200
θMRE = θobs
10 x Cp x n x l (9)
201
where Cp is the protein concentration (4.8 x 10⁻⁷ mol/L), n is the number of amino acids of 202
HSA (584) and l is the length of the cuvette (1 cm). For the calculation of the α-helix 203
percentage, the following equation was employed, and software K2D3 was utilized (Wang et 204
al., 2013; Ajmal et al., 2017; Louis-Jeune et al., 2012).
205
α-helix (%) = -θMRE 208nm - 4000
33000 - 4000 x 100 (10)
206
For the K2D3 software the θMRE from 200-240 nm and the protein size of 584 amino acids 207
were applied.
208 209
Thermodynamic studies 210
To get a deeper insight into the DHC-HSA interaction, thermodynamic parameters were 211
determined, during which binding constants of complexes were calculated at six different 212
temperatures (298, 301, 304, 307, 310, and 313 K). Binding constants (K) were quantified 213
based on fluorescence spectroscopic measurements employing the Hyperquad2006 software 214
(see Eqs. 3-7), using 325 and 405 nm excitation and emission wavelengths, respectively.
215
Thermodynamic parameters associated to the complex formations between DHC and HSA 216
were determined using the van’t Hoff equation:
217
10 𝑙𝑜𝑔𝐾 = −∆𝐺
𝑅𝑇= − ∆𝐻
2.303×𝑅×𝑇+ ∆𝑆
2.303×𝑅 (11)
218
where ΔG, ΔH, and ΔS reflect the Gibbs free energy, enthalpy, and entropy changes of the 219
binding reaction, respectively; while R refers to the gas constant and T is the temperature.
220 221
Modeling studies 222
The ligand structure was built in Maestro (Schrödinger, 2017). The raw structure was energy 223
minimized, using the semi-empirical quantum chemistry program package, MOPAC (Stewart, 224
1990) and the PM6 parameterization (Stewart, 2007). The gradient norm was set to 0.001.
225
The energy minimized structure was subjected to force calculations. The force constant 226
matrices were positive definite. The minimized ligand structures were then used in our 227
docking calculations.
228
An apo crystallographic structure (PDB code: 1ao6) of HSA was used as target molecule in 229
our calculations. Acetyl and amide capping groups were attached to the N- and C-termini, 230
respectively, using the Schrödinger Maestro program package v. 9.6 (Schrödinger, 2017). As 231
1ao6 contains a homodimer structure, only chain A was used for calculations. Co-crystallized 232
ions and water molecules were removed before minimizing the protein structure. The target 233
molecule was minimized using a two-step protocol with the GROMACS software package 234
(Abraham et al., 2015), including a steepest descent and a conjugate gradient step, and using 235
AMBER99-ildn force field (Lindorff-Larsen et al., 2010). Exit tolerance levels were set to 236
1000 and 10 kJ mol−1 nm−1 while maximum step sizes were set to 0.5 and 0.05 nm, 237
respectively. The minimized target was then used in our docking calculations.
238
Using the optimized ligand and target structures, blind docking calculations were performed 239
with AutoDock 4.2 program package (Morris et al., 2009) as described in our previous 240
publications (Poór et al., 2015; Hetényi and van der Spoel, 2002, 2006, 2011). Gasteiger- 241
Marsilli partial charges were added to both the ligand and target atoms, using AutoDock 242
11 Tools (Morris et al., 2009) and united atom representation was applied for non-polar moieties.
243
A grid box of 250 × 250 × 250 points, and 0.375 Å spacing was calculated and centered on 244
target center of mass by AutoGrid 4. Lamarckian genetic algorithm was used for global 245
search. Flexibility was allowed on the ligand at all active torsions, number of docking runs 246
was set to 100, numbers of energy evaluations and generations were 20 million (Hetényi and 247
van der Spoel, 2006). Ligand conformations that resulted from the docking runs were ordered 248
by the corresponding calculated interaction energy values and subsequently clustered using a 249
tolerance of 1.75 Å root mean square deviation (RMSD) between cluster members (Hetényi 250
and van der Spoel, 2002).
251 252
Cell cultures and ATP-based cell viability assay 253
MDCK (Madin-Darby canine kidney epithelial cells, ATCC: CCL-34) adhesion cell line was 254
cultured in DMEM supplemented with 10% FBS, penicillin (100 U/mL), and streptomycin 255
(100 µg/mL), in a humidified atmosphere (5% CO2) at 37 °C. Trypsinized cells were plated in 256
96-well plastic plates (approximately 104 cells/well). Before the treatment, the culture 257
medium was replaced with fresh one (without FBS/HSA, with FBS, or with HSA), then cells 258
were incubated with 50 µmol/L (DHC: 13.313 mg/L; CIT: 12.513 mg/L) or 100 µmol/L 259
(DHC: 26.625 mg/L; CIT: 25.025 mg/L) mycotoxin concentrations in the absence and in the 260
presence of 10% FBS or 40 g/L HSA. After 24-h incubation, ATP levels were quantified 261
applying the previously described method without any modifications (Sali et al., 2016).
262 263
Statistics 264
Means and standard error (± SEM) values expressed in figures. Statistical evaluation of 265
experiments with site markers and in vitro cell experiments were carried out using one-way 266
12 ANOVA test (IBM SPSS Statistics, Version 21), during which the level of significance was 267
set at p < 0.05 and p < 0.01.
268 269
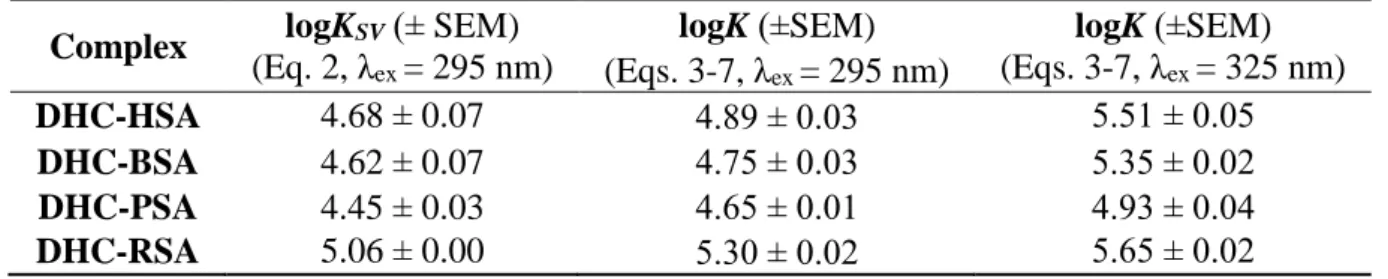
Results and Discussion 270
Fluorescence spectroscopic investigation of DHC in the absence and presence of HSA 271
First, the fluorescence excitation and emission spectra of DHC were recorded in PBS (pH 272
7.4). Despite the parent compound (CIT) does not express fluorescence at physiological pH 273
(Poór et al., 2016), conversion of CIT to DHC leads to significant spectral changes. As Fig.
274
S1 demonstrates, DHC showed fluorescence property in PBS, exerting its excitation and 275
emission wavelength maxima at 325 and 420 nm, respectively.
276
Because interaction of fluorophores with albumin can lead to changes in their fluorescence 277
(Sueck et al., 2018), the influence of HSA on the fluorescence emission spectrum of DHC 278
was tested. Increasing amounts of HSA (final concentrations: 0-15 μmol/L) were added to 279
DHC (2 μmol/L) in PBS, then emission spectra were recorded (λex = 325 nm). In a dose 280
dependent fashion, HSA caused a significant fluorescence enhancement of DHC, during 281
which the blue shift of the emission wavelength maximum of DHC (420 → 405 nm) was 282
noticed (Fig. 2a). Under the applied conditions, HSA also shows some fluorescence emission;
283
however, the increase in fluorescence resulted from the presence of HSA is relatively low 284
(Fig. 2b). Considering the highest molecular orbital of DHC, the aromatic moiety takes part in 285
the fluorescence process through two ways: (a) the interaction of the aromatic ring in DHC 286
with the surface of albumin modifies the fluorescence efficiency of the aromatic moiety; (b) 287
the partial removal of water molecules from the solvation shell of DHC, prior its interaction 288
with the albumin, enhances the fluorescence of DHC due to the reduced number of the 289
quencher water molecules in the solvation shell. These observations strongly suggest the 290
formation of DHC-HSA complexes. Since the increased fluorescence at 405 nm is partly 291
13 originating from the fluorescence signal of HSA, emission intensities were corrected during 292
the calculation of binding constants (see later in Binding constants of DHC-albumin 293
complexes section).
294 295
Fluorescence quenching of HSA by DHC 296
Fluorescence emission spectrum of HSA (2 µmol/L) was recorded in PBS (pH 7.4), in the 297
absence and presence of increasing concentrations of DHC (0-4 µmol/L; λex = 295 nm, λem = 298
340 nm). Using 295 nm as excitation wavelength, HSA shows emission maximum at 340 nm, 299
while a second peak at higher wavelength (approximately at 405 nm) also appears in the 300
presence of DHC, due to the fluorescence emission of DHC and DHC-HSA complex (Fig.
301
3a). In a concentration dependent fashion, DHC induced the decrease of the fluorescence 302
signal at 340 nm as a result of the fluorescence quenching effect of DHC on HSA. To exclude 303
the inner-filter effect, fluorescence signal of HSA was corrected based on Eq. 1. The good 304
linearity of the Stern-Volmer plot (R2 = 0.993) recommends 1:1 stoichiometry of complex 305
formation. The decrease in the slope of the Stern-Volmer plot at higher temperature values 306
suggests the static quenching process of HSA by DHC (see below in the Thermodynamics of 307
DHC-HSA complex formation section).
308 309
Binding constants of DHC-albumin complexes 310
In order to evaluate the stability of DHC-albumin complexes and the potential species 311
differences of DHC-albumin interactions, experiments described in the previous two sections 312
were performed with bovine (BSA), porcine (PSA), and rat (RSA) serum albumins. Similarly 313
to HSA, other albumins also induced the significant fluorescence enhancement of DHC (Fig.
314
S2). The strongest enhancers were HSA and RSA causing approximately 75-fold increase in 315
the fluorescence of DHC, while the less effective enhancers BSA and PSA led to the 60-fold 316
14 and 25-fold elevation of fluorescence, respectively. Fluorescence quenching effect of DHC 317
was the highest in the presence of RSA, followed by HSA and BSA, while the lowest 318
decrease of fluorescence was observed with PSA (Fig. 3b).
319
Quantitation of binding constants were determined using both models: (a) enhancement of the 320
fluorescence of DHC by albumins (Fig. S2), and (b) quenching the fluorescence of albumins 321
by DHC (Fig. 3). Decimal logarithmic values of Stern-Volmer quenching constants (KSV; unit:
322
L/mol) and binding constants (K; unit: L/mol) are demonstrated in Table 1 for each examined 323
DHC-albumin complexes. The logKSV values determined based on the Stern-Volmer equation 324
(Eq. 2) were in a good correlation with the logK values calculated using the Hyperquad 325
program (Eqs. 3-7). The quenching model suggests somewhat lower binding constants 326
compared to the other approach; however, the tendencies of species differences are similar in 327
both models. DHC forms the most stable complex with RSA, followed by HSA, BSA, and 328
PSA. The stability of DHC-RSA complex is approximately 4-5 times higher compared to 329
DHC-PSA, however, only moderate species differences were observed during the comparison 330
of the binding constant of DHC-HSA with other DHC-albumin complexes. Albumin-binding 331
of some mycotoxins shows large species-dependent differences, for example ochratoxin A 332
and zearalenone/zearalenols (Faisal et al., 2018). From this point of view, DHC behaves very 333
similarly to the parent compound CIT; the latter binds to HSA with almost the same affinity 334
(logK = 5.32) and shows similar species differences to DHC (Poór et al., 2015).
335 336
Circular dichroism (CD) of HSA with DHC 337
CD is a useful analytical tool for the characterization of the secondary structure of proteins as 338
the absorption of the circularly polarized light between 200 and 240 nm provides information 339
on the percentage of α-helices and β-sheets of a protein (Wang et al., 2013). Based on the 340
limited availability of the natural isomer (+)-DHC, it was examined only in CD experiments 341
15 (other studies were performed with (±)-DHC). In order to recognize changes in the secondary 342
structure of HSA in the presence of (+)-DHC, CD-spectra of the single compounds and their 343
mixture were recorded in the 200-270 nm range. For the CD experiments, a 0.48 µmol/L 344
concentration of HSA in 30 mmol/L phosphate buffer (pH 7.4) was used and for the 345
incubation of HSA with (+)-DHC at equimolar concentration. While (+)-DHC did not show a 346
CD effect, characteristic CD spectra for HSA and the mixture of HSA and (+)-DHC were 347
recorded (Fig. 4).
348
The mean residue ellipticity (θMRE) of the native HSA at the characteristic wavelength minima 349
of 208 nm and 222 nm indicate that the native protein had predominantly α-helix secondary 350
structure (Fig. 4). The characteristic minima that are indicative for the α-helices are caused by 351
amino acids of the protein (Wang et al., 2013). In the presence of DHC, a slight increase of 352
θMRE was observed at these characteristic wavelengths of 208 nm and 222 nm. These 353
observations suggest that the complex formation of DHC with HSA leads to a slight change in 354
the secondary structure of HSA, resulting in a decrease of α-helicity (Fig. 4). The native HSA 355
had α-helix percentage of 67.4 to 73.3% (Table 2). After incubation with DHC, the α-helicity 356
of HSA was reduced by 3-9%, suggesting the formation of DHC-HSA complexes. HSA (0.48 357
µmol/L) was also incubated with double equivalent concentration of DHC (0.98 µmol/L) 358
under the same conditions, during which no further increase of the θMRE was observed.
359 360
Thermodynamics of DHC-HSA complex formation 361
The temperature dependence of the binding constants of DHC-HSA complex was investigated 362
between 298 and 313 K. Similarly to the CIT-HSA complex (Poór et al., 2015), the logK values 363
of DHC-HSA show higher stability at lower temperatures, reflecting the presence of ground 364
state complexes. Fig. S3 demonstrates the van’t Hoff plot of DHC-HSA complex, and the 365
thermodynamic parameters derived from the slope and the intercept of the line fitted to the logK 366
16 values (Eq. 11). H and S associated to the DHC-HSA complex formation were found to be - 367
22.65 kJ mol-1 and +23.29 J K-1 mol-1, respectively. The calculated negative G value (-29.78 368
kJ mol-1) suggests the spontaneous binding process between DHC and HSA at room 369
temperature, and it is within the typical range of non-covalent interactions. These values are 370
close to the parameters obtained for CIT-HSA interaction (G = -29.96 kJ mol-1, H = -24.15 371
kJ mol-1, and S = 20.90 J K-1 mol-1) (Poór et al., 2015). Thermodynamic data indicate similar 372
binding characteristics of DHC-HSA and CIT-HSA complexes, namely electrostatic forces play 373
a major role in the complex formation. According to the entropy gain of DHC-HSA interaction, 374
it is reasonable to hypothesize the partial decomposition of the solvation shells of interacting 375
molecules, leading to a less ordered structure of water molecules (Ross and Subramanian, 376
1981).
377 378
Modeling studies 379
Blind docking calculations resulted in 100 ligand conformations, which were further clustered 380
as described in the Materials and Methods section. After clustering, five ligand conformations 381
were obtained, which were ordered by the calculated interaction energy between the target 382
and the ligand molecule. Out of the five clusters, the first four are illustrated in Fig. 5a, and 383
discussed in the followings.
384
Each analyzed docking rank bound to known binding pockets (Fanali et al., 2012). The first 385
rank (Rank 1) bound to the Sudlow’s site I (binding site of the oral anticoagulant warfarin;
386
Fig. S4a), the second rank (Rank 2) partially occupied the FA9 binding site (near to one of the 387
binding sites of L-thyroxine; Fig. S4b), the third rank (Rank 3) bound to approximately 10Å 388
distance from the binding site of mycotoxin zearalenone (Fig. S4c) (Faisal et al., 2018), and 389
the fourth rank (Rank 4) bound to the Heme binding site (FA1; one of its typical ligands is 390
bilirubin; Fig. S4d).
391
17 The binding conformation of Rank 4 DHC interacts with both hydrophobic (L115, I142) and 392
hydrophilic (R114, H146, R145, R186, K190) amino acids in the Heme binding site (Fig. 5b).
393
The DHC is secured in the Heme site through H-bonds and salt bridges between the 394
hydrophilic amino acids and the carboxyl and hydroxyl groups of the DHC. The hydrophobic 395
interactions act between L115 and I142 amino acids and the methyl groups of the DHC.
396 397
Investigation of the binding site of DHC on HSA using site markers 398
To examine the binding site of DHC on HSA, some typical ligands of Sudlow’s site I 399
(phenylbutazone and furosemide), Sudlow’s site II (ibuprofen), and Heme binding site 400
(bilirubin and methyl orange) were applied (Fanali et al., 2012; Zsila, 2013). Furthermore, to 401
test the potential involvement of Rank 2 (FA9) or Rank 3 as binding sites, the effects of L- 402
thyroxine and zearalenone on DHC-HSA interaction was also tested. In these experiments, 403
our previous observation that albumin-binding significantly increases the fluorescence signal 404
of DHC was utilized (Fig. 2). Using this principle, it is reasonable to hypothesize that the 405
displacement of DHC from albumin leads to the significant decrease in its fluorescence at 405 406
nm (emission wavelength maximum of HSA-bound DHC). Therefore, fluorescence emission 407
spectrum of DHC-HSA complex (2 and 4 µmol/L, respectively) was recorded in the presence 408
of increasing concentrations of site markers (0, 1, 2, 4, and 6 µmol/L) in PBS (λex = 325 nm).
409
The concentrations of solvents did not exceed 1.2 v/v% which did not influence the 410
fluorescence of DHC-HSA complex in the absence of site markers. As Fig. 6a demonstrates, 411
the presence of L-thyroxine, zearalenone, and the markers of Sudlow’s site I and II induced 412
negligible changes in the fluorescence of DHC-HSA complex. On the other hand, both 413
markers of the Heme binding site (methyl orange and bilirubin) significantly decreased the 414
fluorescence at 405 nm, suggesting the displacement of DHC from HSA by these compounds, 415
and the involvement of the Heme binding site regarding DHC-HSA interaction. The binding 416
18 constant of bilirubin-HSA complex is much higher compared to methyl orange-HSA (Ahlfors, 417
1981; Zsila, 2013), which is in agreement with our observation that bilirubin can induce 418
stronger displacement of DHC from HSA compared to methyl orange.
419
Previous investigations revealed that CIT occupies Sudlow’s site I as its primary binding site 420
on HSA (Poór et al., 2015). Since the binding constant, the binding mode, and species 421
differences of DHC-albumin complex are very similar to the CIT-albumin complex, it is 422
surprising that DHC occupies another binding site than CIT. Thus, to confirm these results, 423
further experiments were performed with the known markers of site I, namely warfarin and 424
ochratoxin A (Il’ichev et al., 2002). During this experiment, our previously described model 425
was employed (Poór et al., 2015). Since ochratoxin A is a small fluorophore, its interaction 426
with the macromolecule (HSA) results in the significant decrease in its rotational freedom and 427
consequently the strong increase of fluorescence polarization or anisotropy values of the 428
mycotoxin. Based on these principles, albumin-binding of ochratoxin A can be precisely 429
followed by fluorescence polarization or anisotropy techniques (Poór et al., 2015).
430
Fluorescence anisotropy of ochratoxin A with HSA (1.0 and 1.5 µmol/L, respectively) were 431
determined in the presence of increasing concentrations of DHC, CIT, or warfarin (each 0, 1, 432
5, 10, 20, and 30 µmol/L). CIT and warfarin induced similar (but statistically not significant) 433
decrease in the fluorescence anisotropy of ochratoxin A, while DHC caused only a slight 434
effect (Fig. 6b). Since the decrease in fluorescence anisotropy is resulted from the increased 435
rotational freedom of ochratoxin A, this observation suggests the displacement of ochratoxin 436
A from HSA in the presence of CIT and warfarin. The fact that even relatively large 437
concentrations of DHC failed to significantly decrease the anisotropy value of ochratoxin A 438
supports our previous finding that the binding site of DHC is not located in Sudlow’s site I.
439 440
Influence of albumin on the acute cellular toxicity of DHC and CIT 441
19 In order to examine the influence of albumin on the acute cellular toxicity of DHC and CIT, 442
MDCK kidney cells were treated with these mycotoxins in the absence and presence of 10%
443
FBS or 40 g/L HSA. Cell culture media usually contains 10% FBS (final concentration of 444
BSA: approximately 3.5 g/L), while 40 g/L is a typical HSA concentration in the human 445
blood. Since the acute cytotoxicity of DHC and CIT is relatively low, high mycotoxin 446
concentrations (50 and 100 μmol/L) were applied to produce remarkable toxic effects. Each 447
sample (including the control) contained the same ethanol concentrations (4 v/v%, which was 448
the solvent of CIT and DHC). Mycotoxin-induced loss of cell viability was evaluated based 449
on ATP levels/well after 24-h incubation. As Fig. 7 demonstrates, the applied mycotoxin 450
concentrations caused significant decrease of ATP. In agreement with previous studies, the 451
lower toxicity of DHC was observed compared to CIT (Föllmann et al., 2014). In the presence 452
of FBS and HSA, the cytotoxicity of both CIT and DHC significantly decreased (Fig. 7), most 453
likely due to the formation of stable mycotoxin-albumin complexes which can limit the 454
cellular uptake of these mycotoxins. Stronger effect of HSA (vs. FBS) can be mainly 455
attributed to the lower BSA concentration in the cell medium (3.5 g/L BSA vs. 40 g/L HSA).
456
Therefore, our results demonstrate that the interaction of DHC with albumin may significantly 457
affect the tissue uptake of the mycotoxin.
458
In conclusion, the interaction of DHC with albumin was investigated by fluorescence 459
spectroscopy, circular dichroism, and molecular modeling. Binding constant and binding site, 460
species-dependent alternations, and thermodynamics of the interaction were characterized, as 461
well as the effects of albumin on the in vitro cytotoxicity of DHC and CIT were also tested.
462
DHC exerts fluorescence signal at physiological conditions, which is strongly enhanced by 463
albumin. Besides the increased fluorescence of DHC in the presence of albumins, the 464
formation of DHC-albumin complexes is also supported by fluorescence quenching and 465
circular dichroism studies. Stability of DHC-HSA, DHC-BSA, and DHC-PSA complexes 466
20 were similar, while DHC binds to RSA with slightly higher affinity compared to other
467
albumins tested. Binding constant of DHC-HSA complex is similar to CIT-HSA; however, 468
DHC occupies Heme binding site (FA1; subdomain IB) on HSA while CIT is a ligand of 469
Sudlow’s Site I (subdomain IIA). Thermodynamic studies suggest the spontaneous binding 470
process between DHC and HSA at room temperature, during which electrostatic forces play a 471
major role. Furthermore, the partial decomposition of the solvation shells can be assumed.
472
Albumin decreased significantly the toxic effects of both DHC and CIT on MDCK cells, 473
which also confirms the formation of stable mycotoxin-albumin complexes.
474 475
Source of Funding 476
This project was supported by the Hungarian National Research, Development and Innovation 477
Office (FK125166) (M.P.) and the Deutsche Forschungsgemeinschaft (GRK1143, IRTG 478
Münster-Nagoya) (H.H.). The work of M.B. and C.H. was supported by the Hungarian 479
National Research, Development and Innovation Office (K123836).
480 481
Acknowledgements 482
This project was supported by the János Bolyai Research Scholarship of the Hungarian 483
Academy of Sciences (M.P.). M.P. is thankful for support of the University of Pécs for grant 484
in the frame of Pharmaceutical Talent Centre program. This work was supported by the 485
GINOP-2.3.2-15-2016-00049 grant. This project was supported by the ÚNKP-18-2 New 486
National Excellence Program of the Ministry of Human Capacities (V.V.). We acknowledge a 487
grant of computer time from CSCS Swiss National Supercomputing Centre, and the 488
Governmental Information Technology Development Agency, Hungary. We acknowledge 489
that the results of this research have been achieved using the DECI resource Archer based in 490
the UK at the National Supercomputing Service with support from the PRACE aisbl. The 491
21 University of Pécs is acknowledged for a support by the 17886-4/23018/FEKUTSTRAT 492
excellence grant.
493 494
Conflict of interest: The authors declare no conflict of interest. We have full control of all 495
primary data and we agree to allow the journal to review our data if requested.
496 497
References 498
Abraham MJ, Murtola T, Schulz R, Páll S, Smith JC, Hess B, Lindahl E (2015) GROMACS:
499
high performance molecular simulations through multi-level parallelism from laptops to 500
supercomputers. SoftwareX 1:19-25.
501
https://doi.org/10.1016/j.softx.2015.06.001 502
503
Ahlfors CE (1981) Competitive interaction of biliverdin and bilirubin only at the primary 504
bilirubin binding site on human albumin. Anal Biochem 110:295-307.
505
https://doi.org/10.1016/0003-2697(81)90195-0 506
507
Ajmal MR, Nusrat S, Alam P, Zaidi N, Khan MV, Zaman M, Shahein YE, Mahmoud MH, 508
Badr G, Khan RH (2017) Interaction of anticancer drug clofarabine with human serum 509
albumin and human α-1 acid glycoprotein. Spectroscopic and molecular docking approach. J 510
Pharm Biomed Anal, 135:106-115.
511
https://doi.org/10.1016/j.jpba.2016.12.001 512
513
Ali N, Blaszkewicz M, Degen GH (2015) Occurrence of the mycotoxin citrinin and its 514
metabolite dihydrocitrinone in urines of German adults. Arch Toxicol 89:573-578.
515
https://doi.org/10.1007/s00204-014-1363-y 516
22 517
Ali N, Hossain K, Degen GH (2018) Blood plasma biomarkers of citrinin and ochratoxin A 518
exposure in young adults in Bangladesh. Mycotoxin Res 34:59–67.
519
https://doi.org/10.1007/s12550-017-0299-5 520
521
Bennett JW, Klich M (2003) Mycotoxins. Clin Microbiol Rev 16:497-516.
522
https://doi.org/10.1128/CMR.16.3.497–516.2003 523
524
Bergmann D, Hübner F, Wibbeling B, Daniliuc C, Cramer B, Humpf H-U (2018) Large-scale 525
total synthesis of 13C3-labeled citrinin and its metabolite dihydrocitrinone. Mycotoxin Res 526
34:141-150.
527
https://doi.org/10.1007/s12550-018-0308-3 528
529
Ciegler A, Bennett JW (1980) Mycotoxins and Mycotoxicoses. BioScience 30:512-515.
530
https://doi.org/10.2307/1307970 531
532
da Rocha MEB, Freire FCO, Maia FEF, Guedes MIF, Rondina D (2014) Mycotoxins and 533
their effects on human and animal health. Food Control 36:59-165.
534
https://doi.org/10.1016/j.foodcont.2013.08.021 535
536
Damodaran C (1977) In vitro binding of citrinin to serum protein. Experientia 33:598-599.
537
https://doi.org/10.1007/BF01946519 538
539
Damodaran C, Shanmugasundaram E (1978) Distribution of radioactive citrinin in tissues and 540
serum protein(s). J Radioanal Chem 46:373-377.
541
23 https://doi.org/10.1007/BF02519903
542 543
Degena GH, Ali N, Gundert-Remy U (2018) Preliminary data on citrinin kinetics in humans 544
and their use to estimate citrinin exposure based on biomarkers. Toxicol. Lett. 282:43-48.
545
http://dx.doi.org/10.1016/j.toxlet.2017.10.006 546
547
de Oliveira Filho JWG, Islam MT, Ali ES, Uddin SJ, Santos JVO, de Alencar MVOB, Júnior 548
ALG, Paz MFCJ, de Brito MDRM, e Sousa JMC, Shaw S, de Medeiros MDGF, Dantas 549
SMMM, Rolim HML, Ferreira PMP, Kamal MA, Pieczynska MD, Das N, Gupta VK, Mocan 550
A, Dos Santos Andrade TJA, Singh BN, Mishra SK, Atanasov AG, Melo-Cavalcante AAC 551
(2017) A comprehensive review on biological properties of citrinin. Food Chem Toxicol 552
110:130-141.
553
https://doi.org/10.1016/j.fct.2017.10.002 554
555
Dunn BB, Stack ME, Park DL, Joshi A, Friedman L, King RL (1983) Isolation and 556
identification of dihydrocitrinone, a urinary metabolite of citrinin in rats. J Toxicol Environ 557
Health 12:283-289.
558
https://doi.org/10.1080/15287398309530426 559
560
Faisal Z, Lemli B, Szerencsés D, Kunsági-Máté S, Bálint M, Hetényi C, Kuzma M, Mayer M, 561
Poór M (2018) Interactions of zearalenone and its reduced metabolites α-zearalenol and β- 562
zearalenol with serum albumins: species differences, binding sites, and thermodynamics.
563
Mycotoxin Res. 34:269-278.
564
https://doi.org/10.1007/s12550-018-0321-6 565
566
24 Fanali G, di Masi A, Trezza V, Marino M, Fasano M, Ascenzi P (2012) Human serum
567
albumin: From bench to bedside. Mol Asp Med 33:209-290.
568
https://doi.org/10.1016/j.mam.2011.12.002 569
570
Flajs D, Peraica M (2009) Toxicological Properties of Citrinin. Arh Hig Rada Toksikol 571
60:457-464.
572
https://doi.org/10.2478/10004-1254-60-2009-1992 573
574
Föllmann W, Behm C, Degen GH (2014) Toxicity of the mycotoxin citrinin and its metabolite 575
dihydrocitrinone and of mixtures of citrinin and ochratoxin A in vitro. Arch Toxicol 88:1097- 576
1107.
577
https://doi.org/10.1007/s00204-014-1216-8 578
579
Gerding J, Ali N, Schwartzbord J, Cramer B, Brown DL, Degen GH, Humpf H-U (2015) A 580
comparative study of the human urinary mycotoxin excretion patterns in Bangladesh, 581
Germany and Haiti using a rapid and sensitive LC-MS/MS approach. Mycotoxin Res 31:127- 582
136.
583
https://doi.org/10.1007/s12550-015-0223-9.
584 585
Hetényi C, van der Spoel D (2002) Efficient docking of peptides to proteins without prior 586
knowledge of the binding site. Protein Sci 11:1729-1737.
587
https://doi.org/10.1110/ps.0202302 588
589
Hetényi C, van der Spoel D (2006) Blind docking of drug-sized compounds to proteins with 590
up to a thousand residues. FEBS Lett 580:1447-1450.
591
25 https://doi.org/10.1016/j.febslet.2006.01.074
592 593
Hetényi C, van der Spoel D (2011) Toward prediction of functional protein pockets using 594
blind docking and pocket search algorithms. Protein Sci 20:880-893.
595
https://doi.org/10.1002/pro.618 596
597
Hu T, Liu Y (2015) Probing the interaction of cefodizime with human serum albumin using 598
multi-spectroscopic and molecular docking techniques. J Pharm Biomed Anal 107:325-332.
599
https://doi.org/10.1016/j.jpba.2015.01.010 600
601
Huybrechts B, Martins JC, Debongnie Ph, Uhlig S, Callebaut A (2015) Fast and sensitive 602
LC–MS/MS method measuring human mycotoxin exposure using biomarkers in urine. Arch 603
Toxicol 89:1993-2005.
604
https://doi.org/10.1007/s00204-014-1358-8 605
606
Il’ichev YV, Perry JL, Simon JD (2002) Interaction of Ochratoxin A with Human Serum 607
Albumin. A Common Binding Site of Ochratoxin A and Warfarin in Subdomain IIA. J Phys 608
Chem B 106:460-465.
609
https://doi.org/10.1021/jp012315m 610
611
Lakowicz JR (2006) Fluorescence Anisotropy In: Principles of Fluorescence Spectroscopy 612
3rd edn. Baltimore, Maryland, pp 353-382.
613 614
26 Lindorff-Larsen K, Piana S, Palmo K, Maragakis P, Klepeis JL, Dror RO, Shaw DE (2010) 615
Improved side-chain torsion potentials for the Amber ff99SB protein force field. Proteins 616
78:1950-1958.
617
https://doi.org/10.1002/prot.22711 618
619
Louis-Jeune C, Andrade-Navarro MA, Perez-Iratxeta C (2012) Prediction of protein 620
secondary structure from circular dichroism using theoretically derived spectra. Proteins 621
80:374-381.
622
https://doi.org/10.1002/prot.23188 623
624
Morris GM, Huey R, Lindstrom W, Sanner MF, Belew RK, Goodsell DS, Olson AJ (2009) 625
AutoDock4 and AutoDockTools4: automated docking with selective receptor flexibility. J 626
Comput Chem 30:2785-2791.
627
https://doi.org/10.1002/jcc.21256 628
629
Peraica M, Domijan AM, Miletic´-Medved M, Fuchs R (2008) The involvement of 630
mycotoxins in the development of endemic nephropathy. Wien Klin Wochen 120: 402-407.
631
https://doi.org/10.1007/s00508-008-0981-x 632
633
Poór M, Lemli B, Bálint M, Hetényi C, Sali N, Kőszegi T, Kunsági-Máté S (2015) Interaction 634
of citrinin with human serum albumin. Toxins 7:5155-5166.
635
https://doi.org/10.3390/toxins7124871 636
637
27 Poór M, Matisz G, Kunsági-Máté S, Derdák D, Szente L, Lemli B (2016) Fluorescence
638
spectroscopic investigation of the interaction of citrinin with native and chemically modified 639
cyclodextrins. J Lumin 172:23-28.
640
https://doi.org/10.1016/j.jlumin.2015.11.011 641
642
Ross PD, Subramanian S (1981) Thermodynamics of protein association reactions: forces 643
contributing to stability. Biochemistry 20:3096-3102.
644
https://doi.org/10.1021/bi00514a017 645
646
Sali N, Nagy S, Poór M, Kőszegi T (2016) Multiparametric luminescent viability assay in 647
toxicology models: a critical evaluation. J Pharmacol Toxicol Methods 79:45-54.
648
https://doi.org/10.1016/j.vascn.2016.01.004 649
650
Schrödinger LLC. (2017) New York, NY 651
652
Stewart JJ. MOPAC 2007 (2007) Version 7, 290 W. Stewart Computational Chemistry, 653
Colorado Springs, CO 654
655
Sueck F, Poór M, Faisal Z, Gertzen CGW, Cramer B, Lemli B, Kunsági-Máté S, Gohlke H, 656
Humpf H-U (2018) Interaction of ochratoxin A and its thermal degradation product 2'R- 657
ochratoxin A with human serum albumin. Toxins 10: E256.
658
https://doi.org/10.3390/toxins10070256 659
660
Wang Q, Yan J, He J, Bai K, Li H (2013) Characterization of the interaction between 3- 661
xotabersonine and two serum albumins by using spectroscopic techniques. J Lumin 138:1-7.
662
28 https://doi.org/10.1016/j.jlumin.2013.01.035
663 664
Yamasaki K, Chuang VT, Maruyama T, Otagiri M (2013) Albumin-drug interaction and its 665
clinical implication. Biochim Biophys Acta 1830:5435-5443.
666
https://doi.org/10.1016/j.bbagen.2013.05.005 667
668
Zsila F (2013) Subdomain IB Is the Third Major Drug Binding Region of Human Serum 669
Albumin: Toward the Three-Sites Model. Mol Pharmaceutics 10:1668-1682.
670
https://doi.org/10.1021/mp400027q 671
29 List of figures:
672 673
Fig. 1 Chemical structures of citrinin and dihydrocitrinone 674
675
Fig. 2 a Fluorescence emission spectrum of DHC (2 μmol/L) in the presence of increasing 676
HSA concentrations (0-15 µmol/L) in PBS. b Fluorescence emission intensities of HSA 677
without DHC (IHSA), DHC with HSA (IDHC+HSA), and the difference of DHC+HSA and HSA 678
(IDHC+HSA - IHSA) (b; λex = 325 nm, λem = 405 nm) (representative spectra and data) 679
680
Fig. 3 a Fluorescence emission spectrum of HSA (2 μmol/L) in the presence of increasing 681
DHC concentrations (0-4 µmol/L) in PBS (pH 7.4; λex = 295 nm; representative spectra). b 682
Stern-Volmer plots of DHC-albumin (2 μmol/L albumin and 0-4 μmol/L DHC) complexes in 683
PBS (pH 7.4; λex = 295 nm, λem = 340 nm; data were corrected based on Eq. 1) (representative 684
spectra and data) 685
686
Fig. 4 Average CD spectra of native HSA (0.48 µmol/L) and (+)-DHC-HSA complex (each 687
0.48 µmol/L) after 5-h incubation in 30 mmol/L phosphate buffer (pH 7.4; representative 688
spectra) 689
690
Fig. 5 a The first four docked DHC conformations (Ranks 1-4) on HSA. b Detailed 691
presentation of Rank 4 DHC conformation surrounded by interacting amino acids of HSA 692
693
Fig. 6 a Fluorescence intensity of DHC and HSA (2 and 4 µmol/L, respectively) in the 694
presence of increasing concentrations of site marker (0-6 µmol/L) in PBS (pH 7.4; λex = 325 695
nm, λem = 405 nm). b Fluorescence anisotropy values of ochratoxin A (1 µmol/L) in the 696
30 presence of HSA (1.5 µmol/L) and increasing concentrations of dihydrocitrinone (DHC), 697
citrinin (CIT), and warfarin (WAR) (0-30 µmol/L each) in PBS (pH 7.4; λex = 393 nm, λem = 698
446 nm). Data represent mean ± SEM (n = 3; * p < 0.05, ** p < 0.01) 699
700
Fig. 7 Effects of DHC (a) and CIT (b) on the ATP levels of MDCK cells after 24-hr 701
incubation, in the absence and presence of FBS (10%) or HSA (40 g/L) (compared to the 702
control: ** p < 0.01; compared to the effect without albumin: # p < 0.05, ## p < 0.01). Data 703
represent mean ± SEM (n = 3) 704
705
31 Tables
706 707
Table 1 Decimal logarithmic values of Stern-Volmer quenching constants (KSV; unit: L/mol) 708
and binding constants (K; unit: L/mol) of DHC-albumin complexes (see details in the 709
“Spectroscopic measurements” section)Data represent mean ± SEM (n = 3) 710
Complex logKSV (± SEM) (Eq. 2, λex = 295 nm)
logK (±SEM) (Eqs. 3-7, λex = 295 nm)
logK (±SEM) (Eqs. 3-7, λex = 325 nm)
DHC-HSA 4.68 ± 0.07 4.89 ± 0.03 5.51 ± 0.05
DHC-BSA 4.62 ± 0.07 4.75 ± 0.03 5.35 ± 0.02
DHC-PSA 4.45 ± 0.03 4.65 ± 0.01 4.93 ± 0.04
DHC-RSA 5.06 ± 0.00 5.30 ± 0.02 5.65 ± 0.02
DHC dihydrocitrinone, HSA human serum albumin, BSA bovine serum albumin, PSA porcine 711
serum albumin, RSA rat serum albumin 712
713
Table 2 α-helix contents of HSA (0.48 µmol/L) and HSA after its incubation with (+)-DHC 714
(both 0.48 µmol/L) in 30 mmol/L PBS (pH 7.4). α-helix percentage calculated with Eq. 10*
715
and with the K2D3 software** (Louis-Jeune et al., 2012).Data represent mean ± SEM (n = 2) 716
HSA + (+)-DHC (ratio)
α-helix*
(%)
α-helix **
(%) relative difference
HSA 73.3 ± 0.3 67.4 ± 0.2
3-9%
HSA + (+)-DHC (1:1) 66.7 ± 0.5 65.7 ± 0.3 DHC dihydrocitrinone, CIT citrinin, HSA human serum albumin 717
718