Review
Historical Evolution and Food Control Achievements of Near Infrared Spectroscopy, Electronic Nose,
and Electronic Tongue—Critical Overview
Balkis Aouadi1, John-Lewis Zinia Zaukuu1 , Flora Vitális1, Zsanett Bodor1 , Orsolya Fehér2, Zoltan Gillay1, George Bazar3,4 and Zoltan Kovacs1,*
1 Department of Measurement and Process Control, Faculty of Food Science, Szent István University, H-1118 Budapest, Hungary; aouadi.balkis@hallgato.uni-szie.hu (B.A.);
zaukuu.john-lewis.zinia@hallgato.uni-szie.hu (J.-L.Z.Z.); vitalis.flora@hallgato.uni-szie.hu (F.V.);
bodor.zsanett@hallgato.uni-szie.hu (Z.B.); gillay.zoltan@szie.hu (Z.G.)
2 Institute of Agribusiness, Faculty of Economics and Social Sciences, Szent István University, H-2100 Gödöll˝o, Hungary; feher.orsolya@szie.hu
3 Department of Nutritional Science and Production Technology, Faculty of Agricultural and Environmental Sciences, Szent István University, H-7400 Kaposvár, Hungary; bazar@agrilab.hu
4 ADEXGO Kft., H-8230 Balatonfüred, Hungary
* Correspondence: kovacs.zoltan.food@szie.hu
Received: 25 August 2020; Accepted: 21 September 2020; Published: 24 September 2020 Abstract:Amid today’s stringent regulations and rising consumer awareness, failing to meet quality standards often results in health and financial compromises. In the lookout for solutions, the food industry has seen a surge in high-performing systems all along the production chain. By virtue of their wide-range designs, speed, and real-time data processing, the electronic tongue (E-tongue), electronic nose (E-nose), and near infrared (NIR) spectroscopy have been at the forefront of quality control technologies. The instruments have been used to fingerprint food properties and to control food production from farm-to-fork. Coupled with advanced chemometric tools, these high-throughput yet cost-effective tools have shifted the focus away from lengthy and laborious conventional methods.
This special issue paper focuses on the historical overview of the instruments and their role in food quality measurements based on defined food matrices from the Codex General Standards.
The instruments have been used to detect, classify, and predict adulteration of dairy products, sweeteners, beverages, fruits and vegetables, meat, and fish products. Multiple physico-chemical and sensory parameters of these foods have also been predicted with the instruments in combination with chemometrics. Their inherent potential for speedy, affordable, and reliable measurements makes them a perfect choice for food control. The high sensitivity of the instruments can sometimes be generally challenging due to the influence of environmental conditions, but mathematical correction techniques exist to combat these challenges.
Keywords: sensors; food authenticity; food adulteration; chemometrics; fingerprinting
1. Introduction
According to the World Food Summit, “Food security exists when all people, at all times, have physical and economic access to sufficient, safe and nutritious food that meets their dietary needs and food preferences for an active and healthy life” [1]. Naturally, food is a global necessity generally consumed for pleasure, energy, health, or wellbeing but can, ironically, also infringe upon all these benefits or even present dire consequences when not in the appropriate quality. The 21st century has, however, been plagued by many food quality concerns ranging from malnutrition, food hazards, to food fraud. To mitigate the
Sensors2020,20, 5479; doi:10.3390/s20195479 www.mdpi.com/journal/sensors
consequences of these threats, many interventions have been introduced by diverse regulatory authorities such as the Food and Agricultural Organization (FAO), Codex Alimentarius, and the Foods and Drugs and Agency in numerous countries. Nonetheless, food hazards and food fraud continue to exist in the food industry due to many reasons, including urbanization and the complexity of the food chain system.
Food hazards refer to the intentional or unintentional existence of anything in food that can cause harm upon consumption and it cuts across physical, chemical, or microbiological hazards. Food fraud, on the other hand, is the intentional or deliberate attempt to trick consumers by mislabeling or with inferior alternatives of the food product. It is considered to be the second most significant black-market activity in the European Union after drug trafficking. However, the unprecedented rates of changing trends and heightened fraud claims sparked demand for swifter analytical tools. Many types of fraud have been reported for many foods ranging from powdered foods [2,3] to both nonalcoholic and alcoholic drinks [4]. Under its varying shapes and forms, the effects of fraudulent practices have been shown to expand beyond threatening human and animal health to undermining the global economy. For instance, an estimated $55 billion worth of food is counterfeited worldwide every year. In the United States alone, the damage caused by food counterfeiting equals 7% of the Gross Domestic Product (GDP) [5]. Adding to the economic and health burden of food fraud, losing the consumer’s trust is another major concern in the food industry.
These detrimental effects on the consumer’s trust have been equally corroborated by [6], who proved that both conscious consumers and those who have already encountered food counterfeiting expressed lower trust levels in the authorities or food companies. While the respondents’ gender and income level did not have any significant effect on how risks are perceived, the level of education has been a major determining factor. Thus, the higher one’s education, the more likely they were to consider imported foods to be risky due to food counterfeiting. These studies have also shown that informed and quality conscious consumers can assess more of those products coming from a reliable source and can even detect if the property of a given product differs from normally expected parameters. What these observations confirm is that having access to safe, credible, and traceable information regarding food production and distribution is in the common interest of all actors in the food economy.
In the fight against acts of counterfeiting, numerous domestic and international initiatives have been launched. Among many others, Operation OPSON, coordinated by EUROPOL and INTERPOL, involves 61 countries and focuses on counterfeit food and drink. As per the targeted products, they range from commonly consumed products such as olive oil, various beverages, and mineral waters to luxury goods such as caviar [7].
Besides these initiatives, mitigating food fraud and ensuring food quality called for the joint effort of food practitioners and academia. The latter adopted two approaches, one consists of deploying traditional analytical techniques, the other implements modern alternatives. In modern analytical techniques, a new trend is to use nondirect properties of the analyzed sample and use these properties in a correlative way to predict various quality attributes of the tested materials. Commonly used analytical methods successfully employing this approach in food quality determination are near-infrared (NIR) spectroscopy, electronic nose (E-nose), and electronic-tongue (E-tongue). In the following sections, a historical overview of these three rapid correlative analytical methods and their comparison to conventional ones will be elucidated. Furthermore, the major potentials and challenges encountered when applying these techniques in the food industry will be summarized.
2. Correlative vs. Conventional Analytical Methods in Food Quality Assessment
In the generally accepted food quality evaluation protocols and early responses to food counterfeiting, major assessments of fraudulently manipulated products have been largely based on standard methods. In fact, amid rising concerns on whether the labels reflect the true state of consumed products or not, these detection methods have been as diverse as the studied adulterants and their
targeted food matrices. Existing literature categorizes these methods into chromatographic, isotopic, enzymatic, spectroscopic, elemental, sensorial, and proteogenomic analysis, etc. [8,9].
Given their marked ability to detect specific components of interest and to provide reliable results, these laboratory methods remain, to date, routinely used for qualitative purposes.
However, amidst the rapidly growing complexity of the food chain, the daunting challenges of guaranteeing food safety are also being magnified by the over-reliance on conventional techniques.
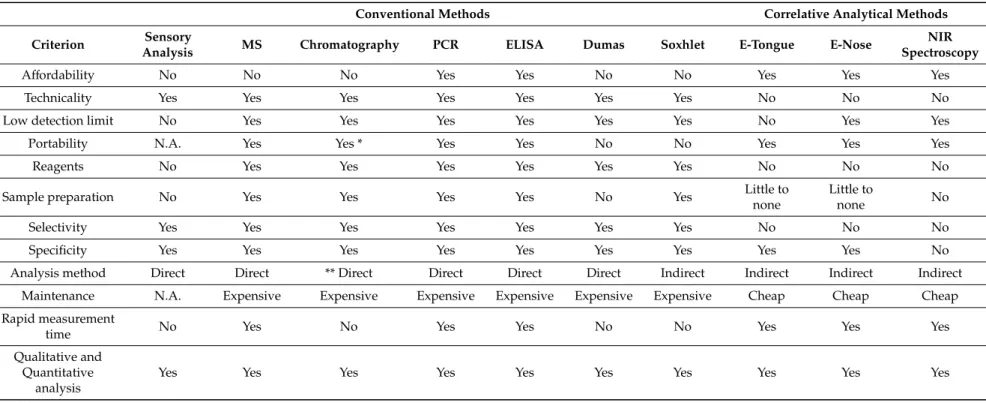
For the most part, some of these conventional techniques hinder the advancement necessary for keeping up with the sophisticated ways of adulterating food. In the case of conventional analytical methods, a priori knowledge is essential, since the target chemical or physical property has to be known to detect and measure it. Furthermore, conventional methods are dedicated to single properties, whereas, correlative techniques may be applied globally in a holistic approach, without knowing which parameter would change during a process but, allow the determination of several compounds and properties at once. Assuredly, up to recent days, the determinations of both the quality and potential adulteration of various food products have become so intricate that traditional tools are no longer able to keep track of them. With these underlying limitations, automating analysis is poised to play a crucial role in addressing the untapped aspects of food fraud tracking systems and in food quality characterization. By incorporating the correlative analytical techniques along with sophisticated mathematical evaluation methods, major impairments afflicting the results obtained by conventional techniques can no longer be overlooked and big data loads can be handled. Other requirements of highly qualified analysts and matrix specific reagents can also be dispensable [10]. Table1shows some of the main characteristic attributes of correlative analytical techniques, namely NIR spectroscopy, E-noses, and E-tongues in comparison to some of the conventional methods commonly used in food authentication.
Table 1.Comparison of correlative analytical methods (near infrared (NIR) spectroscopy, electronic nose (E-nose), electronic tongue (E-tongue)) to sensory analysis and major conventional analytical methods (MS: mass spectrometry; GC: gas chromatography; PCR: polymerase chain reaction; ELISA: enzyme-linked-immuno-sorbent-assay).
Self-developed concepts were adapted from Valle et al. [11], Bansal et al. [12], Huang et al. [13], Mæhre et al. [14].
Conventional Methods Correlative Analytical Methods
Criterion Sensory
Analysis MS Chromatography PCR ELISA Dumas Soxhlet E-Tongue E-Nose NIR
Spectroscopy
Affordability No No No Yes Yes No No Yes Yes Yes
Technicality Yes Yes Yes Yes Yes Yes Yes No No No
Low detection limit No Yes Yes Yes Yes Yes Yes No Yes Yes
Portability N.A. Yes Yes * Yes Yes No No Yes Yes Yes
Reagents No Yes Yes Yes Yes Yes Yes No No No
Sample preparation No Yes Yes Yes Yes No Yes Little to
none
Little to
none No
Selectivity Yes Yes Yes Yes Yes Yes Yes No No No
Specificity Yes Yes Yes Yes Yes Yes Yes Yes Yes No
Analysis method Direct Direct ** Direct Direct Direct Direct Indirect Indirect Indirect Indirect
Maintenance N.A. Expensive Expensive Expensive Expensive Expensive Expensive Cheap Cheap Cheap
Rapid measurement
time No Yes No Yes Yes No No Yes Yes Yes
Qualitative and Quantitative
analysis
Yes Yes Yes Yes Yes Yes Yes Yes Yes Yes
*: only for liquid and gas chromatography; **: when standards are used; N.A.: not applicable.
As presented in Table1, these rapid and correlative analytical methods offer a set of technical advantages that permit the analysis of more complex matrices with enhanced accuracies, at swifter response rates [10,15]. Owed to their minimal preparation requirements and advanced designs, their integration into routine applications can be translated into higher performances. Nevertheless, to extend their application to wider scopes, a prerequisite knowledge of their limitations is also recommended.
In this regard, even minute compositional differences of the studied products can cause interferences within the responses of the array of E-tongue and E-nose sensors [16]. Other reported disadvantages include the fluctuation of the sensor’s sensitivity due to external factors such as temperature and other environmental conditions, or surface defects emanating from cross-contamination. The sensor drift, engendered by such factors, has been a subject of a wide number of studies. With varying outcomes, the proposed solutions ranged from maintaining the cleanliness of the sensor membranes [17] to performing systematic calibrations and other mathematical corrections [18]. Analysis with NIR spectroscopy, on the other hand, can be dependent on reference methods, for calibration and validation purposes [19]. From an analytical standpoint, the quality of the obtained results is dictated by the variability induced by environmental conditions and the efficiency of compensating their resulting errors. The complexity of NIR spectra is another inevitable challenge [20] that demands a mastering of chemometric tools to understand any correlative relation between the generated spectra and the peculiarities of the studied samples.
Throughout the following sections, prominent data analysis tools and applications of NIR spectroscopy, E-nose, and E-tongue in the domain of food quality assessment are discussed based on commonly consumed food matrices defined by the Codex General Standard for Food Additives [21]
(Figure1).
Figure 1. Correlative analytical methods used as food quality control devices, their applications, and some of the commonly consumed food matrices defined by the Codex General Standard for Food Additives [21].
Data Analysis
Extracting valuable information related to chemical compositions from the data generated by correlative analytical methods, such as NIR spectroscopy, E-nose, and E-tongue, demands a set of special mathematical tools called chemometrics. In a definition by [22], “Chemometrics utilizes mathematical and
statistical modelling to recognize patterns and relationships within highly complex data and translates them into useable analytical parameters.” Therefore, chemometrics is inherently an interdisciplinary science, using mainly mathematical methods such as multivariate statistics (e.g., pattern recognition or fingerprinting), in combination with a priori knowledge of chemical, physical, or organoleptic properties.
These tools are used for explorative analysis, classification, and predicting qualitative information [23].
The use of the mathematical statistics is often never devoid of the reference knowledge to understand the real behavior of correlative techniques for specific features of food products [24]. The mathematical tools range from classical to emerging, from linear to nonlinear, from transparent to “black box” type, from supervised to nonsupervised.
Essentially, what differentiates supervised techniques from nonsupervised ones is the reliance on predetermined dependent variables for the prediction of independent variables. The yielded model is subsequently used to categorize newer unlabeled samples. Unsupervised exploratory methods, on the other hand, recognize patterns among the different features or samples and create clusters without demanding dependent variables for modelling purposes [25,26].
Since the appearance of the correlative analytical methods, they have been capable of producing highly multidimensional and multicollinear data in conjunction with chemometrics [27]. This was mainly catalyzed by the immense progression of computer technology. In this regard, the principal component analysis (PCA) was the most basic qualitative explorative analysis. However, others such as discriminant analysis (DA), soft independent modelling of class analogies (SIMCA), one class classifier (OCC), partial least squares-discriminant analysis (PLS-DA), and k-nearest neighbors algorithm (KNN) have also evolved. Multiple linear regression (MLR), stepwise MLR, principal component regression (PCR), and partial least squares (PLS) regression have also been used for quantitative purposes.
More sophisticated pattern recognition algorithms such as support vector machine (SVM), and the biologically inspired artificial neural network (ANN) and fuzzy logic are currently on the rise [28–31].
For many years, the professional explanations of a calibration on compositional variables arrived with chemical interpretations, with detailed chemometrics analysis. Nowadays it is more and more common that reliable validations of a model of any kind means more for the users than interpretive modelling. In this sense, the “black box”-type nonchemometric multivariate data analytical techniques could be explored but with caution. Artificial neural network (ANN) is one of the most emerging and promising techniques. The parameters of classification and prediction cannot be interpreted with the sensor signals, making it difficult to understand the underlying relationships [32]. Thus, ANN is a typical example of a “black-box” solution, and it might be useful when the “why?” is not important, but only the output is. It is preferably used when the database represents complex and nonlinear relationship between the measured parameters and the features to be predicted and its effectiveness is undeniable. ANN has also been acknowledged for the ability to deliver an output even when incomplete information was used during training. However, the reliability of its performance heavily depends on how important the missing values are [33] and because of its nonlinearity the prediction can be extraneously false for samples with a somehow unique measurement response.
Besides these statistical techniques, the data provided by any of the discussed correlative analytical methods require special pretreatments based on their unique behavior, data structure, and issues of sensitivity that can result from numerous environmental conditions. In this regard, noise reduction algorithms [34], drift corrections [18], normalizations, sensor/spectra selection, and data dimension reduction can be applied before using it to build multivariate models for qualitative and quantitative evaluations [35].
NIR spectroscopy, described in the next section, has the longest history with chemometrics [36] and has very simple principles and solutions which can be transferred to deal with challenges of electronic nose and tongue. Some books [37] and articles [31] have described these methods in deep detail [38] or from the practical perspective [39]. However, there is still a gap between mathematical-statistical sciences and the other, more experiential sciences, so a more interdisciplinary approach and collaboration may be necessary for the future [24].
3. Near Infrared (NIR) Spectroscopy: Historical Background and Food Quality Assessment Herschel’s discovery of the near infrared energy back in 1800 marked the beginning of a novel era of experimentation, without which, elucidating basic phenomena would not be possible [40].
This conceptual knowledge later translated into industrial applications that were first initiated by Karl Norris in agriculture-related applications. In his pioneering study, near infrared (NIR) spectroscopy enabled the analysis of agricultural commodities, namely by determining the protein content of wheat [41].
Covering the range 780–2500 nm of the electromagnetic (EM) spectrum, NIR spectroscopy captures samples’ spectra in reflection, interactance, and transmission modes, thus providing rich information regarding the vibration of their elemental molecular bonds [42]. Upon interacting with the EM radiation, the captured spectra comprise both overtones and combination bands involving mainly hydrogen-bonded functional groups (–CH, –NH, –OH –SH). Such broad bands are highly informative and demand chemometric tools to disclose the correlation between spectral information and the structural features of the samples [43].
A possible historical overview of the evolution of near infrared spectrometers with the main milestones is illustrated in Figure2.
Figure 2. Overview of the evolution of near infrared spectrometers. Reproduced with permission from K H Norris [41] published by Journal of Near Infrared Spectroscopy (2020)1, K H Norris (2008)2,3 Technicon Instruments Corporation [44] published by Analytical Chemistry (2020)4, and J Malinen [45]
published by Sensors and Actuators B (2020)5. The rest of the figures are self-developed based on authors’ own pictures.
The first scanning spectrometers that employed NIR light were equipped with prism-grating monochromators, covering the UV-VIS-NIR range from 185 to 870 nm. Though, for many years during the renaissance of NIR spectroscopy, interference filter instruments were the most used. Still, in the late 1990s, 85% of instruments used for routine monitoring were estimated to be filter instruments [36].
The great advancements of the 1990s in electronics, including detectors and computer technology, resulted in the rise of the rapid scanning grating monochromators, which became the ultimate choice for both research and applications.
As a result of the upsurge of Raman spectroscopy, the development of FT-NIR (Fourier transform NIR) instrumentation came about in the 1990s [36]. First, traditional mid-IR spectroscopic companies provided conversions of their classical mid-IR instruments, but later launched the production of NIR dedicated FT instruments. These developments met a silent but significant market need coming from analytical chemists who were more familiar with FT-IR instrumentation used in the analytical IR, thus, were more apt to open to the new field of NIR spectroscopy—combined with often demonized multivariate data analysis—when at least the instrumentation was known. In the early 2000s, the agri-food sector was dominated by benchtop grating spectrometers, while FT-NIR spectrometers started to spread in pharmaceutical applications, where their narrow bandpass meant an advantage, even with the compromise of a lower signal-to-noise ratio. After several market changes and instrument developments, the above-mentioned barriers are rarely present, and both types of devices can be found in both fields, agri-food or pharma.
Regarding the detectors, silicon (Si) is still widely used for short-wave NIR (780–1100 nm), and lead sulphide (PbS) has been changed to indium gallium arsenide (InGaAs) that is less sensitive to temperature when used in the 800–1700 nm range, allowing cost-effective applications. The addition of optical fibers to the spectrometers allows collecting spectral information among conditions that are ineligible for highly precise and sensitive instruments.
The versatility in the design of NIR spectrometers has been further extended through gradual improvements aimed at enhancing the functionality of NIR spectroscopy resulting in a plethora of instruments [20]. The most recent and most significant achievement of NIR spectroscopy was the miniaturization, which undoubtedly resulted in the disentanglement of the technology [46].
The palm-sized or even smaller devices, containing e.g., linear variable filter with photodiode detector array, acousto-optic tunable filter, or micro-electro-mechanical systems with single photodiode detector, combined with advanced data transfer technologies, have opened new fields for applications, both in terms of handheld end-user devices and process analytical tools [47]. It became quite normal to be able to purchase a NIR scanner for personal use, and it is common to include a NIR device in an industrial process where quality has to be monitored or optimized. We are now in the era of ex-laboratory applications of NIR spectroscopy.
Multivariate data analysis of NIR spectroscopy has also undergone huge developments [48], sometimes in combination with the hardware. Karl Norris used scanning devices at USDA that allowed the spectroscopic inspection of the spectral data, instead of the purely statistical approaches that could be used by those having access to filter devices measuring at some discrete wavelengths.
Having this advantage, Norris developed his derivative calculation method for data treatment in combination with a parsimonious interactive multiple regression based on sums and ratios of different wavelength channels. This was, particularly, to decrease additive and multiplicative effects caused by light scattering and path length variations [49]. Since derivative was not applicable for discrete spectral values of an instrument having 19 fixed wavelength filters, Harald Martens had to develop another correction method to overcome the burden of light scattering [50]. This is why nowadays we can use multiplicative scatter correction (MSC) in our calculations [51]. The regression methods started from multiple linear regression, when some discrete values were applied, and later, when scanning spectrometers generated a large amount of data, data reduction techniques became necessary.
Principal component analysis turned to be the ultimate method to describe multidimensional variation and patterns, and to reduce the number of variables [52]. The most used quantitative linear calibration
method is the partial least squares (PLS) regression [53]. With the decreased limitations in scanning speed, it became easy to collect thousands of spectra and create a large training database, which allows using other methods such as artificial neural network (ANN) or support vector machine (SVM).
The SVM may be a better option when working with high dimensions but is very sensitive to outliers and noisy data and sometimes underperforms when large datasets are involved [31]. ANN has also been acknowledged for the ability to deliver an output even when incomplete information was used during training.
Just as on the side of spectrometers, users now have a vast variety of software and multivariate data analytical tools, starting from spectral pretreatments, through simplified data analysis, to detailed chemometrics when spectral information is translated to real analytical information.
Push-button applications where an end-user can get feedback easily and rapidly are also continuing to evolve. With the progress in spectroscopic and IT hardware, tiny devices can do the scanning and hidden computers can deliver the results in any form within a blink of an eye. The only question remains:
is that result good enough? Care must be exercised because in many cases little spectroscopic and sample handling knowledge is still necessary to avoid false assumptions. Nonetheless, the analytical advantages of NIR spectroscopy have been widely explored in the food industry.
3.1. Dairy Products
In inspecting the quality of dairy products, NIR spectroscopy was used in a wide spectrum of analysis. Research efforts were centered around monitoring the production of feta and Grana Padano cheeses and showed that using a discrete filter-based NIR analyzer, NIR could give a precise and direct representation of both production processes [54,55]. In another study, a scanning monochromator (SMC) with a fiber-optic probe was used to classify cheeses from different milk mixtures of cow, ewe, and goat milk, and their ripening time. When using the scores of the PCA for the artificial neural network model, a 100% accuracy was obtained for the classification of the ripening of the cheese samples. The classification according to the milk mixtures, however, was not as efficient with only 50%
accuracy [56].
NIR light backscatter using a fiber optic sensor was also applied to monitor the incubation of the yoghurt. The results of the study highlighted the correlation between the changes of the spectra and pH of the samples (R2>0.99), indicating the adequacy of NIR as an alternative tool to pH meters during yoghurt incubation [57].
Application of NIR spectroscopy for detecting adulteration of different dairy products is also an immensely studied field. A study by Kamboj et al. [58] deployed an SMC spectrometer in the wavelength range of 700–2500 in reflectance mode to quantify added water in milk. Their results showed R2values higher than 0.9 for the prediction of adulteration level.
Another reported application consisted of analyzing grated cheese adulterated with microcellulose, silicon-dioxide, wheat flour, wheat semolina, and sawdust using FT-IR with NIR module. The results showed that NIR was able to discriminate adulterated samples from nonadulterated ones with a classification accuracy of the PLS-DA models that is higher than 90% [59].
3.2. Sweeteners Including Honey
Authenticating organic sugars from those originating from other conventional sources is another major field of application of NIR spectroscopy.
Bázár et al. applied a benchtop NIR spectrometer with SMC, coupled to aquaphotomics for the classification and prediction of sugars in low concentration glucose, fructose, and lactose solutions obtaining R2in the range of 0.7–0.99 depending on the wavelength range and sugar type [60].
Tahir et al. used the fusion of NIR and Raman-spectroscopy for the prediction of p-hydroxybenzoic acid (PHBA) content of honey and found strong correlation between the fused data and the PHBS content [61].
A handheld spectrometer with linear variable filter was used in diffuse reflectance mode in the wavelength range of 900–1650 nm, for the discrimination of crystal, demerara, and brown sugars with PLS-DA resulting in R2<0.99 [62].
Hungarian researchers analyzed linden, acacia, chestnut, and multifloral honeys and their mixtures using a benchtop NIR spectrometer and found average recognition and prediction abilities of 95.95%
and 92.61%, respectively, using LDA for the botanical origin classification. For the geographical origin identification, 99.13% and 95.65% LDA accuracies were found [63].
Italian researchers also analyzed honey samples and built models using NIR-Flex 500 spectrometer and Raman spectroscopy for the botanical origin identification and revealed an accuracy amounting to 79% in the case of the NIR measurement [64].
An FT-NIR spectrophotometer was applied for the detection of adulteration in honey using glucose/fructose solutions and revealed the efficiency of NIR in the differentiation of authentic and adulterated samples with 95% recognition accuracy [65].
Bázár et al. [66] analyzed honey adulteration with HFCS syrups using benchtop SMC spectrometer and the aquaphotomics aspect of NIR and revealed the changes in the honey water structure as an effect of syrup addition. In this regard, the addition of syrup resulted in higher absorbance in the range of less H-bonded water (1320–1420 nm).
Similar results were obtained in another study using rice syrup as an adulterant of linden honey using benchtop double beam SMC instrument [67].
In a study of honey adulteration, authentic samples counterfeited with rice, beet, and corn, maltose, and high-fructose corn syrup and sucrose syrup in the range of 10–60% were analyzed with a SMC spectrometer and rapid content analyzer module for reflectance measurements, and with an ATR-FTIR spectrometer. The fusion of the two methods provided better accuracies (>90%) than those obtained using the two methods separately [68].
Benchtop SMC NIR spectrometer was also proven efficient when other adulterants comprising rice, brown cane, invert sugar, and fructose syrup in a concentration range of 5–40% were artificially added to honey and subjected to spectroscopic analysis. This study revealed correct classification of the samples with R2values higher than 0.98 for the prediction of the syrup concentration [69].
Italian researchers applied a low level of heat treatment (39◦C for 30 min) and overheating (55◦C for 24 h) on three types of honey. After recording their NIR spectra using a benchtop SMC instrument, the results showed distinctive characteristics of the three types of honey in terms of their respective spectral pattern, however, the low level heat treatment did not affect the spectra of the samples [70].
Similar results were obtained in other studies using handheld instruments in the spectral range of 900–1700, where heat treatment of the samples (especially above 50◦C) affected the spectra of the samples and contributed to the determination of this rather widely spread kind of fraud [71,72].
3.3. Beverages
Beverages cover a very wide range of drinks providing a huge potential for the applications of NIR spectroscopy in the characterization of their quality from the most various aspects.
• Coffee
From determining coffee origin to evaluating the quality attributes, resorting to NIR spectroscopy has been extensively reported in the literature. Marquetti et al. [73], for instance, deployed a benchtop NIR spectrometer and recorded the spectra of coffee samples to assess their genotypic and geographical origin. After multiplicative scatter correction and 2nd derivative, the results of the PLS-DA enabled the correct discrimination of the geographical origin of the samples with 94.4% accuracy. In another study, diffuse reflectance spectra of different green coffee samples were analyzed using a benchtop NIR instrument and helped to predict the sensory properties (acidity, bitterness, flavor, cleanliness, body, and overall quality) of the samples with R2coefficients exceeding 0.84 [74]. Other studies were aimed at screening the characteristics of coffee such as measuring the color and Arabica content using FT-NIR
spectroscopy with R2>0.9 [75,76] as well as classifying Robusta and Arabica coffee samples according to the quality of the cup with the help of ATR-FTIR instrument. What these results have shown is that NIR spectroscopy could be used efficiently for the quality control of coffee.
• Tea
Instant green teas were analyzed using benchtop and portable NIR devices, the results showed that these instruments could be used to determine the main quality components of tea. The results comparing the benchtop and portable device showed, in the case of the prediction of total catechin, that the portable device provided higher R2values and lower prediction error, while in the case of the caffeine better results were obtained using the benchtop instrument [77]. Matcha tea, another trending product, was also analyzed with portable NIR instruments and satisfactory results were obtained for the estimation of the polyphenol and amino acid content of the tea samples after choosing the most accurate pretreatment methods. The best results consisted of R2of 0.86 for the prediction of polyphenols and 0.96 for the determination of amino acids [78].
• Fruit juices
Citric and tartaric acids were assessed and predicted with good precision (R2>0.98) and low errors (RMSECV<0.62) when a handheld SMC spectrometer in reflectance mode was used [79].
This substantiates the importance of NIR spectroscopy for rapid monitoring of additives and preservatives in fruit juices when either transmittance, reflectance, or diffuse-reflectance mode is used.
In combination with standard analytical techniques, both a benchtop and handheld SMC NIR in reflectance mode could discriminate different varieties of green and orange fleshed melons with 100%
classification accuracy in LDA and predict multiple sensory parameters in PLS regression with high precision (R2up to 0.96) and low errors (RMSECV as low as 0.24 g/mL) after cross-validation [80].
Transmittance mode benchtop FT-NIR provided high R2in cross-validation (up to 0.94) and low errors (RMSECV as low as 5.07 mg nitrogen/L) when it was used to measure total yeast assimilable nitrogen, free amino nitrogen, and ammonia in 900 grape juice samples from 28 cultivars over three seasons [81].
This suggests that NIR can provide juice makers with the opportunity to make timelier and more informed nutrient supplementation decisions to achieve the desired juice style or quality.
• Soft drinks
Glucose, fructose, and sucrose contents of commercial soft drinks could also be rapidly predicted with precision (R2CV) higher than 0.91 and errors lower than 1.0 g/mL [82] when reflectance spectra from a benchtop SMC spectrometer were analyzed. This suggests a rapid approach for sugar content determination in soft drinks.
Reflectance NIR spectra from a handheld SMC instrument were used to fingerprint soluble solids contents of tea soft drink with a cross-validation R2as high as 0.98 [83].
Furthermore, NIR proved to be a viable option in monitoring caffeine levels in soft drinks when more than 100 soft drinks were accurately classified and predicted with a benchtop FT-NIR spectrometer in transmission mode [84].
Ascorbic acid content of powdered soft drinks was determined and predicted with high accuracies after reflectance measurement with a benchtop FT-NIR [85]. This is particularly important because powdered soft drinks are often fortified with antioxidants such as ascorbic acid and, therefore, normally controlled by titration or chromatographic methods which can be both expensive and time-consuming.
• Mineral water
Three types of commercial mineral water, ultra-pure water, and deionized water were successfully discriminated with a benchtop SMC spectrometer in transflectance mode. It was revealed that the original spectra of water were more suitable than the second derivative spectra in discriminating the
different waters with more 95% variance in PCA [86]. This emphasizes the importance of NIR spectra pretreatment techniques in optimizing results.
Aquaphotomics operates on the principle of using water as a holistic marker to extract information about many different water molecular conformations and their interaction with surrounding solutes through their absorbance bands and a light–water phenomenon [87]. Using NIR spectroscopy in combination with the aquaphotomics approach, seven commercial mineral waters and tap water were discriminated based on spectra variations using a mini SMC spectrometer in transmission mode [88].
This approach has been used in other studies regarding water such as the monitoring of water quality where aqueous solutions of acetic acid, lactose, and sodium chloride could be characterized by specific wavebands [89], using a benchtop SMC spectrometer.
3.4. Meat
NIR spectroscopy has unlimited potential for meat quality assessment because of its noninvasive analytical advantages.
Among many others it has been shown that NIR spectroscopy can rapidly detect freshness associated compounds in oxen [90], total viable count in pork [91,92], and bos grunniens meat [93].
Using a benchtop SMC spectrometer protein and intramolecular fat content of rabbit hind meat was determined with an R2of 0.89 and 0.85, respectively, for fresh samples. Freeze-dried samples showed better accuracies with R2of 0.99 (for fat) and 0.95 (for protein) [94].
A benchtop SMC spectrometer was used to predict meat chemical and fatty acid (FA) composition from 63 steers fed with sunflower or flaxseed in combination with high forage diets. Crude protein, moisture, fat content, saturated, monounsaturated, and branched FA and conjugated linoleic acid content were predicted with high precision (R2as high as 0.97) and accuracy (RMSEC lower than 0.98 mg/g) [95]. These findings show the suitability of NIR spectroscopy for screening meat and meat-based products based on the content of beneficial FAs to human health.
Good calibrations were built for the total lipid content of beef resulting an R2of 0.95 and SECV of 0.25 in cross-validation, when a SMC benchtop spectrometer was used [96].
For quality parameters determination purposes, NIR spectroscopy could predict sodium content in commercially processed meat [97] and in vacuum dried ham slices [98]. Other parameters such as ash and dry matter in freeze-dried ostrich meat were also studied [99].
Drip loss, color, and pH of 131 commercial pork loins were also predicted with high accuracies when NIR spectroscopy was used by Kapper et al. [100]. Similar studies also reported a good classification accuracy for pork tenderness (72%) and juiciness (73%) when a spectrometer with a bifurcated optical cable that resulted in a single reading from 400 to 1395 nm was used [101].
For food authentication, a benchtop SMC NIR spectrometer could detect the adulteration of minced beef with turkey meat (R2CV>0.93) [102], minced lamb meat with pork [103], minced llama meat with horse meat (R2CV>0.99) [104], vegetable protein, and soy flour in minced pork and beef (R2>0.78) [105].
Portable NIR spectrometers have been used for cost-saving but also for reliable monitoring of ham [98], beef [106,107], and routine analysis of Iberian pork [108]. Monounsaturated fatty acids, oleic acid, and saturated fatty acids could be predicted in wagyu beef carcass with R2of 0.79, 0.71, 0.81, respectively, when a handheld fiber optic spectrometer was used [108].
3.5. Fish
Although there are not many studies about NIR spectroscopy applications in fish, the noninvasive advantages of NIR spectroscopy have been explored by some researchers for fish quality and the number of publications has increased in this field as well.
It is often difficult to differentiate between fresh and frozen/thawed fillets because fillets frozen below−60◦C do not show visual characteristics changes when thawed. In this regard, the classification of fresh and frozen fillet performed with a benchtop SMC spectrometer resulted in a high classification
accuracy of 92% [109]. The outcome of this study is essential because fresh tuna is more expensive than thawed tuna, and it is important to prevent certain cases where frozen/thawed products are sold as fresh to deceive the consumer.
The pH, total volatile basic nitrogen (TVB-N), thiobarbituric acid reactive substances (TBARS), and ATP-related compounds (K value) of the bighead carp (Aristichthys nobilis) were predicted with high precision (R2higher the 0.81) and low errors (RMSEP as low as 0.081) when a benchtop FT-NIR was used [110]. The study provides an alternative rapid approach for the determination of fish freshness.
For the analysis of sensory qualities, six textural properties (water holding capacity, hardness, resilience, springiness, chewiness, and shear force) of the silver carp fish (Hypophthalmichthys molitrix) were determined with NIR spectroscopy and predicted with high R2(greater than 0.86 for all the parameters) and low error (RMSEP as low as 0.10) [110]. The determined sensory qualities are relevant in making consumer choices for fish consumption.
Another way of deceiving the consumer is done through the substitution of fish species. This was also investigated when a benchtop FT-NIR instrument was used for the authentication of Atlantic mullet and flounder fish fillets species with a 100% classification yield [111].
Handheld NIR devices have also successfully been used to distinguish fillets and patties of Atlantic cod with 100% correct classification in LDA [112].
3.6. Fats and Oils
Many varieties of vegetable oils, peanut oil, bean oil, rapeseed oil, sesame oil, oil-tea camellia seed oil, and olive oil, were investigated in the temperature range of 50–160◦C with two-dimensional correlation near-infrared spectroscopy (2D-NIR). In the 1666–1818 nm wavelength region, due to the elevating temperature, clear differences were observable in the 2D-NIR spectroscopy map. Thereby, the different oils could be distinguished directly by auto peaks and cross peaks [113].
Several other studies dealt with the detection of adulteration in diesel/biodiesel blends with vegetable oil. Back in 2015, one study using ultra-compact and FT-NIR spectrometers found that multiple linear regression (MLR) combined with successive projections algorithm (SPA) was the best modelling strategy. RMSEP values were 0.34% and 0.22%, and the limits of detection values (LOD) were 0.40% and 0.34%, for the ultra-compact and FT-NIR, respectively [114].
Casale and Simonetti (2014) comprehensively summarized the most important findings about NIR spectroscopy in the evaluation of olive oils. According to the review, NIR studies are primarily applied for adulteration detection, geographical origin prediction, quality parameter determination (including oxidative stability), and online process monitoring [115]. In a 2004 study, transmittance spectra of olive oil mixtures were analyzed in the 833–2500 nm range using a FT-NIR spectrometer to classify and quantify various adulterants. After multiplicative scatter correction (MSC), Savitzky–Golay smoothing, and mean normalization, the PLS models predicted corn, sunflower, soya, walnut, and hazelnut oil adulteration with R2higher than 0.99 and error limits between±0.57 and±1.32%w/w. Additionally, the developed PCA models classified an unknown sample with an accuracy of nearly 100% [116].
Another study on olive oil counterfeiting, applying FT-NIR in the 1000–2500 nm range, revealed that the standard error of predictions ranged between 2.49 and 2.88%V/Vfor the olive-sunflower oil binary mixture, and 1.42–6.38%V/Vfor the ternary mixtures of olive–sunflower–corn oil. The R2 values of models estimating olive oil content were typically more than 0.99 [117].
To ensure the quality of fried foods, it is important to know how frying time and temperature affect physicochemical properties of the oils. Szabóet al. [118] measured conventional fat quality indices during prolonged heating of lard, and performed NIR-based calibrations using transflectance spectra recorded with a SMC spectrometer. Based on the cross-validation results, NIR spectroscopy was shown to be a rapid, solvent-free alternative for the estimation of acid value (AV) (R2=0.79) andp-anisidine value (pAV) (R2=0.77). In another study, Szabóet al. [119] introduced NIR spectroscopy models for predicting the deterioration level of four frying fats, such as rapeseed oil, sunflower oil, lard, and goose fat.
Cross-validation precision for the amount of heat treatment (heating hours×temperature) exceeded 0.9,
while calibrations for AV, PV, pAV, and total polar material (TPM) reached R2over 0.8. Szabóet al. [120]
combined NIR spectroscopy with a highly effective data reduction method, the polar qualification system, and developed models for identifying frying fat types, and for monitoring the quality changes of frying fats during long term usage. A Turkish study aimed to predict free fatty acid (FFA), TPM, viscosity, and smoke point of frying oils (refined hazelnut and peanut oils) by an FT-NIR spectrometer (780–2500 nm) and PLS regression after 5–35 h of dough frying. The results showed good correlation with the reference data. The r values of the standard quality parameters in the above listed order were 92.58, 94.61, 81.95, and 84.07, and the RMSEP values were 0.121, 3.96, 22.30, and 8.74, respectively (Ö˘gütcü et al. 2012).
Similar research was conducted on olive, sunflower, corn, and seeds oil after several hours of heating with and without foodstuff. In the measurements, a multipurpose analyzer FT-NIR spectrometer was utilized and the transmission spectra were recorded in the 666–2631 nm spectral range. Using a global model built on the spectra of all types of oils, the prediction of polymerized triglyceride content (PTG) was made with 2.28%w/werror [121].
Studies on canola oil have also shown that prolonged frying can be accurately identified with FT-NIR technique in the 1000–2500 nm wavelength range. The research used acid, peroxide, and carbonyl values as reference, then K-means, PAM, and hierarchical cluster analysis were performed to classify samples into harmful and less harmful categories [122].
Together, the above summarized studies corroborate the suitability of NIR spectroscopy in determining fat and oil authenticity by measuring quality parameters with high accuracy.
Furthermore, NIR spectroscopy proved to be an effective method for determining the level of degradation in frying oils.
3.7. Fruits and Vegetables
According to the summary of Cattaneo and Stellari (2019), among horticultural products, apples are most often tested with NIR spectroscopy [123]. Certain apple varieties are prone to internal diffuse browning. To detect this defect, beside some destructive methods, visible-shortwave NIR spectroscopy was used with different optical geometries. In the analysis, a handheld device using interactance mode (302–1150 nm), an “in-house” instrument employing partial transmission (302–1150 nm), and full transmission (600–973 nm) were used. The best results were obtained with the transmission arrangement, where R2 and RMSEP values of 0.83 and 0.63, were achieved, respectively, when predicting the defect score on a 5-point scale. Among the classification methods (PLS-DA, LDA, MD, SVM, SIMCA, MLoR), the best separation of acceptable fruits was determined with PLS-DA, classification accuracy higher than 95% and false discovery rate less than 2% were attained [124].
The FT-NIR spectroscopy in diffuse reflectance mode (1000–2500 nm range) proved to be successful when “Golden Delicious” apples from different altitudes and various apple cultivars were classified with PCA and quadratic discriminant analysis (QDA). Independent model validation resulted in a correct classifications rate of 87.5% and 86.3% for orchard elevation and for cultivar, respectively [125].
Other researchers also used the aforementioned methodology aiming to evaluate the long-term performance of calibration model for SSC prediction using the slope/bias (S/B) correction method on
“Fuji” apples harvested between 2012 and 2018. The PLS model validations with five independent sets were realized in the 0.501–0.654% RMSEP range. The 15 selected wavelengths coupled with S/B correction could replace the whole analyzed spectra [126].
To investigate the feasibility of NIR spectroscopy in vegetable authentication, outdoor and greenhouse-grown bell peppers of different ripeness (green, red, yellow) were collected and analyzed in the 1600–2400 nm spectral range using a handheld microelectromechanical system-based device (reflectance mode) coupled with PLS-DA. The predictive models accurately discriminated the samples based on the cultivation conditions, where 89.73% and 88% correct classifications were obtained when unbalanced and balanced sets were used for model building. Classification accuracy between 88.28% and 91.37% was achieved when grouping was done according to ripeness. The dry matter and SSC predictions were realized with R2values of 0.62, 0.63 and SECV between 0.66% and 0.75%,
respectively [127]. A study by the same authors confirmed that NIR spectroscopy in static measuring position allows assessing some quality traits of freshly harvested Lamuyo peppers, such as color index (a*/b*), dry matter, SSC, and TA. The regression coefficients indicated 980 (water absorption), 1170–1360 nm (2nd overtone of C-H stretching) wavelengths important for parameter prediction [128].
Sweet corn is one of the most processed vegetables, the consumer acceptance of which is mostly determined by its sweet taste, which is given by the sugar content and composition. The soluble solid content of intact super sweet corn kernels was predicted using a SMC NIR reflectance analyzer in the 860–2500 nm range and synergy interval PLS (SI-PLS) after the best spectral pretreatment was selected.
The best prediction was obtained when the 1349−1513, 1842−2005, 2005−2168, and 2337−2500 nm wavelength ranges were applied. To improve the predictive accuracy, the authors performed (CARS)-Si-PLS, hence the RMSEP amounted to 5.8292 mg/g and the correlation coefficient of the prediction set was equal to 0.8431 [129].
The NIR spectroscopy is widely and effectively used for testing horticultural products, both for quality property determination and authentication purposes. The estimation accuracy of the individual characteristics depends largely on what we would like to evaluate. The success of the investigation is dictated by the subject of the analysis, e.g., what physical properties a component has, in other words, what optical behavior or what sort of absorption it has in the NIR range.
4. Electronic Nose: Historical Background and Food Quality Assessment
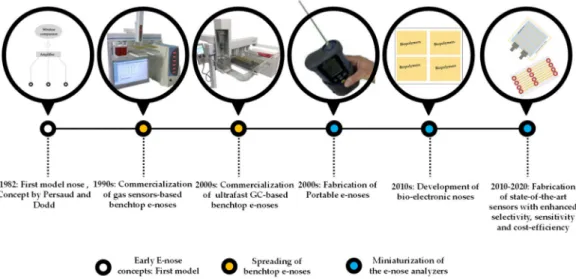
Conceptualized by Persaud and Dodd [130] back in 1982, the E-nose has been defined as “an instrument, which comprises an array of electronic chemical sensors with partial specificity and an appropriate pattern-recognition system, capable of recognizing simple or complex odors” [131].
The multisensor technology started, however, 20 years earlier, in the 1960s, when the very first mechanical instruments were engineered to serve as simulators of the human olfactory abilities [132].
Ever since, the E-nose has undergone numerous conceptual changes. A historical overview of the evolution of the electronic nose with some of the main milestones has been presented in Figure3, starting with the commercialization of the benchtop E-noses in the 1990s and followed by the fabrication of portable E-noses in the 2000s [133]. From the year 2010 till present (2020), novel sensors with advanced efficacies have been developed with innovative nanoparticle materials with increased and improved sensitivities and selectivity [134].
Figure 3.Overview of the evolution of the electronic nose. Self-developed figures based on authors’
own pictures.
Principally, E-noses operate by converting existing volatiles of the studied matrices into electronic signals from the sensor array. The resultant digital output is then subjected to a data processing unit to extract the corresponding pattern.
Today, prompted by the need to analyze matrices of higher complexity, optimization efforts are still been targeted mainly at diversifying the types of sensors, the operating mechanisms, as well as the mastering of data mining and pattern recognition algorithms. This has led to a variety of instruments with numerous applications in the food industry [23].
Being a core constituent of the E-nose and a determinant of its efficiency, the sensors have dictated the type of instrument used. In this regard, those based on metal-oxide-semiconductor sensors (MOS), metal-oxide-semiconductor field-effect transistor sensors (MOSFET), mass-sensitive sensors, conducting organic polymers (CP), solid electrolyte sensors (SES), and fiber optic sensors have been the most predominant ones [29]. Acoustic wave chemical vapor sensors, existing ever since 1979 are also prominently used sensors. Based either on bulk acoustic wave or on surface acoustic waves, both of these techniques use the ultrasonic frequencies mainly from 1 to 500 MHz [135].
Whilst MOS operation is modulated by the change in conductivity caused by reactions of surrounding volatiles to adsorbed oxygen, the mechanism by which MOSFETs function is based on variations of the electrostatic potential [136]. Piezoelectric sensors, on the other hand, perform as a result of changes in the resonance frequency [137].
In designing such devices, basic criteria had to be fulfilled such as high sensitivity to chemicals of interest, cross-selectivity, stability, reliability, reproducibility, not to mention the robustness of the calibration models. Literature has shown, however, that each of these instruments has its corresponding assets and limitations. The most notable ones being the high temperature tolerance and low sensitivity to moisture of MOS sensors which renders them less prone to drift [137]. These oxide sensors, nevertheless, present a lower selectivity and a greater risk of poisoning by some weak acids. MOSFET sensors, although partly influenced by the temperature, have been touted to be highly robust [138]. The marked selectivity of piezoelectric sensors, on the other hand, is counterbalanced by their high sensitivity to fluctuating operational conditions (T◦and humidity) whereas CP sensors, despite their good sensitivity and resistance to the poisoning effect, can have a considerably low reproducibility [139].
To overcome such shortcomings, some of the earliest suggestions were proposed by [140] who advised the applicability of the E-nose in controlled conditions for a thorough and accurate evaluation of the generated data. Others opted for using hybrid systems that incorporate the distinctive features of different sensor types [35]. Other researchers integrated the E-nose to gas chromatography for better performances [141]. Son et al. resorted to bio-electronic noses for a more rapid recognition of target components [142]. An equally promising option was explored by [143] and consisted of the fusion of the electronic nose and tongue, which, successfully resulted in better classification accuracies. Another particularly exciting prospect targeted the miniaturization of E-noses into portable devices for eventual application as routine on-site analysis tools [144]. Besides the olfactometry application of gas-chromatography, when human sensation and GC analysis is combined [145], headspace GC technologies are also emerging with ultrafast [146] or even miniaturized devices [147].
These fingerprinting technologies combined with a standardized database of signals of volatiles may help to overcome the burden of using a black-box type instrument where identification of fragrant substances is unachievable [148].
These findings attest to the adequacy of using such fingerprinting-based techniques in industrial settings where the lone dependence on panels and other conventional techniques exerts additional costs. Interestingly, studies have shown that outcomes of electronic noses could be correlated to descriptors of sensory panelists, E-noses could be more efficient than traditional methods and could further provide much finer grading of the studied food items [149,150].
Further enhancing the discriminatory features of the electronic olfaction systems by proper screening of array materials and designing drift-compensating apparatus could go a long way in
increasing the robustness, selectivity, and sensitivity of E-noses thus their implementation for food quality applications [151].
4.1. Dairy Products
While the surge of the electronic nose (E-nose) inspired monitoring basic technological aspects such as the fermentation process of yoghurt, it certainly urged others to analyze other dairy products from different aspects [152–155]. Of the latter category, a mass spectroscopy related (MS-related) E-nose was used for the discrimination ofLatobacillus caseispecies. The results revealed that the MS-related E-nose could differentiate the relatively similar strains, and predict the aroma of the products based on the results of the PCA projection [156]. An E-nose with commercial hybrid sensor array system containing 10 MOSFET and 12 MOS sensors was also applied for the discrimination between milk produced by healthy cows and cows infected with mastitis and proved its aptitude in such application.
Other quality aspects such as the monitoring of cheese ripening [157] and the determination of the freshness of Crescenza cheese were assessed using an E-nose composed of MOSFET and MOS sensors with 100% accuracy of the classification of fresh, aged, and mature samples [158].
4.2. Sweeteners Including Honey
Origin determination of honey using an electronic nose has also spurred the interest of several researchers. An E-nose equipped with a MS detector using the SPME sampling technique was applied to classify honey according to their botanical origin: acacia, dandelion, chestnut, rape, linden, and fir.
A 98% correct classification was obtained in PCA and DFA for the botanical origin [159].
Aimed at classifying honey of different botanical provenance using an E-nose consisting of six semiconductor sensors, a study revealed good classification accuracies that depended mostly on the instrumentation setup and applied temperature [160]. The best results were obtained for the following combination of parameters: 15 L/h volumetric flow, 35◦C of barbotage temperature, and acquisition time of 60 s.
In a Chinese study, samples from 14 different botanical and two different geographical origin were analyzed using an E-nose comprising metal oxide sensors (SnO2). The results showed that the E-nose was capable of discriminating the samples according to their geographical origin, and reasonable accuracies were also found for the botanical discrimination. Moreover, physico-chemical parameters such as fructose, glucose, Hydroxymethylfurfural (HMF), amylase activity, and acidity were predicted with coefficients of determination higher than 0.80 [161].
Similarly, the authors of [162] analyzed ziziphus honeys from Iran using an MOS sensors (MG and TGS) based E-nose and demonstrated its efficiency in successfully predicting the moisture (R2>0.9), pH (R2>0.9), ash content (R2>0.8), and free acidity (R2>0.9) of the honey samples.
4.3. Beverages
• Coffee
Brudzewski et al. [163] deployed a differential E-nose equipped with a matrix of MOS gas sensors to detect some common fraudulent practices in coffee. The study aimed at recognizing arabica coffee counterfeited with the cheaper robusta coffee. The built classification model provided with an average error of 0.21% recognition for the 11 classes of the mixtures of arabica and robust coffees. The authors concluded on the suitability of the method as a highly sensitive alternative to the usually adopted technique of liquid chromatography, that is both cumbersome and costly.
A variant in the work with electronic nose consisted of using 10 MOS sensors with different selectivity to volatiles to predict the roasting degree of coffee beans. Results revealed that analysis of the data of the E-nose with general least square regression combined with stepwise backward selection could be applied to determine the level of roasting (L*, mean density) and to detect the endpoint
of the process. R2values superior than 0.9 were obtained for the tested varieties (Brazilian, Indian, Vietnamese, and Costa Rican) [164].
In another study, the efficiency of an E-nose consisting of six metal oxide gas sensors in terms of differentiating different species of Robusta coffee was evaluated. Interestingly, while the electronic nose itself provided a classification rate higher than 90%, the fusion with E-tongue (seven chemical sensors with cross-selectivity) resulted in better accuracy [165].
Another application of the electronic nose using six MOS sensors was investigated for the discrimination of coffee samples dried at different conditions. Of all the studied samples, the hot-air dried and heat pump dried ones were the only ones to overlap on the PCA score plots [166].
Marek et al. (2020), on the other hand, analyzed coffee samples of different botanical origins using an electronic nose equipped with six MOS sensors and managed to separate Brazilian coffee samples from Guatemalan, Ethiopian, and Costa Rican using PCA plots varieties [167].
• Tea
Attempting to classify black tea samples of varying quality levels, the authors of [168] combined the data of the E-nose (equipped with five MOS sensors) to those obtained with an E-tongue. The classification accuracy of the 10-fold cross-validated PLS-DA models significantly improved from an initial value of 84.25% to 92.5%.
However, when coupled to two human panels, the rate of correct classification was slightly inferior and amounted to 90% when a predictive model derived of a five MOS sensor-based system (Figaro, Japan) was used for tea quality assessing [169].
In another study, PLRS analysis was used to predict the catechin, caffeine, polyphenol, and amino acid content of tea samples using E-nose (10 MOS sensors), E-tongue (potentiometric), and electronic eye.
Based on the results of the E-nose, the best correlation was found in the case of caffeine quantification with an R2of 0.609. The fusion of results of E-nose, E-tongue, and E-eye resulted in better separation and prediction accuracies (R20.66–0.865) [170].
• Fruit juice
Application of the E-nose in juice analysis has mostly focused on its spoilage properties since these freshness criteria can function as predictors of their overall quality.
Reinhard et al. [171] applied a MOS base E-nose for the classification of 76 commercial citrus fruit juices and reported 96% correct classification of the tested juices.
An E-nose equipped with a MOS sensor array could detect bacterial concentrations as low as
<102colony forming unit/mL ofAlicyclobacillus acidoterrestrisandAlicyclobacillus acidocaldariusin peach, orange, and apple fruit juices and was also able to classify bacterial contamination independently of Alicyclobacillusspecies with more than 78% of the variance in PC1 [172].
Detecting adulteration in juices is another important field of interest. Hong at. all studied seven data fusion approaches using PEN2 E-nose composed of 10 different MOS sensors and a potentiometric Alpha-Astree E-tongue. In the authentication of fresh cherry tomato juices adulterated with over-ripe tomato juice (0–30%), the data fusion of E-nose and E-tongue measurements presented promising results. CDA and library-SVM were found to ensure better classification whereas the best principle component regression (PCR) model fitting for pH and SSC estimation was realized with an R2higher than 0.99 [173,174].
Ultra-fast GC based Heracles II E-nose was utilized to authenticate 100% orange juice mixed with 100% apple juice. Comparing different classification methods as HCA, classification tree, naive Bayes, ANN, and random forest classifiers. Random Forest classified the orange juice samples with almost 100% accuracy [175].
Multiple ester odorants (20) in apple juice were discriminated with significant differences using a MOS sensor array E-nose [176].
Sensory and postharvest qualities of sugarcane juice were classified with more than 97% variance in PC1 using an E-nose with 10 MOS sensors [177].
• Soft drinks
Microbial assessment of soft drinks is currently a pioneering area of interest in E-nose analysis.
Contamination byAlicyclobacillusspp. in commercial flavored drinks was determined with 100%
classification accuracy when an E-nose equipped with six thin film MOS sensors was used [178].
Alicyclobacillusspp. are thermoacidophilic, spore-forming bacteria that have potential health risks when consumed. Sodium carbonate powder was found to be very effective in absorbing moisture in the samples, which effectively improves the sensitivity and the stability of the E-nose sensors when Coca Cola, Pepsi Cola, Future Cola, and Sprite were accurately classified with 100% accuracy [179].
• Mineral water
Having anything but mild repercussions, the presence of water contaminants continues to be a thoroughly assessed criterion under the stringent restrictions of the World Health Organization (WHO).
Geosmin (GSM) and 2-methylisoborneol (MIB), mainly produced by bacteria, are representative odor compounds and also indicators of contamination in water supply systems. Their presence was investigated with a newly developed E-nose composed of two nanovesicles and could detect GSM and MIB at concentrations as low as 10 ngL−1[179]. An E-nose with 10 metal–oxide sensors, was also used to monitor the purification process in water treatment systems using water from the Nile river and showed significant differences in quality parameters: sulfates, nitrates, chlorides [2].
4.4. Meat
Gas sensors tend to have very broad selectivity, responding to many different substances so the E-nose is better adapted for meat and fish quality. It operates on the measurement of volatile compounds and, as such, requires very little or no sample preparation at all. An E-nose composed of six MOS sensors was used to determine beef freshness during 6 days storage at a temperature of 20◦C and relative humidity of 60% [180].
Similarly, an E-nose consisting of 10 different MOS sensors was used to predict the physical–chemical indexes: sensory scores, total volatile basic nitrogen, and microbial population of beef [181].
Other qualitative studies involved an E-nose with eight MOS sensors to determine beef decay with an accuracy 85.7%, 94.5%, and 96.2% for ANN, SVM, and KNN, respectively [182].
Haddi et al. used an E-nose consisting of eight heated MOS gas sensors to discriminate with 94.64% correct classification accuracy in SVM analysis samples consisting of goat, sheep, and beef stored at 4◦C for 15 days [183].
As per adulteration detection purposes, an E-nose with a sensor array of 10 different MOS sensors was used to detect and predict minced mutton samples tampered with 0%, 20%, 40%, 60%, 80%, and 100% pork [150]. This latter case is an important step in controlling food fraud.
4.5. Fish
Optimizing technological parameters such as time and pressure of applied vacuum is of paramount importance to ensure the desired quality of fish and fish products.
In this regard, in a pioneering study, an E-nose consisting of 14 gas sensors showed that the recommended time for storage (4◦C) of grass carp fillet to maintain its freshness under vacuum at 30 kPa was 10 days but at 50 kPa it was 12 days [184].
Another study deploying an E-nose with eight MOS sensors was targeted at determining fish decay and an accuracy of 85.7%, 94.5%, and 96.2% for ANN, SVM, and KNN, respectively, was achievable [182].
Horse mackerel, anchovy, and whiting fish species were discriminated with an E-nose consisting of eight metal gas sensors with 96.18% correct classification [185].
![Figure 1. Correlative analytical methods used as food quality control devices, their applications, and some of the commonly consumed food matrices defined by the Codex General Standard for Food Additives [21].](https://thumb-eu.123doks.com/thumbv2/9dokorg/769691.34221/5.892.192.699.613.987/correlative-analytical-applications-commonly-consumed-matrices-standard-additives.webp)
![Figure 2. Overview of the evolution of near infrared spectrometers. Reproduced with permission from K H Norris [41] published by Journal of Near Infrared Spectroscopy (2020) 1 , K H Norris (2008) 2,3 Technicon Instruments Corporation [44] published by Anal](https://thumb-eu.123doks.com/thumbv2/9dokorg/769691.34221/7.892.164.730.498.1023/overview-spectrometers-reproduced-permission-spectroscopy-technicon-instruments-corporation.webp)