Correspondence
Z. Kovacs (Kovacs.Zoltan3@etk.szie.hu) doi: 10.1255/nir2017.065
Citation: Z. Kovacs, A. Slavchev, G. Bazar, B. Pollner and R. Tsenkova, “Rapid bacteria selection using Aquaphotomics and near infrared spectroscopy”, in Proc. 18th Int. Conf. Near Infrared Spectrosc., Ed by S.B. Engelsen, K.M. Sørensen and F. van den Berg. IM Publications Open, Chichester, pp. 65–69 (2019).
https://doi.org/10.1255/nir2017.065
© 2019 The Authors
This licence permits you to use, share, copy and redistribute the paper in any medium or any format provided that a full citation to the original paper is given, the use is not for commercial purposes and the paper is not changed in any way.
ISBN: 978-1-906715-27-4
Rapid bacteria selection using Aquaphotomics and near infrared spectroscopy
Zoltan Kovacs,a* Aleksandar Slavchev,b Gyorgy Bazar,c Bernhard Pollnerd and Roumiana Tsenkovae
aDepartment of Physics and Control, Faculty of Food Science, Szent Istvan University, Budapest, Hungary. E-mail: Kovacs.Zoltan3@etk.szie.hu
bDepartment of Microbiology, University of Food Technologies, Plovdiv, Bulgaria
cFaculty of Agricultural and Environmental Sciences, Kaposvar University, Kaposvar, Hungary
dDivision of Hygiene and Medical Microbiology, Medical University of Innsbruck, Innsbruck, Austria
eBiomeasurement Technology Laboratory, Graduate School of Agricultural Science, Kobe University, Kobe, Japan
Efficient, quick and inexpensive screening methods, which provide rapid, in vivo comprehensive probiotic bacteria evaluation, are highly desired in con- temporary microbiology. Aquaphotomics is a novel scientific approach for the exploration of aqueous systems through rapid and comprehensive analysis of water–light interaction as a potential source of information for better understanding of the biological world using spectroscopy. The water spectral pat- tern of the solution as a molecular fingerprint of the cell culture system can be used for quick determination of biological systems. Our objectives are to use near infrared (NIR) spectroscopy with the Aquaphotomics evaluation technique for in vivo discrimination of resistant and non-resistant Lactobacillus strains, and to predict their low pH and bile resistances using different growth stages and different wavelength ranges. Therefore, NIR spectroscopy with Aquaphotomics was applied to monitor the growth of Lactobacillus bulgaricus, Lactobacillus pentosus and Lactobacillus gasseri bacteria strains. Their growth rate, maximal optical density, low pH and bile tolerances were measured and used as a reference data for the analysis of the simultaneously acquired spectral data. The acquired NIR spectra were subjected to various multivariate data analyses to build different qualitative and quantitative models to classify the bacteria strains with different probiotic strength and to determine their phenotypic characteristics. The results of the in vivo evaluation of probiotic and non- probiotic bacteria strains provided accurate, fast and non-invasive identification of probiotic bacteria strains based on spectral monitoring of their bacterial growth. Results also proved that the prediction of the main phenotypic characteristics of probiotic candidates is also possible with NIR spectroscopy and Aquaphotomics.
Introduction
Recently, the market of functional food has been growing significantly as people started to pay more attention to healthy food consumption. Products containing probiotic are an important part of the functional food diets. Probiotic bacteria are non-pathogenic microorganisms that, when ingested in sufficient viable numbers, confer a health benefit on the host.1 Positive effects of probiotics include allevia- tion of irritable bowel syndrome and inflammatory bowel diseases,2 harmonising of the gastro-intestinal tract micro- flora and strengthens the immune system3 or decrease the symptoms of allergies in receptive individuals.4 These
beneficial bacteria must reach the colon in relatively high viable cell counts to employ their positive effect. Therefore, they must survive harsh conditions, such as low pH, pres- ence of pepsin and high concentration of bile salt.5 The best probiotic candidates are the strains which can gain a high amount of biomass in a short period of time and have good ability to survive the harsh environment. The selection of bacteria possessing strong probiotic charac- teristics is a major problem. The currently applied methods based on particular genes selection and in vitro examina- tion of strain growth under model conditions5 are time-
consuming, expensive and not always give satisfactory results. Therefore, development of efficient screening method coupled with cell functionality evaluation is highly needed in contemporary microbiology.6 In recent years, a new approach called “aquaphotomics” has been proposed for the examination of biological systems, using their water spectra as a molecular mirror.7,8 Aquaphotomics has been successfully applied for iden- tification and discrimination of bacterial species at very low concentrations.9 Water spectral patterns of the living microorganisms provide information about their functionality and can be used as fingerprint of cells phenotype. Therefore, Aquaphotomics has the poten- tial to replace the phenotypic and genetic approach for probiotic bacteria selection.
Thus, the objective of this research was to evaluate the applicability of near infrared (NIR) spectroscopy and Aquaphotomics for in vivo discrimination of resistant and non-resistant Lactobacillus strains, i.e. strains possessing different probiotic properties (probiotic, moderate and non-probiotic). An additional aim was to build quantita- tive models for the prediction of the main phenotypic characteristics using different wavelength ranges.
Materials and methods
Seven probiotic and twelve non-probiotic (including six moderate) strains (genus Lactobacillus) were used for the experiments: probiotic strains are L. bulgaricus S06, S10, S11, S19, S22, S25 and L. gasseri S20, moderate strains are L. bulgaricus S01, S07, S08, S09, Y12 and S28, and non-probiotic strains are L. bulgaricus S02, S03, S04, S05, S29 and S30.
The strains were provided by “Selur Pharma” Ltd (Bulgaria), except for the strain L. bulgaricus Y12 which was isolated from yoghurt. All microorganisms were freeze-dried and kept at –80 °C before the experiments.
The three groups (non-probiotic, moderate and probiotic) were determined based on the main phenotypic char- acteristics of the strains by means of their growth rate, biomass production, minimal inhibitory concentration of bile, and best recovery after 3 h at low pH and pepsin.
The methods used for the determination of the main phenotypic characteristics of the strains is described in detail elsewhere.6
Lactobacillus strains were cultivated in MRS at 37 °C for 24 h with shaking in 50 mL centrifuge tubes. NIR trans-
flectance spectra (400–2500 nm, 0.5 nm steps, 0.5 mm layer thickness) of the cultures were collected every 4 min using a XDS OptiProbe Analyzer, immersion probe (FOSS NIRSystems). A reference spectrum was taken at the beginning of every measurement series placing the immersion probe in the dark aperture position of the instrument. The spectra taken in the first 40 min of the cultivation time were discarded and those after 40 min until the scan of 20 h were used for data evalua- tion. The total number of spectra in the evaluation was 5700 (19 strains × 300 spectra). Spectra acquisition was performed with VISION 3.50 (FOSS NIRSystems, Inc., Hoganas, Sweden) software.
The spectra were pretreated using Savitzky–Golay smoothing (2nd order polynomial and 21 points) and multiplicative scatter correction (MSC) before the multi- dimensional data evaluation. Different spectral ranges were used separately during the evaluation (640–840 nm, 840–1100 nm, 1300–1600 nm, 1100–1850 nm) to find the best interval for the discrimination of the different strains. Principal Component Analysis (PCA) was used to describe multidimensional patterns of the NIR dataset and to discover outliers and to provide orthogonal varia- bles for Linear Discriminant Analysis (LDA) where the first seven PCs were used as input to LDA. Moving Window LDA (MWLDA) was used to find the optimal time window for classification of the three main groups where windows of 20 spectra at a time were included in a single LDA model, moving one spectrum forward to build the next model. The performance of LDA models were evaluated by the correct classification rate during training, one- strain-out cross-validation and independent prediction.
Partial Least Square Regression (PLSR) models were built based on the time window showing the best classifica- tion of the main groups to predict the main phenotypic characteristics of the strains. Data of 15 strains was used for model building and data of four strains (S19, S25, S08 and S05) was applied for testing.
Results and discussion
Classification of non-probiotic, moderate and probiotic Lactobacillus strains
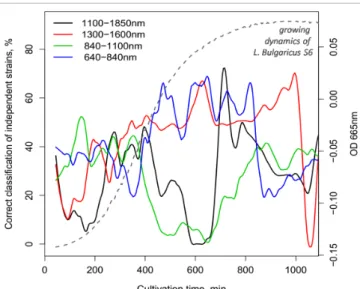
Results of the correct classification rate observed during the independent tests at every time points of the MWLDA models built on the different spectral ranges are summa- rised in Figure 1. The growing curve of L. bulgaricus S06
is also shown to depict the growing dynamics of a strain.
The best classification among the three main groups was found at the end of the exponential growth phase using the wavelength ranges 1100–1850 nm, 1300–1600 nm and 640–840 nm.
The correct classification rates during training, one- strain-out cross-validation and independent prediction of the best LDA models found for the different spectral ranges are shown in Figure 2 together with the respective time windows. Although the wavelength range between
640 nm and 840 nm provided slightly different correct classification compared to the ranges of 1100–1850 nm and 1300–1600 nm during the independent test, the later ones resulted in 100 % correct classification in training and cross-validation.
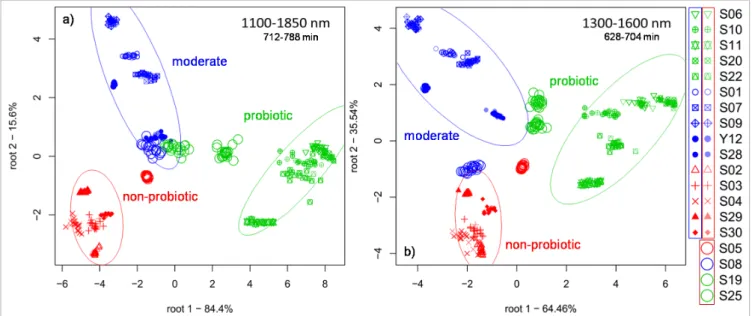
LDA score plots of the classification models built for the classification of probiotic, moderate and non-probiotic bacteria strains in the optimal time window are shown in Figure 3 for 1100–1850 nm and 1300–1600 nm spectral ranges. As the 100 % correct classification rate in training and cross-validation indicated the confidence ellipses of the different strain phenotypes are not overlapping.
Scores of the strains used for independent prediction are projected out of the confidence ellipses, but scores of probiotic strains are closer to the group of moderate ones than to the groups of non-probiotic types and vice versa, i.e. misclassification was observed only between groups of probiotic and moderate strains and between groups of non-probiotic and moderate ones.
Prediction of the phenotypic characteristics of the Lactobacillus strains
Results of the PLSR models built to determine a rela- tionship between spectral data and main phenotypic characteristics of Lactobacillus strains using the best time window for 1100–1850 nm and 1300–1600 nm spectral intervals are summarised in Table 1.
Determination coefficients of cross-validation show closer correlation between the measured and predicted Figure 1. Correct classification achieved with MWLDA
using different wavelength ranges showing the best culti- vation time for classification after 600 min.
Figure 2. Correct classification of probiotic, moderate and non-probiotic strains in train- ing, cross-validation and independent prediction achieved with LDA in the optimal time window* using different wavelength ranges.
phenotypic characteristics for maximal optical density, low pH tolerance and bile tolerance for the wavelength range between 1100 nm and 1850 nm than for 1300–
1600 nm. However, average prediction error of the inde- pendent test has been found lower for all the tested phenotypic characteristics using the spectral range between 1300 nm and 1600 nm.
Conclusions
The evaluation of the different wavelength ranges and different time windows of the cultivation time for classi- fication of groups of probiotic, moderate and non-probi- otic Lactobacillus bacteria strains have been performed.
Results showed spectral ranges between 1100 nm and 1850 nm and between 1300 nm and 1600 nm in the time Figure 3. LDA score plots with 95 % confidence ellipses presenting the classification of probiotic, moderate and
non-probiotic strains in the optimal time window, a) 1100–1850 nm, b) 1300–1600 nm.
ntraining = 300
nprediction = 80 Growth rate
Maximal optical density
Low pH
tolerance Bile tolerance Wavelength range: 1100–1850 nm, Optimal time window: 712–788 min
Factor# 8 6 5 7
R2Cal 0.9564 0.9201 0.9452 0.9716
RMSEC 0.0160 0.2076 0.0103 0.1559
R2CV 0.9560 0.9198 0.9449 0.9711
RMSECV 0.0161 0.2079 0.0103 0.1571
RMSEP 0.0768 0.4083 0.0385 0.4922
Wavelength range: 1300–1600 nm, Optimal time window: 628–704 min
Factor# 9 5 5 7
R2Cal 0.9755 0.8125 0.8514 0.8816
RMSEC 0.0120 0.3180 0.0169 0.3182
R2CV 0.9720 0.8123 0.8512 0.8811
RMSECV 0.0128 0.3182 0.0169 0.3190
RMSEP 0.0743 0.3917 0.0338 0.4307
Table 1. Summary of PLSR models’ accuracy built to predict main phenotypic characteristics of Lactobacillus strains. OD: optical density.
windows between 712 min and 788 min and between 628 min and 704 min, respectively, are the best for the classification of the three main groups. The results of the in vivo evaluation of bacteria strains provided accu- rate, fast and non-invasive identification of the different strains based on spectral monitoring of their bacterial growth. Results also proved the prediction of the main phenotypic characteristics of probiotic candidates is also possible with NIR spectroscopy and Aquaphotomics.
The multivariate methods applied for the spectral data assessment with regards to phenotype identification showed several common water absorbance bands with high importance.
Acknowledgements
This study was supported by the János Bolyai Research Scholarship of the Hungarian Academy of Sciences, Hungary (Zoltan Kovacs) and by the New National Excellence Program of the Ministry of Human Capacities (ÚNKP-16-4, Gyorgy Bazar). The authors would like to thank Selur Pharma Ltd, Bulgaria for providing the bacte- rial strains.
References
1. FAO/WHO, Joint Working Group Report on Drafting Guidelines for the Evaluation of Probiotic in Food.
London, Ontario, Canada, April 30 and May 1, London (2002).
2. L.V. McFarland, “Meta-analysis of probiotics for the prevention of traveler’s diarrhea”, Travel Med. Infect.
Dis. 5(2), 97–105 (2007). https://doi.org/10.1016/j.
tmaid.2005.10.003
3. S. Parvez, K.A. Malik, S. Ah Kang and H.-Y. Kim,
“Probiotics and their fermented food products are
beneficial for health”, J. Appl. Microbiol. 100(6), 1171–1185 (2006). https://doi.org/10.1111/j.1365- 2672.2006.02963.x
4. M.A. Kalliomäki and E. Isolauri, “Probiotics and down-regulation of the allergic response”, Immunol.
Allergy Clinics N. Amer. 24(4), 739–752, viii (2004).
https://doi.org/10.1016/j.iac.2004.06.006
5. I. Pitino, C.L. Randazzo, G. Mandalari, A. Lo Curto, R.M. Faulks, Y. Le Marc, C. Bisignano, C. Caggia and M.S.J. Wickham, “Survival of Lactobacillus rhamno- sus strains in the upper gastrointestinal tract”, Food Microbiol. 27(8), 1121–1127 (2010). https://doi.
org/10.1016/j.fm.2010.07.019
6. A. Slavchev, Z. Kovacs, H. Koshiba, A. Nagai, G. Bázár, A. Krastanov, Y. Kubota and R. Tsenkova,
“Monitoring of water spectral pattern reveals differ- ences in probiotics growth when used for rapid bac- teria selection”, PLoS One 10(7), e0130698 (2015).
https://doi.org/10.1371/journal.pone.0130698 7. B. Jinendra, K. Tamaki, S. Kuroki, M. Vassileva,
S. Yoshida and R. Tsenkova, “Near infrared spectros- copy and aquaphotomics: Novel approach for rapid in vivo diagnosis of virus infected soybean”, Biochem.
Biophys. Res. Commun. 397(4), 685–690 (2010).
https://doi.org/10.1016/j.bbrc.2010.06.007
8. R. Tsenkova, “Aquaphotomics: dynamic spectroscopy of aqueous and biological systems describes pecu- liarities of water”, J. Near Infrared Spectrosc. 17(1), 303 (2009). https://doi.org/10.1255/jnirs.869 9. Y. Nakakimura, M. Vassileva, T. Stoyanchev, K. Nakai,
R. Osawa, J. Kawano and R. Tsenkova, “Extracellular metabolites play a dominant role in near-infrared spectroscopic quantification of bacteria at food- safety level concentrations”, Anal. Methods 4(5), 1389 (2012). https://doi.org/10.1039/c2ay05771a