https://doi.org/10.1007/s41348-020-00300-6 REVIEW
Non‑destructive imaging and spectroscopic techniques to investigate the hidden‑lifestyle arthropod pests: a review
Sándor Keszthelyi1 · Zsolt Pónya1 · Ádám Csóka3 · György Bázár2 · Tamás Morschhauser4 · Tamás Donkó3
Received: 3 August 2019 / Accepted: 11 January 2020 / Published online: 1 February 2020
© The Author(s) 2020
Abstract
There are several harmful and yield decreasing arthropod pests, which live within plant tissues, causing almost unnoticeable damage, e.g. Ostrinia nubilalis Hbn., Cydia pomonella L., Acanthoscelides obtectus Say. Their ecological and biological features are rather known. The process leading to the damage is difficult to trace by means of conventional imaging tech- niques. In this review, optical techniques—X-ray, computer tomography, magnetic resonance imaging, confocal laser scan- ning microscopy, infrared thermography, near-infrared spectroscopy and luminescence spectroscopy—are described. Main results can contribute to the understanding of the covert pest life processes from the plant protection perspective. The use of these imaging technologies has greatly improved and facilitated the detailed investigation of injured plants. The results provided additional data on biological and ecological information as to the hidden lifestyles of covertly developing insects.
Therefore, it can greatly contribute to the realisation of integrated pest management criteria in practical plant protection.
Keywords Analysis · Arthropod pest · Hidden lifestyle · In vivo · Plant protection · 3D imaging technology
Introduction
Ecological characteristics of hidden‑lifestyle arthropods
In the assessment of losses due to pests, hidden-lifestyle insects present a particularly serious problem. Several, arable, horticultural and forestry pests that belong to differ- ent taxonomy groups have this special developmental trait.
A non-exhaustive list of such pests includes the xylopha- gous longhorn- (Cerambycidae), jewel- (Buprestidae) and bark beetles (Scolytidae) (Coulson and Witter 1984) or etc.
Substantial economic damage caused by these species was recorded (Hill 1987).
The young hatched larvae of O. nubilalis intrude the maize tassel and spend their postembryonic development in the stalk constantly moving downwards, meanwhile caus- ing transpiration disturbances. In the absence of preventive measures, O. nubilalis occurring in a large proportion (20 to 40%) in Central European cause an estimated yield loss between 5 and 30% (Meissle et al. 2009).
These arthropod pests live mostly hidden in plant tissues.
In the majority of cases, only their mastication and emer- gence holes’ point to their presence based on plant surface hints (Mateus et al. 2010). Different benefits account for features of this hidden developmental pattern such as the exploiting of: (1) protection against predators and parasi- toids; (2) the presence of nutrition; (3) the optimal abiotic conditions in temperature, humidity and pH. During this developmental stage the insect causes various biological dis- turbances to the plant which depends on its habitat: (1) spe- cies developing in the roots trigger the interference of water and transport of minerals; (2) species developing in the stem inflict disturbance on plant transpiration; (3) species devel- oping in the seeds cause the destruction of endosperm and embryo (Porca et al. 2003; Zhekova 2017). The larvae rais- ing, the plant tissue dissection and different observation in
* Sándor Keszthelyi ostrinia@gmail.com
1 Department of Plant Production and Protection, Kaposvár University, S. Guba str. 40, Kaposvár 7400, Hungary
2 Faculty of Agricultural and Environmental Sciences, Institute of Food and Agricultural Product Qualification, Kaposvár University, S. Guba str 40, Kaposvár 7400, Hungary
3 Medicopus Nonprofit Ltd, S. Guba str 40, Kaposvár 7400, Hungary
4 Department of Hydrobiology, University of Pécs, Ifjúság str. 6, Pecs 7624, Hungary
field conditions (pheromone and light traps, etc.) have also been used to monitor the ecological characteristics of hidden developing insects as a conventional method (Himmi et al.
2018). In plant sciences as a whole, studies making use of non-destructive image and spectroscopic techniques have remained comparatively scarce. Taking computer tomogra- phy (CT) as an example the first use this technique can be linked to forestry testing (Taylor et al. 1984). Staedler et al.
(2013) pointed out that the part of articles in the subject area
“plant sciences” that comprises the topic “computed tomog- raphy” is approximately 6 × less than in “zoology” and 27 × less than in an average ISI-referenced publications. Thus, computed tomography is comparatively underused in plant sciences, and there is little meaningful trend towards change.
Current imaging techniques for hidden plant pest analysis
Radiography, computer tomography (CT), magnetic reso- nance imaging (MRI) and near-infrared spectroscopy (NIRS) use a part of the electromagnetic spectrum to produce images. The electromagnetic spectrum is the frequency- based arrangement of the electromagnetic radiation. The electromagnetic radiation consists of electric and magnetic field which are perpendicular to each other and perpendicu- lar to the direction of the propagation. The transmissibility of the electromagnetic radiation through the medium largely depends on the properties of the material and the frequency of the radiation (Hart et al. 2003; Liu et al. 2017). The prop- erties of the electromagnetic radiation of the here focused imaging methods are shown in Table 1.
The principle behind the use of confocal laser scanning microscopy (CLSM) in biological applications is the concept of obtaining clear optical sections of transparent, fluores- cent specimens, hence obviating the need for physical tissue sectioning (Pawley 2006). This can be achieved by confocal pinhole-based illumination of the specimen, capitalising on photomultiplier tube technology, which results in an image plane that is conjugate with the specimen plane so that out- of-focus light emanating from the specimen is discriminated against and thus largely hindered to impinge on the detector.
Consequently, stacks of 2D images acquired by scanning sequential focal planes can be rendered 3D images.
The physical basis of IR thermography is that every object with a temperature over the absolute zero point (0 K = − 273.15 °C) emits infrared (IR) radiation, which is albeit invisible to the human eye, and determined by ther- mal sensors by a detector sensitive to IR radiation (Meola and Carlomagno 2004). Based on the intensity of the IR radiation, one can determine the temperature of the object’s surface from which a thermal image is made. The electri- cal signal generated can be displayed in units of tempera- ture. Eventually, each signal is given a certain colour which, following energy conversion to an electrical signal, can be displayed in units of temperature facilitating temperature measurement from a distance without contacting the object to be measured.
Our review is focussed in the next chapters in in vivo plant imaging methods suitable for the detection of the bio- logical parameters of hidden-lifestyle arthropod pests of highlighting their advantages and disadvantages and their technical details.
Non‑destructive imaging techniques
X‑ray imagingThe X-ray imaging is the most commonly used imaging technique in the medical practice, providing two-dimen- sional projections. Radiography is performed with an X-ray source on one side of the object and a (typically flat) X-ray detector on the other side. A short duration (typically less than half second) pulse of X-rays is emitted by the X-ray tube, a large fraction of the X-rays interacts in the exam- ined object, and some of the X-rays pass through the sam- ple and reach the detector, where a radiographic image is formed. The homogeneous distribution of X-rays that enter the sample is modified by the degree to which the X-rays are removed from the beam (i.e. attenuated) by scattering and absorption within the tissues. The attenuation properties of tissues such as bone, soft tissues and air are very different,
Table 1 Technical properties of imaging methods
Non-ionising radiation Ionising radiation
Area MRI CLSM NIRS IR thermography Radiography and CT
Class Radio waves Collimated light waves Infrared light Thermal infrared X-rays
Frequency ~ 5–600 MHz Hundreds of THz range 120–385 THz 0.1 THz–1 PHz 30 PHz–30 EHz
Wavelength 100–1 m Depends on the type of laser cannon, e.g. red laser:
(660 and 635 nm), green laser: (532 and 520 nm),blue-violet laser: (445 and 405 nm)
0.78–2.5 µm 0.7–20 μm 0.01–10 nm
Energy 10 neV–1 ueV mJ range 495 meV–1.6 eV 124 meV–1.24 eV 100 eV–100 keV
resulting in the heterogeneous distribution of X-rays that emerges from the sample. The radiographic image is a pic- ture of this X-ray distribution. The detector used in radiogra- phy can be photographic film (e.g. screen-film radiography) or an electronic detector system (i.e. digital radiography) (Bushberg et al. 2002). Radiography is a useful technique to visualise the projection of the sample, but it has limitations, e.g. the studied object is overlapped by other things with the same or higher density.
Milner et al. (1950) developed an X-ray technique which provided satisfactory depiction of internal infestation of insects in grain. Developments of Sitophilus granarius L.
and S. orizae L. were observed by this method, without any deteriorative effects of radiation upon their development.
Other techniques applied in seed testing (Metzner 1962) like coffee beans and nuts (Estevez 1959; Vilar 1966) are not applicable to soft vegetable materials.
According to Martel and Belanger (1977), X-ray xerog- raphy can be developed into useful in situ tool in the study of the biology of hidden insects in plants without plant dis- section (Fig. 1). As a result of these authors, the movement of O. nubilalis larvae within maize plants can be followed at different intervals up to harvest. However, it is clearly vis- ible that X-ray absorption is dependent on density, a clear picture was created by marked X-ray absorption by solid plant or sclerotised animal tissues, but less so by soft tis- sues and even less by fatty tissue. X-ray imaging is suitable for preview 2D image creation, but imaging of some spatial forms or co-presence of more larvae has proven cumbersome
(e.g. bean damaged by Acanthoscelides obtectus Say). The advantage of this technique is its easy mobilisation, but the vitality of the examined organism can deteriorate by more irradiation (similar to CT).
Computer tomography imaging
The computer tomography (CT) uses X-ray radiation for image processing, but this technique can produce values of X-ray absorption by volume elements in the examined object (Herman 2009). During the data collection procedure, the X-ray tube rotates continuously around the object (X–Y plane) and simultaneously the examination table moves per- pendicular to this plane (Z direction). This is the so-called spiral data collection mode in the multi-slice CT system, where an image reconstruction algorithm calculates 2D pixel values with a third dimension given by slice thickness. These volume elements (voxels) have radiodensity values in the Hounsfield scale (HU—Hounsfield Unit). As an example,
− 1000 HUs correspond to air, and 0 HU corresponds to water. The result of a CT process is a 3D matrix of HU val- ues containing the voxels from the examined object (Gold- man 2007a). The spatial resolutions of the equipment are different. Nowadays, the medical CT scan produces sub- millimetre spatial resolution (e.g. 250 µm) and a micro-CT scanner achieves < 10 µm (Goldman 2007b, 2008). How- ever, the micro-CTs reach a better resolution, but the field- of-views are definitely smaller. The micro-CT resolves 5-μm features, covers a field-of-view about 12 cm wide with an 80-cm vertical travel range, while the medical scanners can produce images from an object with 50 cm diameter (cylin- der) and 150 cm length (Manuel et al. 2014).
CT is one of the most useful non-destructive techniques providing qualitative and quantitative results using ionised radiation. It can visualise the texture and volume fractions of examined objects. The density parameters can also be used for statistical analysis throughout the 3D volume.
There are some limitations of this technique. Firstly, when the lowest achievable voxel size is large compared to the size of the object under investigation. Secondly, dur- ing the CT scanning process there can be other detrimental effects, such as the presence of artefacts produced by metal- lic materials. The tomographic reconstruction requires an immobile object which does not move during the CT exami- nation. Thirdly, using different examination protocols must be avoided, because it may lead to image acquisition anoma- lies caused by the individual operator. The image acquisi- tion protocol should be well defined; otherwise, quantita- tive analysis is unrealisable. Thereafter, the prepared volume from the cross-sectional images needs to be analysed using 3D analysis software. Manual, semiautomatic or automatic segmentation is crucial for quantitative or adequate qualita- tive results on the 3D.
Fig. 1 X-ray projection of Agapanthia cardui L. (Col.: Cerambyci- dae) larvae in giant goldenrod (Solidago gigantea Aiton) stem
Although there are few data in connection with the hid- den-lifestyle pests’ detection (Himmi et al. 2018) (Fig. 2), the method is used primarily for pest morphology and monitoring of insect development (Socha et al. 2007).
Richards et al. (2012) demonstrated how μ-CT can be a powerful tool for describing internal and external morpho- logical changes in Calliphora vicina Robineau-Desvoidy during metamorphosis. The scans were of sufficiently high resolution (17.2 μm) to visualise the internal morphol- ogy of developing pharate adults at all the four ages. In addition, the images of high-resolution X-ray computed tomography (CT) provide new insight and details of meta- morphosis of several insects and allow the measurement of tracheal and gut volume (Lowe et al. 2015). These authors indicate a rapid development of the tracheae, which become visible in scans just 12 h after pupation.
The use of new technologies, especially computer- based three-dimensional reconstructions and micro-CT (μ-CT), have greatly improved and facilitated the detailed investigation of insect anatomy. The use of μ-CT greatly enhances the efficiency of the acquisition of detailed ana- tomical data and allows a broad taxon sampling in phylo- genetic studies partly or entirely based on morphological characters. The disadvantage of phase-contrasted μ-CT images is the poor differentiation of different tissue types (Friedrich and Beutel 2008).
Visualisation of the hidden developing is considerably better by means of CT; moreover, 3D imaging and its multi-directional rotation can be of great avail. Unfortu- nately, the mobile use of CT cannot be implemented. In addition, the distinction of the same radiodensity materials
is cumbersome and assumes the formulation of subjective opinions.
Magnetic resonance imaging
Magnetic resonance imaging (MRI) is one of the most popular cross-sectional digital imaging methods for clinical diagnostic and medical research. The examination provides high-quality images without any known harmful effects for living organisms (Callaghan 1991). The MRI uses the low magnetic nature of the hydrogen protons which have dif- ferent behaviours depending on the type of the tissues (e.g.
lipids and water). The examined object is placed within the magnet usually having 0.2–3.0-Tesla magnetic field power (T). In this constant magnetic field is applied by radio-fre- quency pulses on the appropriate resonant frequency known as the Larmor frequency. It is causing an excited status of the protons in the sample because of the energy absorption.
These protons generate radio waves, which emissions are detectable by a receiver coil, resulting in nuclear magnetic resonance (NMR) signal. Measuring the intensity of the MR signal, accurate spatial placement of signal intensities of different strengths from different points of the examined objects and cross-sectional representation of the signal intensities with the grey scale is the basis for MR imaging.
The NMR signal changes over time depending on the pro- tons’ local microenvironment. The differences are that the NMR signals producing a contrast on the cross-sectional images. The images have slice thicknesses; therefore, it is possible to determine the resonance signal from individual volume elements known as voxels. The resolution of the
Fig. 2 3D and three planes view of Ropalopus macropus Germar (Col.: Cerambycidae) by means of computed tomography.
The cavities made by larvae indicated with light green and the larvae with red colour on the 3D view
image is determined by the size of the voxels. Multiple two- dimensional slices through a sample can also be acquired in different ways to provide a three-dimensional image (Hart et al. 2003).
The main advantage of this modality is not using ionised radiation for image producing. The high-field MR scanners have good spatial resolution (highest approx. 5 µm) in case of enough amount of water in the examined samples. This modality is sensitive for several factors during the examina- tion process. First of all, the strong magnetic field excludes the examination of samples containing magnetic metals. The examined object should contain enough amount of protons for getting appropriate signal from them. It is a quantity and quality criterion of the material for the successful MRI image. The scanning process takes a few minutes. Therefore, the immobility of the test sample should be ensured for this time. Generally, the field-of-view of the high-field medical scanners is approximately 50 cm. The scanners dedicated to small animal experiments have higher magnetic field (7T), with a limited sample size.
Although MRI is in everyday use in clinical practice, con- ventional medical imaging systems generally have insuffi- cient resolution for entomological studies (Goodman et al.
1995) (Fig. 3). Magnetic resonance imaging (MRI) is basi- cally used for studying morphological (Wecker et al. 2002) and anatomical details of insects. Several studies were con- ducted in monitoring cerebral development during metamor- phosis and synaptic activity in the developing insect brain (Michaelis et al. 2005; Watanabe et al. 2006).
Detection of parasites within an insect provides a good example of the use of MR. Successful applications include the imaging of development, behaviour and host damage done by parasitoid wasps of the Plodia interpunctella Hbn.
(Chudek et al. 1996). The first use of MRI in entomology was in imaging the embryonic development of a locust (Gassner and Lohmann 1987). However, the clear disad- vantage of MRI is the heating of samples during extensive excitation periods, and it has also been possible to image the changes in relatively small structures within the developing imago (Mapelli et al. 1997). Furthermore, MRI is suitable for chemical shift imaging in pH metabolism in insect organ- isms (Skibbe et al. 1995).
The main criterion of MR imaging is the high water con- tent of examined plant materials. Therefore, the internal pests of dried plant tissues including the stored products cannot be analysed by this method. More worrisome is the fact that vitality decreases or possible destruction of the examined animal occurs due to temperature rise as a reper- cussion of long procedure time.
Confocal laser scanning microscopy
The unequivocal advantage of confocal laser scanning microscopy is a higher resolution against the “conven- tional” light microscopy. This feature of CLSM comes into play even in studies aimed at visualising the morphologi- cal aspects of damage brought about by hidden-lifestyle arthropod pests (Fig. 4). The other benefit in applying this technology to visualising arthropods lies in the fact that it obviates the tedious task of embedding and sectioning samples, after employing fixatives that may introduce
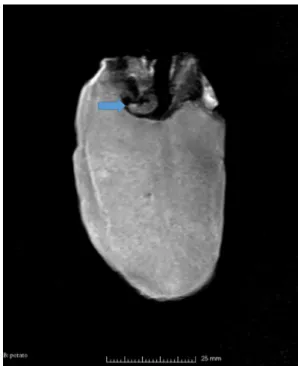
Fig. 3 MR scan of Phthorimaea operculella Zeller (Lep.: Gelechii-
dae) larva in potato Fig. 4 CLSM image of Mercurialis annua L. female gametophyte
showing insect-borne injury pointed by an arrowed
artefacts in the treatment of the specimen per se. There- fore, sample preparation for CLSM is substantially faster leading to a considerably higher number of specimens that can be analysed.
CLSM offers the potential of studying the distribution of pathogens in live organs parts/tissues. The method allows in situ snapshots taken at the 3D level due to optical section- ing, providing an impressive spatial resolution, which can prove advantageous for studying the movements of patho- gens in their vectors. Three-dimensional rendering of CLSM data set obtained via confocal imaging of a fluorescently labelled/autofluorescent specimen furnishes fine structural details of insects. The autofluorescent plant tissues hinder the gaining of high-fidelity images of hidden-lifestyle insects in situ unless autofluorescence/fluorescent light emission deriving from insects cannot be separated from the plant tissues. According to Michels (2007), the autofluorescence of insect cuticle can be taken advantage of by excitation with a laser beam with wavelength of 488 nm, while emitted light can be collected at 500–570 nm and at 580–690 nm.
The overlay image of the two channels reveals the extent of sclerotisation of the cuticle (Deans et al. 2012). Cuticular structures and unsclerotised body parts are particularly suit- able for CLSM studies due to their tissues being autofluo- rescent. When production of several laser beams of different excitation wavelengths is possible by the set-up used, soft tissues can be differentiated from cuticular ones (Michels and Gorb 2012). The high fidelity of CLSM-derived images as compared to those collected by conventional microscopy allows to visualise very thin or small body parts of insects (Klaus and Schawaroch 2006; Michels 2007). Thicker lay- ers can hardly be visualised without resorting to the use of clearing agents to bleach tissues such as hydrogen peroxide (Stüben and Linsenmair 2008), methyl salicylate, lactic acid (Michels 2007) on Murray’s clearing solution (1 part benzyl alcohol + 1 part benzyl benzoate) (Zucker 2006).
Albeit providing high-resolution and fine-structure data, high-quality scans can require long time intervals posing a problem pertaining to long-time exposure-related “blurring”
effect attributable to even slight movements of specimens.
Therefore, it is a prerequisite to immobilise the specimen to be imaged. Another challenge is to position the specimen to be visualised in such a manner that its 3 dimensionality is ensured by special coverslips placed on the rims of spacers forming a well filled up with glycerine. For this purpose ethanol, buffers or water also suffices. The longer the scan- ning intervals the higher the viscosity of the mounting solu- tion must be.
Besides conventional media such as Canada balsam or Euparal (Schawaroch and Li 2007), agarose with suitable concentration or glycerine jelly can also be used with the advantage that they allow for delicate handling of the speci- men while minimising deformation.
CLSM data are helpful also for volume rendering.
Assuming maximum projections of the image stacks yields lower-quality visualisations. Therefore, the reconstruction of surface-based 3D images from optical slides can be per- formed on flat or small isolated objects as well.
As high-energy laser beams excite the specimen, photo- bleaching easily occurs which presents technical difficul- ties, though it can be also exploited in certain investigations aimed at detailed analysis of genital fitting, e.g. (Kamimura and Mitsumoto 2011). Another problem in analysis of arthropods (generally in studying any object) assisted by confocal microscopy concerns “false” data due to imag- ing thick samples. This encounters as “poorly represented”
pixel intensities stemming from data loss from the side of the specimen off the illumination source. Additionally, axial dis- tortion of the 3D data set can also occur (Klaus and Schawa- roch 2006). Notwithstanding these potential pitfalls, CLSM has been widely used in studying arthropods since confocal microscopy can provide high-quality images of arthropod specimens that are prepared for conventional fluorescence microscopy (Friedrich et al. 2013). Detailed image pro- cessing of CLSM provides an opportunity for investigating insect morphology (Michels 2007; Michels and Gorb 2012) and has proved a powerful tool in systemic studies as well (Klaus et al. 2003; Klaus and Schawaroch 2006).
Klaus et al. (2003) evaluated the usefulness of CLSM and 3D reconstruction in fly morphological studies by imaging adult male genital structures dissected from well-described mosquito and fruit fly species. Their results indicate that CLSM offering 3D reconstruction is an excellent technique for visualising small, complex, autofluorescent structures in flies. CLSM could have a profound impact on the qual- ity of information provided by 3D representations of insect structures as compared to more traditional methods of visu- alisation. Therefore, this technique can be effectively used for taxonomy identification of some ambiguously classified insects due to its detailed accuracy (Lee et al. 2009).
CLSM based on pinhole illumination by coherent light beams focused on the specimen furnishes detailed visual information on pests destroying plant tissues. This is a con- dition their autofluorescence can be separated from that of the plant tissue surrounding them. Another limitation is the necessity to use fluorophores in order to obtain images (in lieu of sufficient autofluorescence). Further, confocal set- ups tend to be expensive the purchase of which may well be beyond the financial means of research laboratories.
Infrared thermography
Infrared technology (IR) has experienced considerable advancements to determine quantitatively measurable traits of living organisms. It can offer rapidly body temperature (Fig. 5): (1) it can be applied even in the case of moving
objects; (2) it can supply data without having a physical contact between the equipment used for measurement and the object; (3) it facilitates measurements of hazardous or inaccessible targets; (4) it causes no interference or energy dissipated from the target during measurement; (5) it does not bring about physical impingement on the surface whose temperature is to be measured.
These favourable traits of the technology render it popular as a non-invasive approach in the analysis of physiological state of many organisms; thus, it has been applied in a wide range of medical diagnosis in veterinary or animal science applications (Stabentheiner et al. 2002; Karstberger and Stachl 2003) as well as in plant research (Bermadinger-Sta- bentheiner and Stabentheiner 1995). Recently, the technique has been found useful in many areas of animal behavioural studies.
The principle which makes the use of this method appli- cable almost ubiquitously is that all objects possess IR radia- tion characteristic of their temperature due to the movement of molecules, which concomitantly causes charge displace- ment leading to electromagnetic radiation in the form of photons emitted. The electromagnetic radiation can be meas- ured deflected, focused or reflected from surfaces offering thermo-electronic devices to be used. The wavelength of this radiation spans a wide spectrum: from 0.7 to 1000 µm (DeWitt 1988; Wolfe and Zissis 1993). From this wide range of the electromagnetic spectrum 0.7 to 14 µm can be utilised for IR measurements, particularly the mid-wave (3–5 µm) and long-wave (8–14 µm) bands. In accordance with Planck’s curves (depicting the typical radiation of a body at different temperatures), the peak value of radiation moves towards shorter wavelengths as the temperature of
the body rises. Planck’s curves reveal that higher energy values correspond to shorter wavelengths. Consequently, the shortest possible wavelength within the temperature range of an IR thermometer is ideal for maximising the quantity of radiance. This is explained by the radiation energy emit- ted by an object that is temperature dependent. An ideal substance is considered to be one which emits and absorbs all frequencies, absorbing light of all colours. Therefore, it looks black, and so is it dubbed a “black body”. Living systems are described as “grey bodies” because they also reflect IR radiation.
In the IR thermometer a detector converts the IR radiation detected into electrical signals (DeWitt 1988). Because IR detectors normally measure over a certain range of wave- lengths, they use grey body approximation. This poses prob- lems when the target emissivity varies with wavelength, calling for the necessity to measure the emissivity of a non- grey target at the given temperature (Madding 1999). If the absorption media are not considered, data assessment can lead to lower than real temperatures of the actual target. IR thermometers are processed to measure a particular spectral range due to the absorption behaviour of the transmission path, mostly the ambient air, and some components, such as vapour and carbon dioxide, absorb IR radiation at particular wavelengths. Thermal radiation in the environmental com- partment which the object to be measured is surrounded by also needs to be regarded. This emission can be achieved by integrated thermal radiation compensation (Stabentheiner et al. 2002).
Infrared thermography can be widely used variedly in entomological practice (Vadivambal and Jayas 2011; Al- Doski et al. 2016). Processes of insect physiology (cold adaptation, thermoregulation) (Stabentheiner and Schma- ranzer 1987; Stabentheiner et al. 2012) and the presence of arthropod pests in wood and plant material can be ana- lysed by IR thermography (Palmer et al. 2004). The use of thermal imaging offers an alternative method in detecting insect infestation as the respiration of insect results in heat production higher than that of the plant (Gilberg et al. 2003;
Hoffmann and Schröder 2013). The mapping of the surface temperature of grain, insects can be detected. Manickavasa- gan et al. (2008) used an infrared thermal imaging system to detect infestation by Cryptolestes ferrugineus Stephens inside wheat kernels. This system was developed to detect infestation by six developmental stages (four larval instars, pupae and adults) of C. ferrugineus under the seed coat on the germ of the wheat kernel.
Chelladurai et al. (2012) applied thermal images of un- infested mung beans and beans infested with egg, larval, pupal stages of Callosobruchus maculatus Fabricius along with completely infested mung beans.
Palmer et al. (2004) used infrared video thermography to investigate cold adaptation in an alpine insect, expanding
Fig. 5 Thermal imaging of warm-blooded Microtus arvalis L.
(Rodentia: Cricetidae) (arrow marked) under the soil surface
such investigations to include behavioural response as an indicator of physiological stress. It provides a large amount of physiological information, such as supercooling points, lower lethal temperatures and haemolymph melting points.
Verdú et al. (2012) confirmed the different thermoregulatory mechanisms between two sympatric scarab beetles using infrared thermography and micro-computer tomography.
More detailed ecological information was also acquired by this method, such as determination of the developmental stage of a parasite, which develops inside the body (Kroder et al. 2008).
IR proves very versatile tools in many biological appli- cations, but as arthropods are poikilothermic animals and consequently their internal temperature varies considera- bly, their body temperature is temporarily affected by rapid changes in ambient temperature leading to uncharacteristic IR images. In addition, infrared measurement does not reveal internal temperature; it provides data on body surface tem- perature only.
Near‑infrared spectroscopy and hyperspectral imaging
Near-infrared (NIR) spectroscopy uses the near-infrared light from 780 to 2500 nm and analyses the molecules in investigated samples (Williams and Norris 2001). NIR light excites molecular vibrations related to hydrogen; thus, the NIR absorptions of biological samples can indicate O–H, C–H, N–H and S–H chemical bonds. Since agricultural bio- logical samples contain various molecules possessing the above-mentioned bonds, the measured spectra are highly complex. The evaluation of the complex spectral information requires pre-processing methods and multivariate statisti- cal approaches, because all chemical bonds have a specific absorption band (Naes et al. 2002). The spectra can be con- verted mathematically to precise quantitative or qualitative information about the chemical and physical nature (Martens and Stark 1991). Regular NIR spectroscopy holds informa- tion on an inhomogeneous matrix representing an average of the mixture. The frequent application of NIR spectroscopy for the rapid estimation of chemical components or physi- cal parameters of divergent matrices is reasoned by the fol- lowing: short analysis time, little or no sample preparation required, reagent-free operation, lack of waste production, non-destructive nature of analysis causing no harm neither in food nor in live biological samples and the possibility to gain results for multiple parameters from a single spectrum depending on the available calibrations. The drawbacks lie in the facts that the NIR light has little penetration power and the spectra mostly hold information about the surface of the scanned samples only. Therefore, the calibration requires many samples with reference information on each variable to be calibrated on. The accuracy of the calibrations is highly
influenced by the accuracy of the reference methods. The calibration procedure requires special software and know- how during the calibration process; spectral factors arising from geometry of spectroscopic measurement or light scat- tering might be analysed and interpreted. Instrumentation in NIR spectroscopy has been developed considerably in the past few decades, resulting in a large variety of available technologies on the market, from high-precision bench-top instruments employing diffuse grating monochromator tech- nology or Michelson interferometers (FT-NIR), to miniatur- ised portable or hand-held devices. NIR spectroscopy has been widely used in agricultural applications from soil to the table (Roberts et al. 2004).
In entomology, this method can be primarily used for identification of insect fragments in damaged plant tissues (Perez-Mendoza et al. 2003; Roggo et al. 2007). Therefore, this approach can be employed to detect the presence of hidden-lifestyle arthropod pests (Singh et al. 2009). Large spectral differences were observed by means of NIR spec- troscopy between uninfested kernels and kernels infested internally with S. granarius larvae or pupae, arising from both a changed chemical composition and physical struc- ture (Ridgway and Chambers 1996). Dowell et al. (1999) examined the possibility that NIR spectroscopy could be used for taxonomic purposes based on the premise that every species may have a unique chemical composition.
Tests were conducted in 11 species of beetles commonly associated with stored grain. They indicate that the absorp- tion characteristics of cuticle lipids could assist in the clas- sification of these species.
Hyperspectral imaging enjoys a growing popularity.
This imaging technology combines spectroscopic knowl- edge will the spatial determination of photography. The recorded images contain several layers of spectral infor- mation, i.e. there is a spectrum with various spectral res- olutions in each pixel of a spatial image. The immense data containing spatial and spectral information called hypercube can be analysed with sophisticated mathemati- cal methods. The technology is useful to analyse and map inhomogeneous samples, and it has been widely used in agricultural applications (Dale et al. 2013; Mahlein et al.
2018).
Hyperspectral imaging is suitable for a direct and non- destructive detection of hidden developing arthropod pests as well. Healthy wheat kernels and wheat kernels damaged by the feeding of S. oryzae, R. dominica, C. ferrugineus and Tribolium castaneum Herbst were identified using a NIR hyperspectral imaging system (700–1100 nm wavelength range) and a colour imaging system (Singh et al. 2009).
Uninfested mung bean kernels and kernels infested with different stages of C. maculatus were separated using a NIR hyperspectral imaging system within the wavelength region of 1000–1600 nm at 10-nm intervals.
Hyperspectral imaging is a newly emerging application of NIR spectroscopy where imaging technology is com- bined with spectroscopic knowledge. The advantages of the method are short, real-time imaging and high sensitivity, albeit its penetrating ability is weak. So, the imaging of the xylophagous insect (e.g. cerambycid and buprestid larvae) living in lignin content plant tissues may be difficult.
Bioluminescence imaging
Chemiluminescence is termed bioluminescence if a chemi- cal reaction leading to light emission occurs in a living organism. Bioluminescence occurs widely in marine verte- brates and invertebrates as well as in some species of fungus and microorganisms (bioluminescent bacteria) and also in terrestrial animals such as fireflies.
In general terms, the bioluminescence lies a chemi- cal reaction (oxidation) which involves a specific enzyme (luciferase, luciferin) and light-emitting molecules. Several luciferase requires ions as cofactors and ATP. Unlike lucif- erases, luciferins show little variance even on evolutionary scale. However, there is a plethora of luciferin/luciferase combinations and varies widely the corresponding chemical mechanisms, but molecular oxygen is required in all hitherto depicted systems.
Besides bioluminescence which was leading to a high quantum yield, there exists another type of emission termed spontaneous chemiluminescence also detectable in liv- ing organisms, including plants. The intensity of which is about three orders of magnitude lower than that of bioluminescence.
Due to its ultra-weak intensity, spontaneous chemilumi- nescence is invisible to the naked eye (Wilson and Hastings 1998). This ultra-weak biophoton emission seems to arise in response to biotic and abiotic stress and is surmised to stem from the endogenous production of metastable excited states as a result of spontaneous photon emission “reflecting” the oxidation status of the organism (Duran and Cadenas 1987).
As its name implies, this autoluminescence does not require any external excitation or administration of chemilumines- cence agents (Devaraj et al. 1997).
When hidden-lifestyle arthropod pest-induced damage is to be assessed, the spontaneous chemiluminescence enables the use of a monitoring system suitable for detecting this biotic stress factor (Fig. 6). Thus, though indirectly, informa- tion can be gathered as to the extent and physical location of the damage brought about by hidden-lifestyle arthropods.
In order to be able to assay the impact of the injury caused by the insect to the intact plant, it is a prerequisite for the physical symptoms to be manifested on the surface of plant tissues. It must be noted, however, the device used to detect photon emission change in the examined tissue cannot
“penetrate” it (unlike in confocal laser scanning microscopy applications)
Spontaneous photon emission has been measured in a wide range of plant samples, such as roots (Makino et al.
1996; Hossu et al. 2010), leaves (Kobayashi et al. 2007;
Winkler et al. 2009), seeds (Ohya et al. 2002) and isolated cells and organelles (Hideg and Inaba 1991; Rastogi and Pospisil 2010).
As the intensity of spontaneous plant autoluminescence is extremely low, detection of it requires very special and sensitive instrumentation. Usually, photomultiplier tubes and photon counting devices are employed for this purpose.
Besides charge-coupled devices (CCD), complementary metal oxide semiconductor (CMOS) sensors are used as image sensors. The common feature of these available tech- nologies is that photons are captured by a sensor, which will acquire a certain charge corresponding to the quantum of light impinging on the detector. Subsequently, these signals are amplified, filtered, transported and enhanced depending on the features of the actual hardware used. Coupled with suitable output interface and a lens system, these sensors can produce images.
Perhaps the most common devices in use are CCDs, which are very versatile sensors, e.g. through an effect dubbed “binning”. The combination of charges from adja- cent pixels can be achieved resulting in faster readout speeds and improved signal-to-noise ratios although at the expense of reduced spatial resolution.
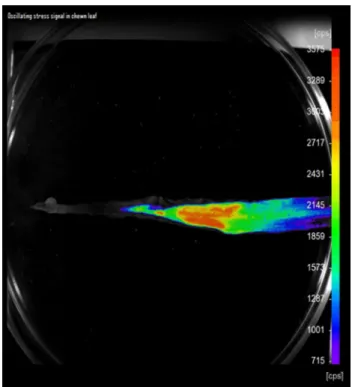
Fig. 6 Wireworm-induced (Col.: Elateridae) ultra-weak biophoton emission in a wheat leaf imaged 12 h following pest infection
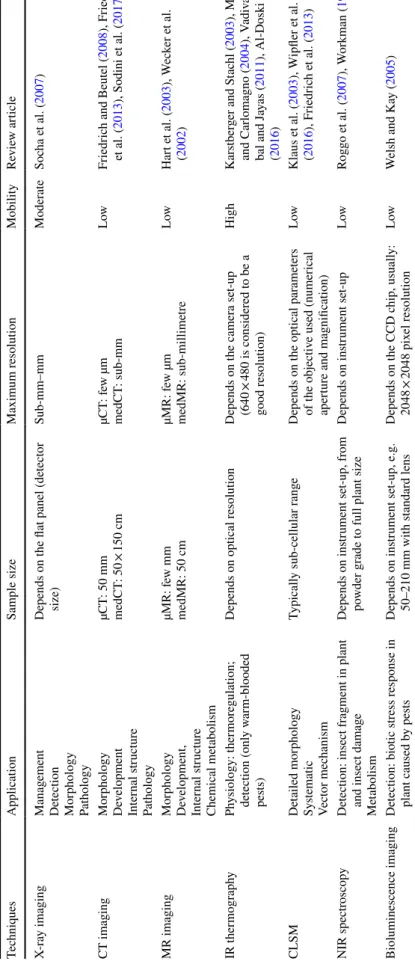
Table 2 Features and parameters of different in vivo imaging techniques in entomological practice and science TechniquesApplicationSample sizeMaximum resolutionMobilityReview article X-ray imagingManagement Detection Morphology Pathology
Depends on the flat panel (detector size)Sub-mm–mmModerateSocha et al. (2007) CT imagingMorphology Development Internal structure Pathology
µCT: 50 mm medCT: 50 × 150 cmµCT: few µm medCT: sub-mmLowFriedrich and Beutel (2008), Friedrich et al. (2013), Sodini et al. (2017) MR imagingMorphology Development, Internal structure Chemical metabolism µMR: few mm medMR: 50 cmµMR: few µm medMR: sub-millimetreLowHart et al. (2003), Wecker et al. (2002) IR thermographyPhysiology: thermoregulation; detection (only warm-blooded pests)
Depends on optical resolutionDepends on the camera set-up (640 × 480 is considered to be a good resolution)
HighKarstberger and Stachl (2003), Meola and Carlomagno (2004), Vadivam- bal and Jayas (2011), Al-Doski et al. (2016) CLSMDetailed morphology Systematic Vector mechanism
Typically sub-cellular rangeDepends on the optical parameters of the objective used (numerical aperture and magnification) LowKlaus et al. (2003), Wipfler et al. (2016), Friedrich et al. (2013) NIR spectroscopyDetection: insect fragment in plant and insect damage Metabolism
Depends on instrument set-up, from powder grade to full plant sizeDepends on instrument set-upLowRoggo et al. (2007), Workman (1999) Bioluminescence imagingDetection: biotic stress response in plant caused by pestsDepends on instrument set-up, e.g. 50–210 mm with standard lensDepends on the CCD chip, usually: 2048 × 2048 pixel resolutionLowWelsh and Kay (2005)
The detection of spontaneous autoluminescence emission offers a non-destructive manner, hence making it possible to assay subtle genetic changes upon plant defence responses including the repercussions of the infection brought about by hidden-lifestyle arthropod pests.
The disadvantage of this approach is that indirect infor- mation can be obtained as to the damage caused by the insect as emitted light detected via this technology can only be
“picked up” from the surface of the actual plant tissue to be imaged.
In biological systems bioluminescence imaging has proven useful for detecting protein–protein interactions and for monitoring the transcriptional and post-transcriptional regulation of specific genes (Welsh and Kay 2005).
In summary, bioluminescence imaging is suitable for monitoring some biotic stresses and has been mainly employed in plant pathogenic research (Cirvilleri et al. 2000, Xu et al. 2010).
Measurement of biophoton emission induced by biotic/
abiotic stresses including stress-adaptation processes trig- gered by pests is a powerful technique facilitating the check- ing of the actual stress status of plants; however, the tech- nique permits only indirect monitoring of hidden-lifestyle arthropods-derived plant injury.
Conclusions
Non-invasive imaging and spectroscopic methods are suit- able for the observation and studying of hidden-lifestyle arthropods. Therefore, the required biological, morpholog- ical information related to these insects can become only available with the use of appropriate techniques (Table 2.).
For several reasons it appears likely that non-invasive biological techniques will increasingly play a vital role in obtaining basic features of insect and understanding of arthropod pest–host interactions.
Novel technologies have greatly improved the detailed investigation of injured plants. The results provided addi- tional information about biological and ecological processes as to the hidden lifestyles of covertly developing insects. The careful investigation of morphological structures, related environmental conditions and hidden biological charac- teristics associated with the pest will become an essential precondition for understanding the functions of ecological relationships, which may have played an important role in the development of protection possibilities against herbivore pests in the next future.
Acknowledgments Open access funding provided by Kaposvár Univer- sity (KE). The authors wish to thank Szabolcs Terescsényi and Norbert Kertész, colleagues of Ltd. Kerterv, for providing them with an IR ther- mometer. The work was supported by the GINOP-2.2.1-15-2016-00021
and the EFOP-3.6.3-VEKOP-16-2017-00008 projects. The project is co-financed by the European Union, the European Regional Develop- ment Fund and the European Social Fund.
Compliance with ethical standards
Conflict of interest The authors declare that they have no conflict of interest.
Open Access This article is licensed under a Creative Commons Attri- bution 4.0 International License, which permits use, sharing, adapta- tion, distribution and reproduction in any medium or format, as long as you give appropriate credit to the original author(s) and the source, provide a link to the Creative Commons licence, and indicate if changes were made. The images or other third party material in this article are included in the article’s Creative Commons licence, unless indicated otherwise in a credit line to the material. If material is not included in the article’s Creative Commons licence and your intended use is not permitted by statutory regulation or exceeds the permitted use, you will need to obtain permission directly from the copyright holder. To view a copy of this licence, visit http://creat iveco mmons .org/licen ses/by/4.0/.
References
Al-Doski J, Mansor SM, Shafri HZB (2016) Thermal imaging for pests detecting—a review. Int J Agric For Plant 2:10–30
Bermadinger-Stabentheiner E, Stabentheiner A (1995) Dynamics of thermogenesis and structure of epidermal tissues in inflorescences of Arum maculatum. New Phytol 131(1):41–50
Bushberg JT, Seibert JA, Leidholdt EM, Boone JM (2002) The essen- tial physics of medical imaging. Lippincott Williams and Wilkins, Philadelphia
Callaghan P (1991) Principles of nuclear magnetic resonance micros- copy. Oxford University Press, Oxford
Chelladurai V, Kaliramesh SJ, Digvir SJ (2012) Detection of Calloso- bruchus maculatus (F.) infestation in mung bean (Vigna radiata) using thermal imaging technique. NABEC/CSBE 12:121 Chudek JA, Crook AME, Hubbard SF, Hunter G (1996) Nuclear mag-
netic resonance microscopy of the development of the parasitoid wasp Ventura canescens within its host moth Plodia interpunc- tella. Magn Reson Imaging 14(6):679–686
Cirvilleri G, Bella P, Catara V (2000) Luciferase genes as a marker for Pseudomonas corrugata. J Plant Pathol 82(3):237–241
Coulson RN, Witter JA (1984) Forest entomology. Wiley, New York Dale LM, Thewis A, Boudry C, Rotar I, Dardenne P, Baeten V et al
(2013) hyperspectral imaging applications in agriculture and agro- food product quality and safety control: a review. Appl Spectrosc Rev 48(2):142–159
Deans AR, Mikó I, Wipfler B, Friedrich F (2012) Evolutionary phe- nomics and the emerging enlightenment of arthropod systematics.
Ivertebr Syst 26(3):323–330
Devaraj B, Usa M, Inaba H (1997) Biophotons: ultraweak light emis- sion from living systems. Curr Opin Solid St M 2(2):188–193 DeWitt N (1988) Theory and practice of radiation thermometry. Wiley,
New York
Dowell FE, Throne JE, Wang D, Walker JE (1999) Identifying stored- grain insects using near-infrared spectroscopy. J Econ Entomol 92(1):165–169
Duran N, Cadenas E (1987) The role of singlet oxygen and triplet car- bonyls in biological systems. Rev Chem Intermed 8(2):147–187 Estevez AB (1959) Radiological method for determining borer infesta-
tion of fresh coffee beans. Revta Cafe Port 6(22):27–54
Friedrich F, Beutel RG (2008) Micro-computer tomography and a renaissance of insect morphology. Proc SPIE Int Soc Opt Eng.
https ://doi.org/10.1117/12.79405 7
Friedrich F, Matsumura Y, Pohl H, Bai M, Hörnschemeyer T, Beutel RG (2013) Insect morphology in the age of phylogenomics:
innovative techniques and its future role in systematics. Entomol Sci 17(1):1–24
Gassner G, Lohmann AB (1987) Combined proton NMR imaging and spectral analysis of locust embryonic development. Proc Natl Acad Sci 84(15):5297–5300
Gilberg M, Riegel C, Melia B, Leonard J (2003) Detecting subterra- nean termite activity with infrared thermography: a case study.
APT Bull 34(2/3):47
Goldman LW (2007a) Principles of CT and CT technology. J Nucl Med Technol 35(3):115–128
Goldman LW (2007b) Principles of CT: radiation dose and image quality. J Nucl Med Technol 35(4):213–225
Goldman LW (2008) Principles of CT: multislice CT. J Nucl Med Technol 36(2):57–68
Goodman BA, Gordon SC, Chudek JA, Hunter G, Woodford JAT (1995) Nuclear magnetic resonance microscopy as a non- invasive tool to study the development of lepidopteran pupae. J Insect Physiol 41(5):419–424
Hart AG, Bowtell RW, Köfckenberger W, Wenseleers T, Ratnieks FLW (2003) Magnetic resonance imaging in entomology: a critical review. J Insect Sci 3(5):1–9
Herman GT (2009) Fundamentals of computerized tomography:
image reconstruction from projections. Springer, Dordrecht Hideg E, Inaba H (1991) Biophoton emission (ultraweak photon emis-
sion) from dark adapted spinach chloroplasts. Photochem Photo- biol 53:137–142
Hill DS (1987) Agricultural insect pests of temperate regions and their control. Cambridge University Press, New York
Himmi SK, Yoshimura T, Yanase Y, Torigoe T, Akada M, Ikeda M, Imazu S (2018) Volume visualization of hidden gallery sys- tem of drywood termite using computed tomography: a new approach on monitoring of termite infestation. In: McLellan B (ed) Sustainable future for human security. Springer, Singapore, pp 61–68
Hoffmann N, Schröder T (2013) Potential of infrared thermography to detect insect stages and defects in young trees. J für Kulturp- flanzen 65(9):337–346
Hossu M, Ma L, Chen W (2010) Nonlinear enhancement of spontane- ous biophoton emission of sweet potato by silver nanoparticles. J Photochem Photobiol B Biol 99(1):44–48
Kamimura Y, Mitsumoto H (2011) The evolution of genitalia in the Drosophila melanogaster species group: a review on the studies of genital functions. Low Temp Sci 69:39–50
Karstberger G, Stachl R (2003) Infrared imaging technology and bio- logical applications. Behav Res Meth Ins C 35(3):429–439 Klaus AV, Schawaroch V (2006) Novel methodology utilizing confocal
laser scanning microscopy for systematic analysis in arthropods (Insecta). Integr Comp Biol 46(2):207–214
Klaus AV, Kulasekera VL, Schawaroch V (2003) Three-dimensional visualization of insect morphology using confocal laser scanning microscopy. J Microsc 212(2):107–121
Kobayashi M, Sasaki K, Enomoto M, Ehara Y (2007) Highly sensi- tive determination of transient generation of biophotons during hypersensitive response to cucumber mosaic virus in cowpea. J Exp Bot 58(3):465–472
Kroder S, Samietz J, Stabentheiner AS (2008) Dorn body tempera- ture of the parasitic wasp Pimpla turionellae (L.) (Hymenoptera) during host location by vibrational sounding. Physiol Entomol 33(1):17–24
Lee S, Brown RL, Monroe W (2009) Use of confocal laser scanning microscopy in systematics of insects with a comparison of fluo- rescence from different stains. Syst Entomol 34(1):10–14 Liu H, Lee SH, Chahl JS (2017) A review of recent sensing technolo-
gies to detect invertebrates on crops. Presic Agric 18:635–666 Lowe T, Garwood RJ, Simonsen TJ, Bradley RS, Withers PJ (2015)
Metamorphosis revealed: time-lapse three-dimensional imaging inside a living chrysalis. J R Soc Interface 10(84):20130304 Madding RP (1999) Emissivity measurement and temperature correc-
tion accuracy considerations. In: LeMieux DH, Snell JR (eds) Thermosense. International Society for Optics and Photonics, Bellingham, pp 39–47
Mahlein AK, Kuska MT, Behmann J, Polder G, Walter A (2018) Hyperspectral sensors and imaging technologies in phytopathol- ogy: state of the art. Ann Rev Phytopathol 56:535–558
Makino T, Kato K, Lyozumi H, Honzawa H, Tachiiri Y, Hiramatsu M (1996) Ultraweak luminescence generated by sweet potato and fusarium oxysporum interactions associated with a defense response. Photochem Photobiol 64(6):953–956
Manickavasagan A, Jayas D, White N (2008) Thermal imaging to detect infestation by Cryptolestes ferrugineus inside wheat ker- nels. J Stored Prod Res 44(2):186–192
Manuel D, Van Loo D, Masschaele B, Van den Bulcke J, Van Acker J, Cnudde V, Van Hoorebeke L (2014) Recent micro-CT scanner developments at UGCT. Nucl Intrum Methods B 324:35–40 Mapelli M, Greco F, Gussoni M, Consonni R, Zetta L (1997) Appli-
cation of NMR microscopy to the morphological study of the silkworm, Bombyx mori, during its metamorphosis. Magn Reson Imaging 15(6):693–700
Martel P, Belanger A (1977) Xerography, a new tool for in situ study of insects. Can Entomol 109(2):317–318
Martens H, Stark E (1991) Extended multiplicative signal correc- tion and spectral interference subtraction: new preprocessing methods for near infrared spectroscopy. J Pharm Biomed Anal 9(8):625–635
Mateus C, Mexia A, Duarte I, Pereira G, Tavares de Sousa M (2010) Evaluation of damage caused by bruchids (Coleoptera: Bruchi- dae) on peas (Pisum sativum L.). In: ISHS Acta Horticulturae 917: XXVIII international horticultural congress on science and horticulture for people (IHC2010): international symposium on plant protection. https ://doi.org/10.17660 /actah ortic .2011.917.15 Meissle M, Mouron P, Musa T, Bigler F, Pons X, Vasileiadis VP et al
(2009) Pests, pesticide use and alternative options in European maize production: current status and future prospects. J Appl Entomol 134:357–375
Meola C, Carlomagno GM (2004) Recent advances in the use of infra- red thermography. Meas Sci Technol 15(9):27–58
Metzner P (1962) The use of x-ray magnifying equipment for morpho- logical seed testing and similar biological tasks. Kulturpflanze 3:296–308
Michaelis T, Watanabe T, Natt O, Boretius S, Frahm J, Utz S et al (2005) In vivo 3D MRI of insect brain: cerebral develop- ment during metamorphosis of Manduca sexta. NeuroImage 24(2):596–602
Michels J (2007) Confocal laser scanning microscopy: using cuticular autofluorescence for high resolution morphological imaging in small crustaceans. J Microsc 227(1):1–7
Michels J, Gorb SN (2012) Detailed three-dimensional visualization of resilin in the exoskeleton of arthropods using confocal laser scanning microscopy. J Microsc 245(1):1–16
Milner M, Lee MR, Katz R (1950) Application of x-ray technique to the detection of internal insect infestation of grain. J Econ Ento- mol 43(6):933–935
Naes T, Isaksson T, Fearn T, Davies T (2002) A user friendly guide to multivariate calibration and classification. NIR Publications, Chichester
Ohya T, Yoshida S, Kawabata R, Okabe H, Kai S (2002) Biophoton emission due to drought injury in red beans: possibility of early detection of drought injury. Jpn J Appl Phys 41:4766
Palmer CM, Siebke K, Yeates DK (2004) Infrared video thermography:
a technique for assessing cold adaptation in insects. Biotechniques 37(2):212–214
Pawley JB (2006) Handbook of biological confocal microscopy.
Springer, Berlin
Perez-Mendoza JT, Rone J, Dowell F, Baker J (2003) Detection of insect fragments in wheat flour by near-infrared spectroscopy. J Stored Prod Res 39(3):305–312
Porca M, Ghizdavu I, Oltean I, Bunescu H (2003) Researches in arti- ficial infestation condition and storage condition of some bean cultivars at bean weevil damage, Acanthoscelides obtectus Say. J Cent Eur Agric 4(1):31–38
Rastogi A, Pospisil P (2010) Effect of exogenous hydrogen peroxide on biophoton emission from radish root cells. Plant Physiol Biochem 48(2–3):117–123
Richards CS, Simonsen TJ, Abel LR, Hall MJ, Schwyn DA, Wicklei M (2012) Virtual forensic entomology: improving estimates of mini- mum post-mortem interval with 3D micro-computed tomography.
Forensic Sci Int 220(1–3):251–264
Ridgway C, Chambers J (1996) Detection of external and internal insect infestation in wheat by near-infrared reflectance spectros- copy. Sci Food Agric 71:251–264
Roberts CA, Workman J, Reeves JB (2004) Near-infrared spectroscopy in agriculture. American Society of Agronomy, Inc., Madison Roggo Y, Chalus P, Maurer L, Lema-Martinez C, Edmond A, Jent
N (2007) A review of infrared spectroscopy and chemomet- rics in pharmaceutical technologies. J Pharm Biomed Anal 44(3):683–700
Schawaroch V, Li SC (2007) Testing mounting media to eliminate background noise in confocal microscope 3-D images of insect genitalia. Scanning 29(4):177–184
Singh CB, Jayas DS, Paliwal J, White NDG (2009) Detection of insect- damaged wheat kernels using near-infrared hyperspectral imaging.
J Stored Prod Res 45(3):151–158
Skibbe U, Christeller JT, Eccles CD, Laing WA, Callaghan PT (1995) Phosphorus imaging as a tool for studying the pH metabolism in living insects. J Magn Reson, Ser B 68(3):393–398
Socha JJ, Westneat MW, Harrison J, Waters JS, Lee W (2007) Real- time phase-contrast x-ray imaging: a new technique for the study of animal form and function. BMC Biol 5(1):6
Sodini N, Dreossi D, Giordano A, Kaiser J, Zanini F, Zikmund T (2017) Comparison of different experimental approaches in the tomographic analysis of ancient violins. J Cult Herit 27S:S88–S92 Stabentheiner A, Schmaranzer S (1987) Thermographic determination
of body temperatures in honey bees and hornets: calibration and applications. Thermology 2:563–572
Stabentheiner A, Kovac H, Schmaranzer S (2002) Honeybee nestmate recognition: the thermal behaviour of guards and their examinees.
J Exp Biol 205:2637–2642
Stabentheiner A, Kovac H, Hetz SK, Kafer H, Stabentheiner G (2012) Assessing honeybee and wasp thermoregulation and energetics—
new insights by combination of flow-through respirometry with infrared thermography. Thermochim Acta 534:77–86
Staedler YM, Masson D, Schönenberger J (2013) Plant tissues in 3d via x-ray tomography: simple contrasting methods allow high resolu- tion imaging. PLoS ONE 8(e75295):1–9
Stüben M, Linsenmair KE (2008) Advances in insect preparation:
bleaching, clearing and relaxing ants (Hymenoptera: Formicidae).
Myrmecol News 12:15–21
Taylor FW, Wagner FG, McMillin CW, Morgan IL, Hopkins FF (1984) Locating knots by industrial tomography. A feasibility study. For Prod J 34(5):42–46
Vadivambal R, Jayas DS (2011) Applications of thermal imaging in agriculture and food industry—a review. Food Bioprocess Technol 4(2):186–199
Verdú JR, Alba-Tercedor J, Jiménez-Manrique M (2012) Evidence of different thermoregulatory mechanisms between two sympa- tric scarabaeus species using infrared thermography and micro- computer tomography. PLoS ONE 7(3):e33914. https ://doi.
org/10.1371/journ al.pone.00339 14
Vilar HD (1966) Radiological examination of cashew-nuts for the assessment of their phytosanitary condition. Estud Agron Lisboa 7:27–34
Watanabe T, Schachtner J, Krizan M, Boretius S, Frahm J, Michaelis T (2006) Manganese-enhanced 3D MRI of established and disrupted synaptic activity in the developing insect brain in vivo. J Neurosci Methods 158(1):50–55
Wecker S, Hörnschemeyer T, Hoehn M (2002) Investigation of insect morphology by MRI: assessment of spatial and temporal resolu- tion. Magn Reson Imaging 20(1):105–111
Welsh DK, Kay SA (2005) Bioluminescence imaging in living organ- isms. Curr Opin Biotechnol 16(1):73–78
Wilson T, Hastings JW (1998) Bioluminescence. Ann Rev Cell Develop Biol 14:197–230
Williams P, Norris K (2001) Near-infrared technology in the agricul- tural and food industries. American Association of Cereal Chem- ists Inc, Minnesota
Winkler F, Kienast Y, Fuhrmann M, Von Baumgarten L, Burgold S, Mitteregger G, Kretzschmar H, Herms J (2009) Imaging glioma cell invasion in vivo reveals mechanisms of dissemination and peritumoral angiogenesis. Glia 57(12):1306–1315
Wipfler B, Pohl H, Yavorskaya M, Beutel RG (2016) A review of meth- ods for analysing insect structures—the role of morphology in the age of phylogenomics. Curr Opin Insect Sci 18:60–68
Wolfe WL, Zissis GJ (1993) The infrared handbook. Office of Naval Research, Washington, DC
Workman JJ (1999) Review of process and non-invasive near-infra- red and infrared spectroscopy: 1993–1999. Appl Spectrosc Rev 34(1–2):1–89
Xu X, Miller SA, Baysal-Gurel F, Gartemann K, Eichenlaub R, Rajashekara G (2010) Bioluminescence imaging of Clavibacter michiganensis subsp. michiganensis infection of tomato seeds and plants. Appl Environ Microbiol 76(12):3978–3988
Zhekova E (2017) Evaluation of alfalfa germplasms for productivity and tolerance to alfalfa root longhorn beetle (Plagionotus floralis Pall.: Coleoptera, Cerambycidae). Bulg J Crop Sci 54:28–40 Zucker RM (2006) Whole insect and mammalian embryo imaging with
confocal microscopy: morphology and apoptosis. Cytometry Part A 69(11):1143–1152
Publisher’s Note Springer Nature remains neutral with regard to jurisdictional claims in published maps and institutional affiliations.