51
Segmentation of Multiple Organs in Computed Tomography and Magnetic Resonance Imaging Measurements
A. Kriston1, V. Czipczer1,2, A. Manno-Kovács1,2, L. Kovács1, Cs. Benedek1 and T. Szirányi1
1 Hungarian Academy of Sciences, Institute for Computer Science and Control/Machine Perception Research Laboratory, Budapest, Hungary
2 Pázmány Péter Catholic University, Faculty of Information Technology and Bionics, Budapest, Hungary
Keywords: Medical image segmentation, Multi-organ segmentation, 3D data representation
Abstract: The segmentation and visual representation of human organs on medical images with different modalities is of great importance in the study of medical analysis. In order to perform multi-organ segmentation on medical image sets, deep learning based methods were tested on publically available datasets. Moreover, custom developed algorithms were proposed to detect and segment specific organs, like liver and kidney. The algorithms and related results presented in this study are aimed to be implemented in a specific virtual reality hardware which will be used during physician-patient meetings to improve communication and also for teaching purposes of medical students.
Introduction
Segmentation of medical images is crucial for quantitative medical analysis and for visualizing organs of the human body. Manual segmentation is possible for an individual image and might be applied for small datasets, however it is not the way to process large dataset, where a single image volume of a human organ consists of hundreds or even thousands of images. The need for reliable and fast image segmentation algorithms is really important [1]. Although physicians have good understanding and able the perform diagnosis relying on their visual interpretation of grayscale images, patients face difficulties to understand those complex medical images. Segmentation and three-dimensional representation of patient’s organs may facilitate the general understanding. The study presented in this paper aims to further advance the field of digital medical image processing and visualization used for medical teaching purposes and to improve the relation and communication between patients and physicians. During the current work different deep learning based multi- organ segmentation algorithms were tested on available datasets. Traditional image segmentation techniques like, region growing and active contour based methods were tried as well to segment liver and kidney.
Datasets
A common practice in medical diagnosis processes is to perform Computed Tomography (CT) and Magnetic Resonance (MR) imaging about patients to reveal diseases. In order to test image segmentation algorithms CT and MR volumes with and without contrast enhancement were acquired from various datasets. Different available databases, namely VISCERAL, BRATS and SLIVER07, as well as new hand labeled samples provided by the Medical School of University of Pécs were used for performing multi-organ image segmentation. The collected databases include samples of different MR acquisitions types, like Flair, T1, T1c, T2, which were used alone or combined as input for the algorithms. The volumes were in nifty (.nii) and MHA (.mha) file formats, which are common types for medical imaging purposes. To process the images in the CT and MR volumes, Matlab, C++ and Python codes were created.
Deep learning based image segmentation
The focus of the deep learning based image segmentation study was on testing the different methods and measure their performance on the acquired datasets. We have been looking for convolutional networks with various segmentation and classification capabilities of the organs. It is promising for these methods or similar approaches that e.g. in the case of [2], 281 labeled contrast CT scans were sufficient for teaching (460-1177 slice, 512x512 pixels, 0.5-1mm resolution), and for [3] 20 + 59 images (contrast abdominal CT, 512x512 pixels, 426 slice, 0.6-0.8mm resolution [4]) were sufficient. Such type of algorithms need a well-labeled set of ground truth data sets that are relevant to the particular segmentation or classification task. Such publicly available data sets are e.g. the BRATS [5] (cerebral tumors) and VISCERAL [4] (upper / abdominal, abdominal
52 organs). The nets used during the study were the two and three dimensional version of the U-Net and the WT- Net. The U-Net 2D network was tested on the VISCERAL data set for multiple organs (liver, pancreas, kidney) and on the BRATS which has brain volumes. We first separated the volumes containing individual organs, then randomly 10% of them were isolated for testing and the remainder (80-20%) was used for train - validation. The results are presented in Table 1.
Table 1. The caption format for the table is this, please use plain table without colors and other design Dice Specificity/TNR Sensitivity/recall precision
2D U-Net
liver 0.802679 0.99813 0.770739 0.89054
pancreas 0.305916 0.997472 0.32681 0.371207
kidney 0.651467 0.993629 0.913739 0.555003
brain 0.534425 0.999247 0.462648 0.761543
WT-Net
brain 0.880051007466 0.995697035725 0.902059385208 0.871988 3D U-Net
brain 0.606450440436 0.957828332746 0.799461787508 0.564523080524
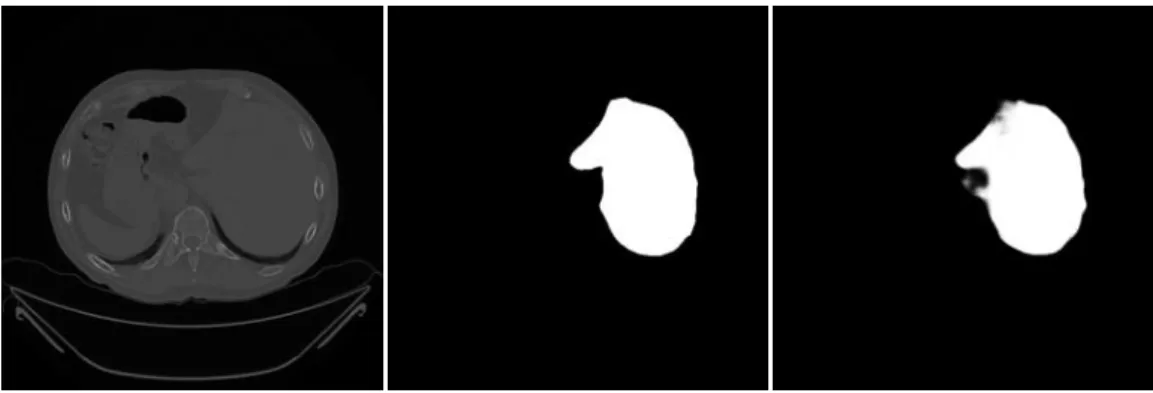
A representative CT slice is shown by Fig. 1. Experts drawn contours of the liver then binary masks were generated that are used for training of the deep learning network. Expert defined label and corresponding prediction is shown by the figure.
Fig. 1 Example slice of a CT volume (left) of the Visceral dataset and the corresponding ground truth of the liver (middle) and resulted prediction by U-net.
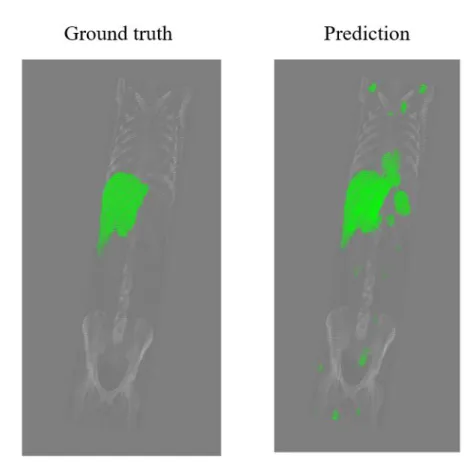
Fig. 2 shows automatic liver segmentation result on a CT volume found in the VISCERAL database. The segmentation was performed using the 2D U-Net. Green color indicates the liver on both the ground truth and prediction images. We can see that prediction fails in some cases and the algorithm falsely labels pixels as liver too even further from abdominal region.
53
Fig. 2 Automatic segmentation on the Visceral dataset using U-net.
Individual slices of the segmented liver part is presented by Fig. 3. Different views show the shape of the liver.
One can observe some segmentation faults that might be filtered by post-processing. Overall, the segmentation on this particular dataset seemed to be right.
Fig. 3 Reconstruction of 3D point cloud of the automatically detected liver on a volume of the Visceral dataset. Figure represents multiple views.
Traditional image segmentation
When applying traditional image segmentation methods, one has to develop task specific algorithms which is more sensitive to input data and alterations in the properties of the organ in interest. On the other hand, if the algorithm is well tuned for the task, it is able to deliver very accurate results with low computation costs.
Within this study a liver segmentation algorithm was developed using the combination of Chan-Vese active contour algorithm and Region Growing. The result is presented by Fig. 4.
54
Fig. 4 Liver segmentation result by a custom developed Active Contour and Region Growing based algorithm. In the 1st row the segmentation of individual slices is presented (white is ground truth while yellow border is segmentation result) and in 2nd row 3D
ground truth is compared to rendered 3D segmentation result.
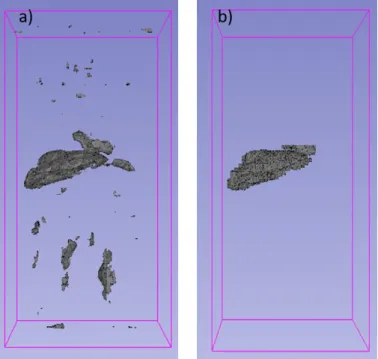
Applying anatomical constraints to the output of the deep learning based segmentation, presented by Fig. 2, one can filter the parts which were falsely labeled as liver, see Fig. 5.
Fig. 5 a) is the result of U-Net liver segmentation; b) is the anatomically filtered a).
Chan-Vese active contour algorithm [6] was also implemented in python and used for kidney segmentation slice by slice on MR (T1) datasets. On this type of MR imaging, kidney has relative high intensity compared to its surrounding. The algorithm is based on energy minimization problem taking into account the mean intensity inside and outside the initial curve, and the curvature of the region. Problem might arise in
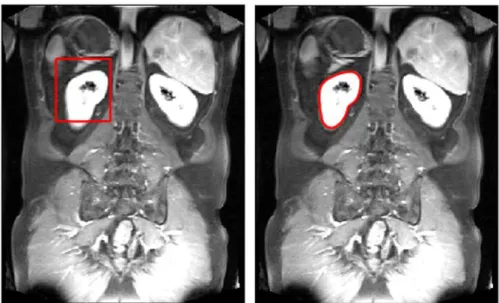
55 segmentation when organs have similar intensity values, resulting false separation. In that case, the algorithm could be tuned with a parameter to better judge phases with similar intensity values. The location of the initial rectangle is chosen based on prior knowledge, then algorithm runs automatically. Fig. 6 demonstrates the initial state and the final shape of the evolved curve around kidney.
Fig. 6 Application of Chan-Vese active contour algorithm on MRT1 images. Initial rectangle is placed close to kidney, then curve evolves around kidney based on energy minimization principles.
The result of the active contour segmentation on two datasets are demonstrated by Fig. 7. The algorithm is relatively fast and accurate if initial rectangle is well located and background and foreground have separable intensity. The algorithm is not sensitive to noise thus no noise filtering was applied. In order to increase the robustness of the algorithm, anatomical constraints are needed to find a right location for the initial curve.
Fig. 7 3D rendered images of the 2D kidney segments resulted by the active contour algorithm. The two rows show the kidneys of two different patients. Both sides belong to the same kidney, only perspectives are different.
56 Conclusions
Automatic deep learning based image segmentation algorithms are quite powerful for multi-organ segmentation in case of sufficient amount of precisely labeled data. When there is no anatomical information about the organ which is aimed to be segmented, convolutional networks are favorably used thanks to their robustness. Supposing we have prior information about the location of the organ of interest, then traditional image segmentation algorithms suit well the tasks, because of their simplicity and fast running time.
Acknowledge
This work was supported by the “zMed” project (grant GINOP-2.2.1-15-2017-00083), and by the National Research, Development and Innovation Fund (grants NKFIA K-120233, K-120499, KH-125681 and KH- 126688). Cs. Benedek also acknowledges the support of the Janos Bolyai Research Scholarship of the Hungarian Academy of Sciences
REFERNCES
[1] R. Gauriau, R. Ardori, D. Lesage and I. Bloch, „Multiple template deformation application to abdominal organ segmentation,” in IEEE, New York, NY, USA, 2015.
[2] H. R. Roth, H. Oda, Y. Hayashi, M. Oda, N. Shimizu, M. Fujiwara, K. Misawa és K. Mori, „Hierarchical 3D fully convolutional networks for multi-organ segmentation,” arXiv:1704.06382, 2017.
[3] V. Zografos, A. Valentinitsch, M. Rempfler, FedericoTombari and B. Menze, „Hierarchical multi-organ segmentation without registration in 3D abdominal CT images,” in International MICCAI Workshop on Medical Computer Vision, 2016.
[4] V. A. 3, „http://www.visceral.eu/closed-benchmarks/anatomy3/,” [Online].
[5] B. Menze, A. Jakab, S. Bauer, J. Kalpathy-Cramer, K. Farahani, J. Kirby, Y. Burren, N. Porz, J. Slotboom, R. Wiest and et al. „The Multimodal Brain Tumor Image Segmentation Benchmark (BRATS),” IEEE Transactions on Medical Imaging, Institute of Electrical and Electronics Engineers, p. 33, 2014.
[6] T. F. Chan and L. A. Vese, „Active Contours Without Edges,” IEEE Transactions on Image Processing,10 (2), 2001.