Automatic liver segmentation on CT images combining region-based techniques and
convolutional features
Vanda Czipczer2,1, Andrea Manno-Kovacs1,2
1Machine Perception Research Laboratory, Institute for Computer Science and Control (MTA SZTAKI) H-1111 Kende u. 13-17 Budapest, Hungary, Email:{vanda.czipczer, andrea.manno-kovacs}@sztaki.mta.hu
2P´azm´any P´eter Catholic University, Faculty of Information Technology and Bionics H-1083, Pr´ater utca 50/A, Budapest, Hungary
Abstract—Precise automatic liver segmentation plays an im- portant role in computer-aided diagnosis of liver pathology.
Despite many years of research, this is still a challenging task, especially when processing heterogeneous volumetric data from different sources. This study focuses on automatic liver segmen- tation on CT volumes proposing a fusion approach of traditional methods and neural network prediction masks. First, a region growing based method is proposed, which also applies active contour and thresholding based probability density function.
Then the obtained binary mask is combined with the results of the 3D U-Net neural network improved by GrowCut approach.
Extensive quantitative evaluation is carried out on three different CT datasets, representing varying image characteristics.
The proposed fusion method compensates for the drawbacks of the traditional and U-Net based approach, performs uniformly stable for heterogeneous CT data and its performance is com- parable to the state-of-the-art, therefore it provides a promising segmentation alternative.
Index Terms—liver segmentation, medical image segmentation, convolutional neural networks, handcrafted features
I. INTRODUCTION
Liver segmentation is still a challenging task, due to the variability of the organ’s shape and size, similar intensity values among neighboring organs and tissues, such as the heart, the stomach, the kidneys and the abdominal wall. On the other hand, the liver has a crucial role in metabolic processes, therefore it is essential to perform a fast and accurate diagnosis in case of any disease. Moreover, with the improvement of different medical imaging techniques, the focus is placed on the application of non-invasive diagnostic methods, before performing a painful, invasive examination (like biopsy). The liver might have different pathologies, out of which liver cancer is the fifth most commonly occurring cancer in men and the ninth most commonly occurring cancer in women, with over 840,000 new cases in2018world-wide, according to the World Cancer Research Fund. Therefore, a continuous effort is required to develop efficient and automatic segmenta- tion methods, which may support the diagnostic process and facilitate the treatment decision-making.
Nowadays, Computed Tomography (CT) is a widely used, modern, non-invasive imaging technique for liver-related dis- ease diagnosis. There are many approaches, also available
in clinical applications, for the detection of the liver using CT data, which requires varying amount of operator input.
Automatic methods do not depend on the operators skill and these approaches are not as time-consuming as the interactive ones. Semi-automatic methods are partly interactive methods because they require user interaction throughout their uti- lization. CT scans are preferred because of their beneficial image characteristics, however, different medical institutions may have different CT scanners, therefore, the developed segmentation methods should be prepared to handle variations in image features as well.
Besides handling heterogeneous data, our aim was to de- velop a method which is able to handle previously unseen scan types reliably. In real life cases, there might not be enough data with annotated ground truth, to build a shape model or to perform a thorough training process, therefore we propose to fuse feature-based and learning-based techniques.
Previously, different segmentation approaches were pro- posed for liver segmentation [1]. Earlier works mainly in- cluded pixel-based methods, such as [2], [3], based on local and global thresholding, region growing, atlas-based voxel classification or edge detection. A statistical, voxel labeling method was introduced in [2] which is based on feature extraction, applying a multi-atlas registration procedure. The advantage of pixel-based methods is that anatomical infor- mation can be built into the process. It can be applied as an atlas or a priori knowledge as well. In our work, we applied region growing, similarly to [3]. Region growing is shown to achieve good performance in the segmentation, however it is sensitive to the initial seed selection, therefore a sophisticated pre-processing is required. Graph-based methods are also introduced for liver segmentation, [4] uses supervoxel- based graph cuts.
Beside pixel-based techniques, the other main group con- tains structure-based methods, including shape-based models [5], [6], however they require a large training dataset to build the model. As it was previously mentioned, our aim was to build an approach, which is also appropriate for small data sets, therefore, concerning feature-based methods, we preferred pixel-based approaches throughout our work.
Lately, learning-based techniques are often used for seg- mentation purposes [7]–[10], however they require a large amount of training data and usually perform more efficiently on homogeneous inputs (i.e., the statistics of the unknown samples should match that of the training dataset). These bottom-up segmentation models usually do not integrate top- down, context-based (i. e. anatomic) information and mainly concentrate on low-level features. In a very recent work [11], deep belief networks are introduced for liver segmentation. For segmentation of medical images, convolutional neural network (CNN) models are widely used, since CNNs can take 2D or 3D images as input and they are designed to better utilize spatial and configural information. The 3D U-Net [8] is often applied for volumetric medical data segmentation, extending the traditional U-Net representation [7] into 3D. The model can handle complex segmentation cases efficiently, therefore it is also applied in our work.
In this paper we propose a fusion method, which com- bines regional-based techniques and convolutional features.
The method starts with preprocessing, including determining the abdominal region and thresholding based on probability density function. Then the combination of active contour and region growing methods are applied on the preprocessed image. After some postprocessing steps, the result is combined with the 3D U-Net’s prediction mask. Before the fusion, the prediction masks are improved by removing most of the false positive voxels using the GrowCut method [12].
The quantitative evaluation for the fusion method is per- formed on 3 different databases, including 2 publicly avail- able, VISCERAL [13] and SLIVER [1] databases, and also on a private database. The results show that the proposed fusion method is uniformly efficient on different databases and achieves similar performance results when compared to the state-of-the-art on the publicly available SLIVER database.
II. DEVELOPED SEGMENTATION METHODS
A. Liver segmentation using traditional techniques
1) Abdominal region: As a first step, the region of the abdomen is obtained from the CT volume images to remove several non-abdominal slices. This step is necessary, since our presumption is that the middle slice of the volume is going to include liver pixels. This presumption does not hold for every original volume. For the extraction of the abdominal region, maximum intensity projection (MIP) and thresholding are used, inspired by [4].
2) Image preprocessing: Since the obtained abdominal slices have low intensity variance among organs, preprocessing is required. The actual slice is rescaled based on its maximum value of Hounsfield unit and stored in a 16-bit image (Figure 2(a)). The noise is then reduced by median filtering, since it preserves edges.
Our presumption at this point is that the liver is located in the upper half of the image. To make sure that this presumption is valid in every case (sometimes the input data is rotated), we automatically examined the location of the spine in the axial MIP image of the bone mask. If the spine was on the left
(a) (b)
Fig. 1. Probability density functions of pixel intensity values: (a) Low contrast; (b) High contrast type.
side of the image, the liver was located in the lower half of the image, so we had to rotate the volume with 180degrees.
After this step, 2/3 of the lower right quarter is removed, since this part of the image does not contain liver pixels.
The image is then thresholded using probability density function (PDF). The density estimation is based on a normal kernel function and is evaluated at equally-spaced points. The input of the estimation is the upper left quarter of the image (a sample image is shown in 2(a) with a red rectangle outlining the upper left quarter), which contains most of the voxels of the liver, excluding the pixels with lower intensity than500.
One of the PDF peaks is expected to represent the intensity range of the liver.
By analyzing the probability density function of the ab- dominal regions, the regions can be classified as high contrast (Figure 1(b)) or low contrast type (Figure 1(a)), as it was also stated in [4]. The high contrast images have two or more peaks in their probability density function, while in the low contrast images only one peak is detected. For the high contrast images, our analysis showed that the second peak represents the intensity range of liver. The lower and upper boundary of the threshold are determined by the location and the width (half-height) of the proper peak, except in the cases when the half height is larger than 7000, then half-prominence of the peak is used. This thresholding method extracts the liver area and removes most of the pixels of other organs (Figure 2 (b)). This step is followed by cavity filling and morphological opening (Figure 2 (c)).
(a) (b) (c)
Fig. 2. Preprocessing of the input image: (a) Rescaled image; (b) PDF-based thresholded image; (c) Preprocessed image.
3) Combination of region growing and active contour:
In this proposed segmentation step, first, the combination of Chan-Vese active contour method [14] and morphological operations are applied to further simplify the input image. The initialization mask for the active contour is a simple rectangle
(for example the area defined by the red rectangle on Figure 2(a)) whose location is based on the orientation of the skeleton.
The iteration number is set to be large, since in some cases the active contour does not reach the contour of the liver.
Then, we select the largest connected component from the detection result and we keep the original intensity over this region, setting the others to zero. This modified intensity image will serve as a force field to drive the region growing process.
To make the established method automatic, the traditional active contour’s energy function [15] is calculated on the center slice of each axis in the filtered abdominal region:
Eimage =wlineEline+wedgeEedge+wtermEterm. Since in the abdominal region the liver is the largest organ, we expect to find the pixel with maximum intensity of the energy image located in the liver. From this seed point, 2D region growing is applied on the middle slice. The region is iteratively grown by comparing all unallocated neighboring pixels to the region.
The similarity measureδi(x)for pixel xon slicei is defined as the difference between the intensity value of x pixel and the grown region’s R mean intensity and it is calculated for each neighboring pixel:
δi(x) =|Ii(x)−mean[I(Ri)]|, (1) whereIi(x)is the intensity value of the currentxneighbor- ing pixel of theith slice andmean[I(Ri)]is the mean intensity of the R grown region in the ith slice. The pixel with the smallest distance measured is added to the grown region. This process stops when the intensity difference between region mean and new pixel becomes larger than a certain threshold (τ). For the first layer (i = 1), the τ is automatically set to the difference of the upper and lower boundary of the threshold, determined in the PDF-based preprocessing step.
For subsequent layers, τ is calculated iteratively, using the standard deviation σ of the region growing result’s intensity in the previous ith slice:
τi+1= 2.5∗σ[I(Ri)] (2) On the obtained liver mask of the middle slice, the next external force is calculated, and the pixel with the maximum value will be the seed point for the region growing in the next slice iteratively. By performing this iterative region growing process on each axis, we receive 3 matrices of label maps, from which we generate a mask for liver by summing the 3 matrices. In the final binary 3D liver mask, a voxel will have 1 value, where at least one of the matrices’ voxels had the value of 1 (logical OR function of the 3 matrices voxelwisely).
4) Postprocessing: The obtained region growing result may contain holes and falsely detected tissues from neighboring organs. A cavity filling step is applied to the image and mor- phological opening operation with a sphere structure element is used to smooth the contour of the object and to eliminate thin protrusions. Lastly, the largest connected component is saved as the binary mask of the liver.
B. Fusion method
In order to achieve better results, we attempt to fuse the proposed algorithm with a convolutional neural network’s (CNN) prediction mask. We carried out the experiments with the 3D U-net [8] on CT and Magnetic Resonance Imaging volumes. The obtained prediction masks were not very accu- rate, containing high numbers of false positives scattered along the body. By applying top-down, anatomical information, the prediction masks were updated by removing the false positive detections outside the abdominal region and by only keeping the largest connected component. Figure 3 represents a typical prediction map before and after the update.
(a) (b)
Fig. 3. 3D image of the prediction mask, (a) Before the update, (b) After removing most of the false positive pixels.
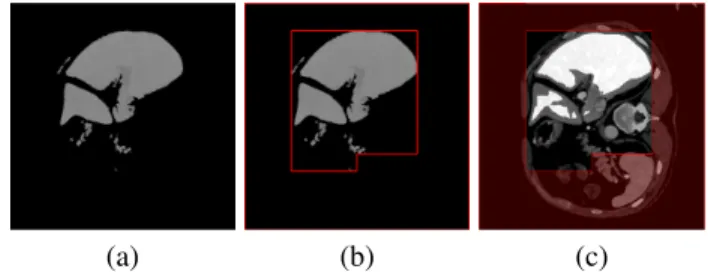
In order to further increase the accuracy of the prediction masks, the GrowCut method [12] is used. This method’s advantage is that it only segments the marked object and dis- connected, similarly colored, unmarked objects are considered as background. For the GrowCut method, the initial foreground label is the updated prediction mask (Fig. 3(b)) eroded with a sphere structuring element (radius = 5) (shown as bright white in Fig. 4(c)). The background label is set based on the preprocessed image (Fig. 2(c)), which is further processed by keeping only the largest connected component (Fig. 4(a)).
Then a bounding box is created around the remaining objects of the preprocessed image (red in Fig. 4(b)), which will separate the background (pale red in Fig. 4(c)) from the unlabeled part of the image. The GrowCut method is applied with these labels on the rescaled image (Fig. 4(c)).
(a) (b) (c)
Fig. 4. The process of labeling for GrowCut method: (a) Largest connected component of preprocessed image; (b) The separating frame shown as red;
(c) Labels of the GrowCut method, pale red indicates the background label, bright white represent the foreground label.
Then the result of GrowCut method (P M) is fused with the result of the previously described liver segmentation method (M) and after some morphological operations, we achieved better results. The fusion of the results has the following form:
LiverM ask=δ×M+ (1−δ)×P M, (3) whereδ= 0.5 was applied.
The resulting liver mask may include falsely detected heart pixels, as the upper part of the liver, located close to the heart, has very similar image characteristics. As a postprocessing step, a previously introduced liver-heart separation step [3] was used. The original method was based on the delineation of the lung, which was improved by exchanging the time-consuming 3D region growing with binary image operations. We start by determining the air-filled parts of the 3D abdominal re- gion, applying binary thresholding between [−1024,−300]
HU (based on our experiments) (Fig. 5(b)). Then we erase all the connected components of the obtained 3D binary volume, which are: (i) connected to any of those volume borders that the lungs are not connected to (red in Fig. 5(c)); (ii) not connected to any volume borders (yellow in Fig. 5(c)). This way we can produce a much faster segmentation of the lung, than the proposed technique. Based on the lung mask, a surface is defined, which connects the two lobes and separates the heart (above the surface) and the liver (under the surface) [3].
(a) (b)
(c) (d)
Fig. 5. Illustration of the lung segmentation on a sample coronal slice:
(a) Original image; (b) Obtained binary mask of air-filled parts; (c) Filtered regions (yellow and red blobs); (d) Result of the segmentation.
III. EXPERIMENTAL EVALUATION
The segmentation performance of the proposed algorithms were evaluated by comparing with manual segmentations done by experts and calculating 10different measures, widely used in the state-of-the-art: Precision, True Positive Rate (TPR), False Positive Rate (FPR), Accuracy, Dice Similarity Coeffi- cient (DSC), Volumetric Overlap Error (VOE) [%], Relative Volume Difference (RVD) [%], Average Symmetric Surface Distance (ASSD) [mm], Root Mean square symmetric Surface Distance (RMSD) [mm], and Maximum symmetric surface Distance (MaxD) [mm] [4].
A. Evaluation of the proposed traditional method
The traditional method, introduced in Sec. II-A, was tested on several samples with various shapes, provided by the SLIVER dataset [1] including expert segmentations for 20 abdominal CT scans (SLIVER train dataset). The number
of slices, in-plane resolution, and inter-slice resolution varied between64and394,0.58and0.81mm, and0.7and5.0mm, respectively.
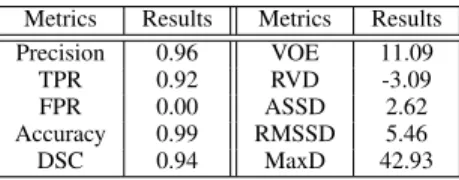
TABLE I
QUANTITATIVE RESULTS ON THESLIVERDATASET FOR THE PROPOSED TRADITIONAL ALGORITHM.
Metrics Results Metrics Results
Precision 0.96 VOE 11.09
TPR 0.92 RVD -3.09
FPR 0.00 ASSD 2.62
Accuracy 0.99 RMSSD 5.46
DSC 0.94 MaxD 42.93
As Table I shows, the proposed traditional approach achieved quite good results on the SLIVER database, since the average DSC index is 94%, the FPR is0% on average, and the FNR=1-TPR is lower than10%. These last two metrics are preferred to be as low as possible (lower than5%) considering the liver segmentation and consequent treatments.
Furthermore, precision and accuracy imply that we have an almost perfect segmentation with values of 96% and 99%, respectively. However, our proposed method still needs some improvement. Large distance between the result and manual segmentation can be observed in terms of ASSD, RMSSD, and MaxD. This occurs occasionally because of the connection of the liver and some neighboring tissues and usually because of the undersegmentation happening at the vessels next to the boundary of liver. Relative volume difference (RVD) shows that on average our segmentations are 3% smaller than the reference, which is also caused by not segmenting the vessels next to boundary.
B. Evaluation of the fusion method
To increase the performance of the segmentation, we at- tempted to fuse the proposed traditional method with neural networks (Sec. II-B). As a first step, the 3D U-Net [8] was trained and tested on a mixed dataset (mixed DS), then it was also cross-validated on the SLIVER database. The mixed DS included 60 volumes from the VISCERAL [13] and the SLIVER databases, from which6CT volumes were randomly chosen for testing, including2SLIVER,2 VISCERAL and2 contrast enhanced VISCERAL scans. The remaining 54 CT volumes were used for training.
The obtained prediction masks were updated by removing false positive voxels on the non-abdominal slices, and keeping the largest connected component. Table II shows that the added anatomical information improved the results signifi- cantly, however this performance on the SLIVER database (second column in Table II) is still lower compared to the traditional method (Table I).
The comparison of the traditional, updated U-Net and the fusion methods are included in Table III for two different databases: the mixed DS and a private database. The private database included 8 abdominal CT scans with ground truth data. The results show that in case of large amount of training data (Mixed DS), the updated prediction masks overperform
TABLE II
QUANTITATIVE RESULTS ON THESLIVERDATASET AND ON THE MIXED DATASET(DS)FOR THE3D U-NET.
U-Net updated U-Net U-Net updated U-Net SLIVER SLIVER Mixed DS Mixed DS
Precision 0.09 0.93 0.58 0.95
TPR 0.09 0.78 0.68 0.96
FPR 0.05 0.00 0.02 0.00
Accuracy 0.90 0.98 0.97 1.00
DSC 0.08 0.81 0.63 0.95
the traditional and the fusion method. Also, it can be seen, that the fusion method made a great improvement on the results comparing to the traditional method. However, in case of a smaller database (Private database), the amount of data is not enough to achieve sufficient training performance, therefore, we used the 3D U-Net model trained on the mixed DS. It is important to note, that the elements of the private dataset originated from completely different scanners than the VISCERAL or SLIVER dataset volumes, and have different internal properties (variance, resolution, etc.). The evaluation shows that the updated U-Net does not perform as good on the new database as on the already seen data. This supports the fact that trained CNNs have issues with new data with new characteristics, unless there is enough to further train the network with some of the new data. However, the pro- posed fused solution does not have this drawback, thus it can function without further training steps. Thus, the fusion method improved the results of the prediction masks and the traditional method and provided a more robust performance on both datasets.
TABLE III
QUANTITATIVE COMPARISON OF THE PROPOSED METHOD,THE UPDATED U-NET,AND THE FUSION METHOD.
Mixed DS Private database
Traditional
U-Net Fusion Traditional
U-Net Fusion
method method method method
Precision 0.88 0.95 0.93 0.94 0.78 0.90
TPR 0.87 0.96 0.90 0.85 0.80 0.88
FPR 0.01 0.00 0.00 0.00 0.02 0.01
Accuracy 0.98 1.00 0.99 0.99 0.97 0.99
DSC 0.86 0.95 0.91 0.89 0.79 0.89
VOE 24.42 9.12 16.39 19.57 32.62 19.36
RVD 3.38 0.75 -2.03 -9.51 1.95 -2.40
ASSD 6.81 1.80 3.37 4.24 7.94 5.13
RMSSD 12.29 3.11 5.86 8.83 12.10 9.21
MaxD 67.20 23.76 34.99 73.06 53.57 50.34
Figure 6 shows some representative slices of the fusion method’s segmentation results from3SLIVER volumes com- pared to the expert segmentation in in the axial, coronal, and
sagittal directions, respectively (ground truth in red, segmen- tation result in yellow). It can be seen that the proposed fusion method’s results approximate the reference segmentations.
The liver is successfully separated from neighboring organs:
from the heart in Figure 6(d), (e), and (i); from the kidney in Figure 6(c), (f), and (g). It can handle tumors inside the liver efficiently (Figure 6(c)), but undersegments if the tumor is close to the boundary (Figure 6(b), (e), (f)). Typical undersegmentation occurs at the tip of of the liver (Figure 6(a)) and also because of vessels (Figure 6(b), (g) and (h)).
(a) (b) (c)
(d) (e) (f)
(g) (h) (i)
Fig. 6. 2D slices of segmentation results. Each column shows slices of one case in the axial, coronal, and sagittal directions, respectively. The contour of the ground truth is in red. The contour of the fusion method’s segmentation result in yellow.
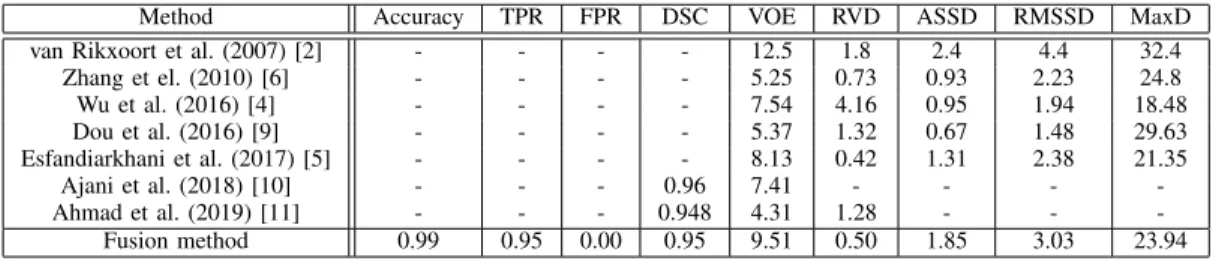
Table IV shows quantitative comparative results of our proposed fusion method with fully automatic state-of-the-art methods for the SLIVER train dataset. For our method to be comparable, the 3D U-Net was evaluated on the SLIVER dataset, using the leave-one-out cross-validation method. Due to the limited training dataset, the segmented prediction masks were unusable in 3 cases, thus, these were eliminated from the evaluation. The compared methods - briefly mentioned in the Introduction section -, are selected to cover a complete spectrum of the liver segmentation techniques: pixel-based method [2], [4], shape-based models [5], [6] and learning- based approaches [9]–[11]. The evaluation metrics show that our approach achieves usually higher VOE value, however for the RVD, ASSD, RMSSD, MaxD, the resulting values are in the average range. The same can be claimed for the compared DSC scores. The comparison shows that for the SLIVER database the proposed fusion method’s performance is comparable to the state-of-the-art, therefore together with the stable performance on the other datasets, including het- erogeneous volumetric data, and its good performance on previously unseen data with different statistics, the proposed
TABLE IV
COMPARATIVE RESULTS WITH FULLY AUTOMATIC STATE-OF-THE-ART METHODS FOR THESLIVERTRAIN DATASET.
Method Accuracy TPR FPR DSC VOE RVD ASSD RMSSD MaxD
van Rikxoort et al. (2007) [2] - - - - 12.5 1.8 2.4 4.4 32.4
Zhang et el. (2010) [6] - - - - 5.25 0.73 0.93 2.23 24.8
Wu et al. (2016) [4] - - - - 7.54 4.16 0.95 1.94 18.48
Dou et al. (2016) [9] - - - - 5.37 1.32 0.67 1.48 29.63
Esfandiarkhani et al. (2017) [5] - - - - 8.13 0.42 1.31 2.38 21.35
Ajani et al. (2018) [10] - - - 0.96 7.41 - - - -
Ahmad et al. (2019) [11] - - - 0.948 4.31 1.28 - - -
Fusion method 0.99 0.95 0.00 0.95 9.51 0.50 1.85 3.03 23.94
fusion method provides a promising and well-performing segmentation alternative.
IV. CONCLUSION
This paper presented a fully automatic liver segmentation method based on the fusion of traditional methods and neural networks. The proposed ”traditional” method starts with a preprocessing step, where the region of abdomen is determined and then thresholded based on the probability density function to remove most of the non-liver voxels. Active contour and region growing techniques are applied to give a binary mask of the liver, which is post-processed. To produce a better segmentation, the proposed method is combined with the output of 3D U-Net CNN model. First, the U-Net prediction map is updated by adding anatomical information, eliminating false positive voxels from the non-abdominal slices and only keeping the largest connected component. For further increas- ing the accuracy of the prediction masks, the GrowCut method is applied. The updated prediction mask is finally fused with the proposed traditional method.
Quantitative evaluation and comparison is performed on 3 different databases, including 2 publicly available databases (VISCERAL and SLIVER) and also on a private database.
The obtained results confirm that the roposed fusion method’s performance is comparable to the state-of-the-art and it gives uniformly stable results for heterogeneous CT volumes, even for unseen data with different statistics. It compensates for the drawbacks of the two different methods in every case, thus improving the results. In the future, we will concentrate on a more sophisticated fusion of the traditional and convolutional features, to integrate top-down information into the network model to further enhance the segmentation performance.
ACKNOWLEDGMENT
This work was funded by the Hungarian National Research, Development and Innovation Fund (NKFIA) grant nr. KH- 126688, and by the ´UNKP-18-4-PPKE-132 New National Excellence Program of the Ministry of Human Capacities.
Andrea Manno-Kovacs was supported by the J´anos Bolyai Research Scholarship of the Hungarian Academy of Sciences.
REFERENCES
[1] Tobias Heimann, Bram Van Ginneken, Martin A Styner, Yulia Arzhaeva, Volker Aurich, Christian Bauer, Andreas Beck, Christoph Becker, Rein- hard Beichel, Gy¨orgy Bekes, et al., “Comparison and evaluation of methods for liver segmentation from CT datasets,” IEEE Trans. on Medical Imaging, vol. 28, no. 8, pp. 1251–1265, 2009.
[2] Eva van Rikxoort, Yulia Arzhaeva, and Bram van Ginneken, “Automatic segmentation of the liver in computed tomography scans with voxel classification and atlas matching,” MICCAI Wshp. 3D Segmentation in the Clinic: A Grand Challenge, pp. 101–108, 2007.
[3] Laszlo Rusko, Gyorgy Bekes, Gabor Nemeth, and Marta Fidrich, “Fully automatic liver segmentation for contrast-enhanced CT images,” MIC- CAI Wshp. 3D Segmentation in the Clinic: A Grand Challenge, vol. 2, no. 7, 2007.
[4] Weiwei Wu, Zhuhuang Zhou, Shuicai Wu, and Yanhua Zhang, “Auto- matic liver segmentation on volumetric CT images using supervoxel- based graph cuts,” Computational and Mathematical Methods in Medicine, vol. 2016, 2016.
[5] Mina Esfandiarkhani and Amir Hossein Foruzan, “A generalized active shape model for segmentation of liver in low-contrast CT volumes,”
Computers in Biology and Medicine, vol. 82, pp. 59–70, 2017.
[6] Xing Zhang, Jie Tian, Kexin Deng, Yongfang Wu, and Xiuli Li,
“Automatic liver segmentation using a statistical shape model with optimal surface detection,” IEEE Trans. on Biomedical Engineering, vol. 57, no. 10, pp. 2622–2626, 2010.
[7] Olaf Ronneberger, Philipp Fischer, and Thomas Brox, “U-net: Convo- lutional networks for biomedical image segmentation,” inInternational Conference on MICCAI, 2015, pp. 234–241.
[8] ¨Ozg¨un C¸ ic¸ek, Ahmed Abdulkadir, Soeren S Lienkamp, Thomas Brox, and Olaf Ronneberger, “3D U-Net: learning dense volumetric segmen- tation from sparse annotation,” inInternational Conference on MICCAI, 2016, pp. 424–432.
[9] Qi Dou, Hao Chen, Yueming Jin, Lequan Yu, Jing Qin, and Pheng-Ann Heng, “3D deeply supervised network for automatic liver segmentation from CT volumes,” inInternational Conference on MICCAI, 2016, pp.
149–157.
[10] Bhavya Ajani, Aditya Bharadwaj, and Karthik Krishnan, “Automatic and fast CT liver segmentation using sparse ensemble with machine learned contexts,” inMedical Imaging 2018: Image Processing, 2018, vol. 10574, p. 105740L.
[11] M. Ahmad, D. Ai, G. Xie, S. F. Qadri, H. Song, Y. Huang, Y. Wang, and J. Yang, “Deep belief network modeling for automatic liver segmentation,” IEEE Access, vol. 7, pp. 20585–20595, 2019.
[12] Vladimir Vezhnevets and Vadim Konouchine, “Growcut: Interactive multi-label ND image segmentation by cellular automata,” inProc. of Graphicon, 2005, vol. 1, pp. 150–156.
[13] O. Jimenez-del-Toro, H. Mller, M. Krenn, K. Gruenberg, A. A. Taha, M. Winterstein, I. Eggel, A. Foncubierta-Rodrguez, O. Goksel, A. Jakab, G. Kontokotsios, G. Langs, B. H. Menze, T. Salas Fernandez, R. Schaer, A. Walleyo, M. Weber, Y. Dicente Cid, T. Gass, M. Heinrich, F. Jia, F. Kahl, R. Kechichian, D. Mai, A. B. Spanier, G. Vincent, C. Wang, D. Wyeth, and A. Hanbury, “Cloud-based evaluation of anatomical structure segmentation and landmark detection algorithms: VISCERAL anatomy benchmarks,” IEEE Trans. on Medical Imaging, vol. 35, no.
11, pp. 2459–2475, 2016.
[14] Tony F Chan and Luminita A Vese, “Active contours without edges,”
IEEE Trans. on Image Processing, vol. 10, no. 2, pp. 266–277, 2001.
[15] Michael Kass, Andrew Witkin, and Demetri Terzopoulos, “Snakes:
Active contour models,”International Journal of Computer Vision, vol.
1, no. 4, pp. 321–331, 1988.