ESTIMATION OF FOOD AND NUTRITIONAL SECURITY IN AZERBAIJAN: A CASE STUDY OF THE GANJA-GAZAKH REGION
Ragif Huseynov PhD student
György Enyedi Doctoral School of Regional Studies, Faculty of Economics and Social Sciences, Szent István University
E-mail: raqif_h@yahoo.de Abstract
This paper seeks to estimate household food security situation in the Ganja-Gazakh region of Azerbaijan based on both rural and urban areas of the Ganja-Gazakh region by identifying the food consumption and nutritional security situation of individual households. Primary data was generated from 300 households through simple random sampling. A face to face survey interview was conducted to collect quantitative and qualitative data on food and nutritional security such as availability, access, utilization, and stability. The Dietary intake method (DIA) was applied to estimate the food and nutritional security of households with the help of 7 days’
recall method. The empirical results showed that besides the adequate food availability situation, the problem of malnourishment is still existing among both urban and rural households of Ganja-Gazakh region of Azerbaijan. More than 20 percent of households were found food insecure in the selected region. Likewise, the situation of nutritional security was also estimated. It the study revealed that most of the households were undernourished. The present level of protein, zinc, and iron was low among households. The condition of micro and macronutrients was severe. Based on the findings of this study, there is urgent need for the government to launch short and long term public and private programs to overcome the issue of food and nutritional insecurity rural and urban areas of Azerbaijan.
Keywords: Food Availability, Food Access, Food Utilization, Food Stability, Azerbaijan JEL classification: Q01, Q05, Q18, Q19
LCC: HB, HF, HQ, HV
Introduction
Azerbaijan is considered a food secured country due to staple food availability and its import of food produce in order to meet the domestic demand of the country (FAO, 2015; ROA, 2016).
In contrast, FAO, (2015b) reported that at the household level, achieving food security is still a major challenge. household food security is a multidimensional phenomenon and may be studied in three broad dimensions such as food availability, food accessibility and food utilization Jafarova, (2016). The issue of food insecurity is not only as a result of food supply shortage, but also due to lack of affordability or accessibility to food at household and individual level (Vasa, 2005). Similarly, growing urbanization coupled with increased incidence of climate change and global warming has expedited the stress on the present food supply system and has loomed national and household food security in most of the less developed countries.
The study of Murgai et al. (2001), showed that in Azerbaijan, factors such as low rural income level relative to increasing cost of living, household dependent ratio, and extensive unemployment contribute to household food insecurity. Therefore, individuals need to a satisfactory level of income or other modes to be able to purchase goods and services. Further low income earnings in addition to unemployment has been associated to Azerbaijan's rural
household’s food insecurity status. (FAO, 2003) highlighted that since independence, achieving food security has been admitted as an imperative priority in Azerbaijan. However, of recent, the agricultural and food sector has have been prioritized by the government for targeting economic growth and improvement of living status of rural individuals. For this reason, loans have been made available through easily accessible to the farmers through the National Fund for agricultural venture. Document released by IFAD (2008) revealed that since Agriculture is a major tool for growth, job creation and food security, there is need to launch several programmes targeted at resuscitating the entire agricultural sector which will intensify crop and livestock production and household income in both rural and urban regions. Another study by (Schmitz and Kennedy, 2016) established that food utilization was still a prime issue in the poorest areas of Azerbaijan. Despite efforts made so far, food security among rural households is still a complex issue in some areas of Azerbaijan. While a sustainable food security situation in its totality at the national level remains a great challenge (Barrett, 1996). Although, the Azerbaijan government has introduced many programs and policies on intervention, aimed at attaining food security all these efforts have not produced the required objectives (Chaaban, et al., 2018). The main reasons for this were the element that food availability and accessibility in Azerbaijan has not increased that can meet up the demand for socioeconomic circumstances at household and individual level. The domestic gap between the food supply and demand has led to increased food and livestock product importation, as well as increased inflation and currency deprecation thereby making it thornier for the middle and lower-middle-class people to meet their dietary needs (Chabot and Tondel, 2011). The available information and data on household and national food security situation in Azerbaijan has remained a problem for both the policymakers and government as well. The government program implementers and policymakers are gradually seeking food security measurement tools that are reliable and easy and reliable to use (Clapp, 2017). The analysis of national food security determinants and its status is therefore, useful not only for policymaking but also for better policy implementation (FAO, 2015b). Although, numerous factors are a direct or indirect consequence of food security that had been examined empirically in Azerbaijan at the micro-level or using targeted group approach such as household or farm level (Djuric et al., 2017). To our knowledge, none of the recent studies on food security have seek to estimate household food security situation and factors affecting the food and nutritional security. Therefore, this study aims to examine the food and nutritional security situation at the household level by the primary data.
Materials, methods and experimental design Location of Data collection
The primary data was collected from the Ganja-Gazakh economic region of Azerbaijan that consists of Deshkesen, Goygol, Samukh, Agstafa, Gadabay, Gazakh, Garanboy, Tovuz, Shamkir districts and cities such as Naftalan and Ganja. The most developed city is Ganja city in Ganja-Gazakh economic region. This region represents 14% of the country's total population.
In Ganja-Gazakh economic region, 53 percent population lives in rural areas and 47 percent live in urban areas (ROA, 2016).
The main reason for collecting these primary data was to tie the relationship between food intake, food nutrition, and socioeconomic factors. The primary research questions are given below:
• What is the household food security situation in the Ganja-Gazakh region of Azerbaijan?
• What are the main factors affecting household food security and food nutrition in the
The core premise behind the development of the questionnaire was dependant on the above- given research questions and our empirical results in the Ganja-Gazakh region of Azerbaijan.
Sampling Method
Simple random sampling technique was applied to collect primary dataset in this study. Town council was randomly selected from the Ganja-Gazakh region, hen a record of all villages, communities, and sub-villages was made containing the record of the head of households and their spouses and kids. A total sample of 300 households was randomly collected. However, for the survey activity relevant respondents we wished to interview such as the wife of household or any other housemate who normally cooks food since they were the most relevant person to respond batter about food security questions.
Implementation of face to face survey
Primary data was collected with the help of trained enumerators who had contributed in different survey projects conducted by governmental and non-governmental organizations.
They got a two-day questionnaire filling training and social and professional ethics for gathering socioeconomic primary data. For the training and accuracy purpose, the sample questioner was also interpreted in Azerbaijan's local language that makes it easy for data enumerators while asking questions. A pilot survey was conducted to pre-access to the findings to our research. The date of the primary survey was 1st May to 10th May 2019. The bellow Fig.
1 displays the map of Azerbaijan.
Figure 1: Map of Azerbaijan's Region Source: Adopted from Google
Data coding and management
To increase the reliability and robustness of the results, we have cross-checked the data to remove the inconsistencies, outliers, and patterns in the data. For this purpose, data were imported into SPSS software for cleaning.
Household food security (Dietary Intake Approach)
This study applied the dietary intake approach (DIA) as used by Bashir et al., (2013) for estimating the household food security status. Seven (7) days recall approach was used, household and per capita food intake were estimated. Thus, the adult equivalence units was used concerning gender and age groups. The mathematical expression of the DIA approach is given as:
FSi = ∑ cal′i − L ≥ 0
Where FSi represents the status of Azerbaijan’s food security at the ith household.(i=1,2,…,n).
The expression of Cal^ i is exhibited total food intake in the form of calories. The 2450 kcal/per person/ per day criteria is used as a threshold for food security individuals. Azerbaijan household is said to be food secure household if the FSi of a given household is greater than 0.
Results and Discussion
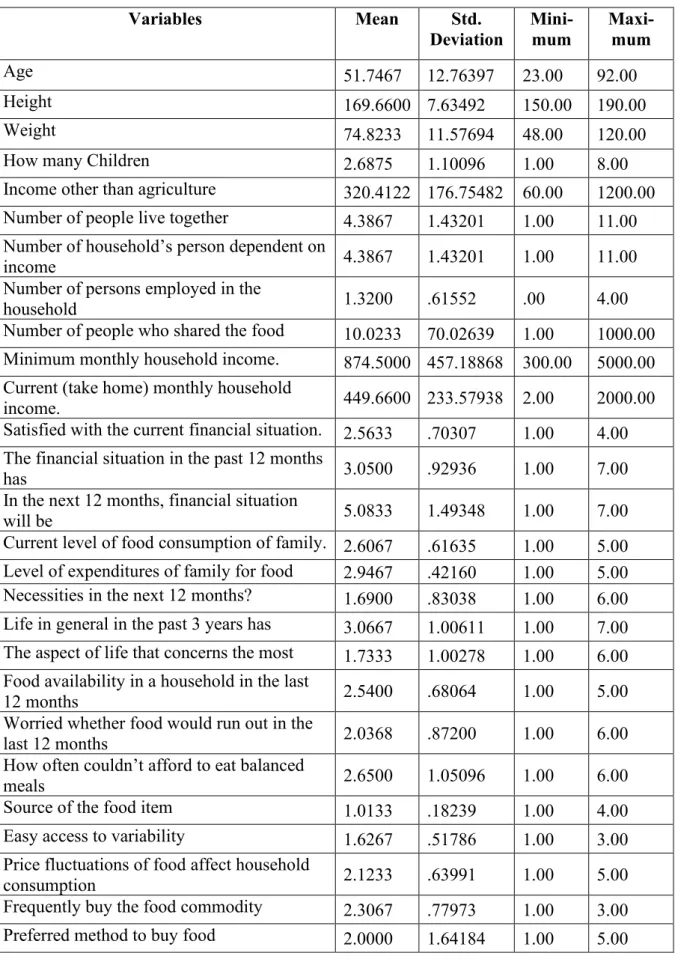
Table 1 indicates that the average age of the sampled respondent was about 51.7467 with a standard deviation of 12.76397 and minimum to a maximum range of 23-92. While the average height was 169.6600 with a standard deviation of 7.63492 and minimum to a maximum range of 150 to 190. 74.8233. Weight was observed with a standard deviation of 11.57694 within the range of 48 to 120 years. Average number of children of the sampled respondent was about 2.6875 with a standard deviation of 1.10096 and minimum to a maximum range of 1 to 8. While the average income from other resources other than agriculture was 320.4122 with a standard deviation of 176.75482 and a minimum to a maximum range of 60 to 1200. 4.3867 Number of people live together was observed with a standard deviation of 1.43201 within the range of 1 to 11.
The average number of households’ person’s dependent on the income of sampled respondents was about 4.3867 with a standard deviation of 1.43201 and minimum to a maximum range of 1 to 11. While the average number of persons employed in the household was 1.3200 with a standard deviation of .61552 and minimum to a maximum range of 0 to 4. 10.0233 Number of people who shared the food was observed with a standard deviation of 70.02639 within the range of 1 to 1000. The average minimum monthly household income of sampled respondents was about 874.5000 with a standard deviation of 457.18868 and minimum to a maximum range of 300 to 5000. While the average Current (take home) monthly household income was 449.6600 with a standard deviation of 233.57938 and minimum to a maximum range of 2 to 2000. 2.5633 Satisfied with the current financial situation was observed with a standard deviation of .70307 within the range of 1 to 4. The average of the financial situation in the past 12 months of the sampled respondent was about 3.0500 with a standard deviation of .92936 and minimum to a maximum range of 1 to 7. While the average of next 12 months’ financial situation was 5.0833 with standard deviation of 1.49348 and minimum to maximum range of 1 to 7. 2.6067 current level of food consumption of family was observed with a standard deviation of .61635 within the range of 1 to 5. Average Current level of expenditures of family for food and other necessities like clothing and housing of sampled respondent was about 2.9467 with standard deviation of .42160 and minimum to maximum range of 1 to 5.
Table 1: Descriptive statistics of sampled data
Source: Author’s own calculations
Variables Mean Std.
Deviation Mini-
mum Maxi- mum
Age 51.7467 12.76397 23.00 92.00
Height 169.6600 7.63492 150.00 190.00
Weight 74.8233 11.57694 48.00 120.00
How many Children 2.6875 1.10096 1.00 8.00
Income other than agriculture 320.4122 176.75482 60.00 1200.00 Number of people live together 4.3867 1.43201 1.00 11.00 Number of household’s person dependent on
income 4.3867 1.43201 1.00 11.00
Number of persons employed in the
household 1.3200 .61552 .00 4.00
Number of people who shared the food 10.0233 70.02639 1.00 1000.00 Minimum monthly household income. 874.5000 457.18868 300.00 5000.00 Current (take home) monthly household
income. 449.6600 233.57938 2.00 2000.00
Satisfied with the current financial situation. 2.5633 .70307 1.00 4.00 The financial situation in the past 12 months
has 3.0500 .92936 1.00 7.00
In the next 12 months, financial situation
will be 5.0833 1.49348 1.00 7.00
Current level of food consumption of family. 2.6067 .61635 1.00 5.00 Level of expenditures of family for food 2.9467 .42160 1.00 5.00 Necessities in the next 12 months? 1.6900 .83038 1.00 6.00 Life in general in the past 3 years has 3.0667 1.00611 1.00 7.00 The aspect of life that concerns the most 1.7333 1.00278 1.00 6.00 Food availability in a household in the last
12 months 2.5400 .68064 1.00 5.00
Worried whether food would run out in the
last 12 months 2.0368 .87200 1.00 6.00
How often couldn’t afford to eat balanced
meals 2.6500 1.05096 1.00 6.00
Source of the food item 1.0133 .18239 1.00 4.00
Easy access to variability 1.6267 .51786 1.00 3.00
Price fluctuations of food affect household
consumption 2.1233 .63991 1.00 5.00
Frequently buy the food commodity 2.3067 .77973 1.00 3.00 Preferred method to buy food 2.0000 1.64184 1.00 5.00
While the average necessities in the next 12 months was 1.6900 with standard deviation of .83038 and minimum to maximum range of 1 to 6. 3.0667 Life in general in the past 3 years was observed with a standard deviation of 1.00611 within the range of 1 to 7. Average the aspect of life that concerns the most of sampled respondent was about 1.7333 with standard deviation of 1.00278 and minimum to maximum range of 1 to 6. While the average number of respondents satisfied with current food availability in household in the last 12 months was 2.5400 with standard deviation of .68064 and minimum to maximum range of 1 to 5. 2.0368 respondents were concerned about whether food would run out before getting money to buy in the last 12 months was observed with a standard deviation of .87200 within the range of 1 to 6.
Average how often could not afford to eat balanced meals in household of sampled respondents was about 2.6500 with standard deviation of 1.05096 and minimum to maximum range of 1 to 6. While the average of a household member not able to eat the kind of food preferred to eat because of lack of resources was 2.6633 with standard deviation of .79083 and minimum to maximum range of 1 to 6. 3.4267 one month was any household member go a whole day and night without eating anything at because there was not enough food was observed with a standard deviation of 1.15863 within the range of 1 to 6.
The average Source of the food item of the sampled respondent was about 1.0133 with a standard deviation of .18239 and minimum to a maximum range of 1 to 4. While the average Easy access to variability was 1.6267 with standard deviation of .51786 and minimum to maximum range of 1 to 3. 2.1233 Price fluctuations of food affect household food consumption was observed with a standard deviation of .63991 within the range of 1 to 5. Average frequently you buy the food commodity of sampled respondent was about 2.3067 with standard deviation of .77973 and minimum to maximum range of 1 to 3. While the average preferred method to buy food was 2.0000 with a standard deviation of 1.64184 and minimum to a maximum range of 1 to 5.
Food Security Situation in Ganja-Gazakh region
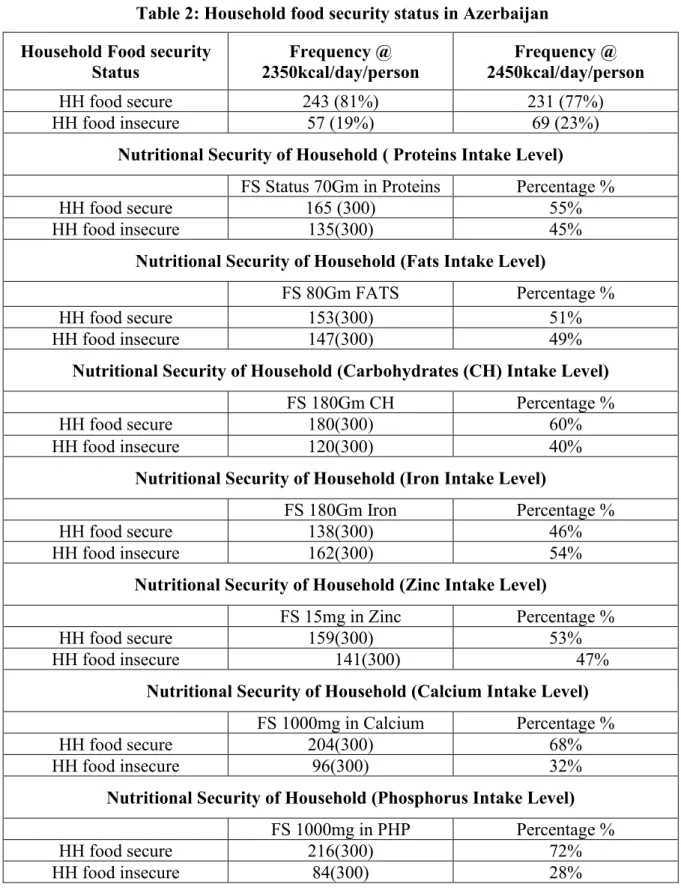
Table 2 reports the household’s food security situation in Ganja-Gazakh region in Azerbaijan.
According to threshold level 2350kcal/day/person about 81 percent households were found to be a food secure households and 19 percent households were found as a food insecure households in Ganja-Gazakh region. If we increase the threshold level from 2350 to 2450kcal/day/person then household food insecurity level increased from 19 percent to 23 percent. Likewise, this study also estimated the nutritional security of the same area through estimation of micro and macro nutrients of Ganja-Gazakh region. The nutrition security situation of protein intake at 70gm/adult equivalents/day threshold level, about 55 percent households were found as food secure household while remaining 45 percent were found food insecure household.
Similarly, this study also examined nutritional food security in terms of fat intakes. At the 80gm/adult equivalents/day threshold level, in terms of fat intakes nutritional security about 51 percent Ganja-Gazakh region households were food secure while the remaining 49 percent of households were found intakes of fats insecure. On the other hand, we have also studied the intakes of carbohydrates' nutritional security. According to 180gm/adult equivalents/day threshold level, about 60 percent of households were found 60 percent while reaming 40 percent were found to be carbohydrates insecure. In terms of iron security, 56 percent of households were found iron deficient. The iron deficiencies were the main cause of anaemia among women and kids under 5 years. Same in the case of zinc security level, almost all of the population were suffering from zinc deficiency. Therefore, it is essential to ensure the micronutrient balance
According to the nutritional security of calcium by using the 1000mg/adult equivalents/day threshold level, about 32 percent of households were found insecure in calcium intake. Same in the case of phosphorus security by using 1000mg/adult equivalents/day threshold level, about 28% of households were found insecure in a selected region of Azerbaijan.
Table 2: Household food security status in Azerbaijan Household Food security
Status
Frequency @ 2350kcal/day/person
Frequency @ 2450kcal/day/person
HH food secure 243 (81%) 231 (77%)
HH food insecure 57 (19%) 69 (23%)
Nutritional Security of Household ( Proteins Intake Level)
FS Status 70Gm in Proteins Percentage %
HH food secure 165 (300) 55%
HH food insecure 135(300) 45%
Nutritional Security of Household (Fats Intake Level)
FS 80Gm FATS Percentage %
HH food secure 153(300) 51%
HH food insecure 147(300) 49%
Nutritional Security of Household (Carbohydrates (CH) Intake Level)
FS 180Gm CH Percentage %
HH food secure 180(300) 60%
HH food insecure 120(300) 40%
Nutritional Security of Household (Iron Intake Level)
FS 180Gm Iron Percentage %
HH food secure 138(300) 46%
HH food insecure 162(300) 54%
Nutritional Security of Household (Zinc Intake Level)
FS 15mg in Zinc Percentage %
HH food secure 159(300) 53%
HH food insecure 141(300) 47%
Nutritional Security of Household (Calcium Intake Level) FS 1000mg in Calcium Percentage %
HH food secure 204(300) 68%
HH food insecure 96(300) 32%
Nutritional Security of Household (Phosphorus Intake Level)
FS 1000mg in PHP Percentage %
HH food secure 216(300) 72%
HH food insecure 84(300) 28%
Source: Author's calculations
Conclusion and Policy recommendations
A country can achieve sustainable development in many ways. Household food security is a multidimensional and complex issue. At present times, when household and individual food security is vulnerable due to climate change and exchange rates for currencies and international price volatility. There is a need for both domestic as well as global responses. Based on the findings of this study, there is a need for inclusive household food security policy for sustainable development plans that take into account Azerbaijan's household characteristics and specificities, and address both food accessibility and utilization dimensions of food security.
Household food security strategies which should include short and long term policies. in Azerbaijan. Research and development are critical for social and economic development of a country. Nations that are doing better in terms of household food security are those with high budget for intensive and continuous research and development that is economy driven in terms of implementation and sustainability. This will improve the potential of domestic agriculture food supply for meeting national household and individual's needs. At the household level, every nation, including Azerbaijan, need a database and cross-sectional, time series and penal datasets to examine the food availability, accessibility, affordability, utilization, hunger and malnutrition that will provide early warning assistance effectively. The structure of social safety nets can mitigate the impact of food inflation on most vulnerable populations. Our study findings have important implications for Azerbaijan government and policy makers for achieving household food security outcome. Food access, utilization and stability should put in place in term of policy and planning that will enhance the long term development and sustainability of a country like Azerbaijan. This could be attained by investment in infrastructure, education, health and food safety, giving importance to rural areas socioeconomic development
References
1. Barrett, C. B. (1996). Market analysis methods: Are our enriched toolkits well suited to enlivened markets? American Journal of Agricultural Economics, 78, 825–829.
2. Bashir, M.K., S. Schilizzi, and R. Pandit. 2013. Reginal Sensitivity of Rural Household Food Security: The Case of Punjab, Pakistan. The Journal of Animal and Plant Sciences, 23(4): 1200-1206.
3. Brück, T., Esenaliev, D., Kroeger, A., Kudebayeva, A., Mirkasimov, B., & Steiner, S.
(2012). Household survey data for research on well- being and behavior in Central Asia.
DIW Discussion Papers, No. 1257.
4. Chaaban, J., Ghattas, H., Irani, A., & Alban, T. (2018). Targeting mechanisms for cash transfers using regional aggregates. Food Security, 10(2), 457–472.
5. Chabot, P., & Tondel, F. (2011). A regional view of wheat markets and food Security in Central Asia. United States Agency for International Development: Famine early warning systems network (FEWS NET), world food Programme.
6. Clapp, J. (2017). Food self-sufficiency: Making sense of it, and when it makes sense.
Food Policy, 66, 88–96.
7. Dickey, D. A., & Fuller, W. A. (1981). Likelihood ratio statistics for autoregressive time series with a unit root. Econometrica, 49(4), 1057–1072.
8. Djuric, I., Götz, L., Svanidze, M., & Glauben, T. (2017). Agricultural market integration in the commonwealth of independent states – What are the main driving forces and challenges? In G. Egilmez (Ed.), Agricultural Value Chain (pp. 139–160). InTechOpen.
9. Engle, R. F., & Granger, C. W. (1987). Co-integration and error correction:
Representation, estimation, and testing. Econometrica, 55, 251– 276.
10. FAO (2011a).Country rank in the World, by commodity. Food and Agriculture Organization of United Nations, Statistics Division.
11. FAO (2015a). Food and Agriculture Organization of the United Nations. Retrieved from http://www.fao.org/faostat/en/#home
12. FAO, (2010). The state of food insecurity in the World: addressing food insecurity in protracted crises. Food and Agriculture Organization of the United Nations, Rome.
13. FAO, (2011b).Food balance sheets. Food and Agriculture Organization of United Nations, Statistics Division.
14. FAO, (2013). The state of food insecurity in the World: The multiple dimensions of food security. Food and Agriculture Organization of the United Nations, Rome.
15. FAO. (2003). World summit on food Security: Draft declaration of the world summit on food security. Rome: FAO.
16. FAO. (2015b). Regional overview of food insecurity: Europe and Central Asia. Rome:
FAO.
17. Ilyasov, J. (2016). Fuel to food: Evidence of price pass-through in Kyrgyzstan. Research paper presented at the Samarkand Conference "Regional and International Cooperation in Central Asia and South Caucasus: Recent developments in Agricultural Trade", November 2–4, 2016. Samarkand, Uzbekistan.
18. International Fund for Agricultural Development (IFAD). 2010 Republic of Azerbaijan Integrated Rural Development Project (IRDP) Project Design Report, Volume I: Main Report. http://www.ifad.org/operations/projects/design/102/azerbaijan.pdf
19. IFAD, International Fund for Agricultural Development (2014): accessed on 2020.02.18 https://www.ifad.org/en/
20. Jafarova, Aynur. (2016). Azerbaijan enjoys a great capacity to export agricultural
products, industrial goods. AZERNEWS, (Online),
www.azernews.az/analysis/71635.html
21. Johansen, S. (1988). Statistical analysis of cointegration vectors. Journal of Economic Dynamics and Control, 12(2–3), 231–254.
22. Johansen, S. (1991), “Estimation and Hypothesis Testing of Cointegrating Vectors in Gaussian Vector Autoregressive Models,” Econometrica, 59, 1551-1580
23. Khalilov, H., Shalbuzov, N., Huseyn, R. (2015). Country Report: Azerbaijan. Research Institute of Agricultural Economics, Azerbaijan.
24. Mary, S. (2019). Hungry for free trade? Food trade and extreme hunger in developing countries. Food Security. https://doi.org/10.1007/ s12571-019-00908-z.
25. Ministry of Economic Development of Azerbaijan Republic, Economic Development Scientific Research Institute (2016), Reports (Azerbaycan Respublikası IQTİSADİ
Inkişaf Nazirliyi Iqtisadi İslahatlar Elmi-Tadqiqat İnstitutu).
26. Murgai, R., M. Ali and D. Byerlee. 2001. The World Bank Research Observer, 16(2):
199-218.
27. Pesaran, M.H., and Y. Shin (1999), “An Autoregressive Distributed Lag Modeling Approach to Cointegration Analysis,” in Econometrics and Economic Theory in the 20th Century: The Ragnar Frisch Centennial Symposium, ed., Strom, S., Cambridge University Press: Cambridge.
28. Pesaran, M.H., Y.Shin, and R.J. Smith (2001), "Bounds Testing Approaches to the Analysis of Level Relationships," Journal of Applied Econometrics, 16, 289-326.
29. Republic of Azerbaijan. 2008. State Program on Poverty Reduction and Sustainable Development in the Republic of Azerbaijan for 2008-2015.
30. Schmitz, A., & Kennedy, L. (2016). Food Security and the role of food storage. In A.
Schmitz, L. Kennedy, & T. G. Schmitz (Eds.), Food Security in a food abundant world (pp. 1–17) Emerald Group Publishing Limited.
31. Sutton, W. R., Srivastava, J. P., & Neumann, J. E. (2013). Looking beyond the hoizon : How climate change impacts and adaptation responses will reshape agriculture in Eastern Europe and Central Asia. Washington, DC: World Bank.
32. Swart, R., Robinson J. & Cohen, S. 2003, “Climate Change and Sustainable Development: Expanding the Options” Climate Policy, vol.3, Suppl. 1, pp.19-40.
33. Swinnen, J., & van Herck, K. (2011). Food Security and the transition region. Rome:
FAO investment Centre division.
34. Vasa, L. (2005). “Economic coherences between food consumption and income conditions in the Hungarian households” Annals of Agrarian Sciences, Vol. 1. pp. 228- 232.
35. Watson, D. (2017). The political economy of food price policy during the global food price crisis of 2006-2008. Food Security, 9(3), 497–509. WFP (2016). World Food Programme. Retrieved from http://www.wfp. org/
36. WHO (2016). World Health Organization. Retrieved from http://www. who.int/en/
37. Willer H. and Lernoud, J. eds. (2015). The World of Organic Agriculture. Statistics and Emerging Trends 2015, Research Institute of Organic Agriculture (FIBL), Frick and IFOAM-Organics International, Bonn.
38. World Bank, World Development Indicators-WDI. Washington DC: The World Bank Group, 2018.
39. World Data Atlas (2018). (Online) https:/knoema.com/Atlas/Azerbaijan.