Microcomputed tomography e based characterization of advanced materials: a review
L. V as arhelyi
a, Z. K onya
a,b, A. Kukovecz
a, R. Vajtai
a,c,*aInterdisciplinary Excellence Centre, Department of Applied and Environmental Chemistry, University of Szeged, H-6720, Rerrich Bela Ter 1, Szeged, Hungary
bMTA-SZTE Reaction Kinetics and Surface Chemistry Research Group, H-6720 Szeged, Rerrich sq. 1, Hungary
cDepartment of Materials Science and NanoEngineering, Rice University, 6100 Main Street, Houston, TX 77005, USA
a r t i c l e i n f o
Article history:
Received 15 April 2020 Received in revised form 11 May 2020
Accepted 11 May 2020 Available online xxx Keywords:
Micro-CT X-ray
Bioinspired materials Energy and environment Structural materials Porous rock Energy storage Filtration
a b s t r a c t
Micro-computed tomography (CT) is an X-ray tomography technique with (sub)micron resolution, typically using an X-ray tube with cone-beam geometry as a source and a rotating sample holder. While conventional CT maintained a strong position in life science and low-resolution high-energy CT became widespread in industrial quality control, micro-CT has enjoyed a boost in interest from the materials science research community in the past decade. The key reasons behind this are the versatile, non- destructive nature of micro-CT as a characterization method offering also in situ and in operando possibilities and the fact that micro-CT has become indispensable in developing and verifying compu- tational material models as well. The goal of the present mini review is to give a concise introduction of the method to newcomers and showcase a few impressive recent results that can help in devising even more innovative future uses of micro-CT. After a brief overview of alternative three-dimensional imaging techniques, we review the basics of micro-CT covering important concepts such as resolution, magnifi- cation, and the Hounsfield unit. The second part of the article summarizes characteristic materials sci- ence micro-CT applications in bioinspired materials, structural materials, porous natural materials, energy storage, energy conversion, andfiltration.
©2020 The Author(s). Published by Elsevier Ltd. This is an open access article under the CC BY-NC-ND license (http://creativecommons.org/licenses/by-nc-nd/4.0/).
1. Introduction
The microstructure of materials largely determines their me- chanical and physical attributes and behavior. Therefore, imaging the inner structure and morphological characteristics of materials is of paramount importance in material design and engineering.
The inherent limitation of two-dimensional (2D) imaging methods is their inability to provide spatial information about the investi- gated structure. On the other hand, three-dimensional (3D) imag- ing can reveal the volume, shape, spatial and size distribution, and connectivity of inhomogeneities (e.g. pores, different phases, cracks). For example, 2D radiographs can confirm the existence of cracks, discontinuities, pores, or structural errors, but 3D images can also help us localize them and identify their origin.
1.1. 3D imaging techniques
Most 3D imaging techniques work with electromagnetic waves (the exception being ultrasonic tomography), and the wavelength of the applied radiation determines the scale of the features investigated. The theoretical resolution limit when using visible light is approximately 200 nm, while with electrons even individ- ual atoms can be investigated.
The entry point into the world of 3D imaging is confocal optical microscopy that allows examining the 3D structure in a finite deepness and for transparent materials only. (Although opaque samples can also be studied influorescence mode.)
Magnetic resonance imaging provides fully resolved 3D images non-invasively and non-destructively using the resonance signal of hydrogen atoms. Excellent for soft tissues (it is the highest contrast medical imaging technique), its highest resolution is a couple of tens of micrometers. Its major disadvantages are that we cannot investigate ferromagnetic materials and that the sample must be transparent for radiofrequency waves [1].
*Corresponding author.
E-mail address:robert.vajtai@rice.edu(R. Vajtai).
Contents lists available atScienceDirect
Materials Today Advances
j o u r n a l h o m e p a g e : w w w . j o u r n a l s . e l s e v i e r . c o m / m a t e r i a l s - t o d a y - a d v a n c e s /
https://doi.org/10.1016/j.mtadv.2020.100084
2590-0498/©2020 The Author(s). Published by Elsevier Ltd. This is an open access article under the CC BY-NC-ND license (http://creativecommons.org/licenses/by-nc-nd/4.0/
).
Scanning electron microscopy (SEM) provides better resolution (nanometer scale) but only in 2D. To investigate 3D structure with SEM, the sample has to be sectioned, for example, with focused ion beam [2]. This destructive technique takes a lot of time and is limited to imaging a very small volume. Serial block-face scanning electron microscopy using ultramicrotomy allows imaging a bigger volume in an automated process, but it is not suitable for sensitive, brittle, or wet materials and the slicing can introduce serious artifacts [3].
3D imaging in a transmission electron microscope is called electron tomography. Transmission images of the sample acquired from at least a hundred different angles can be reconstructed into a 3D model of the sample. This is a very high-resolution (tens of nanometers) technique but only suitable for very small samples [4].
3D photoacoustic tomography is a non-invasive, non-destruc- tive imaging technique with a millimeter resolution, where the contrast is based on the absorption of laser light [5].
X-ray can be used for imaging in many ways. The most common technique is traditional X-ray absorption imaging, where an X-ray beam passes through the sample and the transmitted radiation is detected to form a simple attenuation contrast image. The other possibilities include fluorescence X-ray tomography [6], dual- energy X-ray tomography [7], or phase-contrast X-ray tomogra- phy. Phase contrast is required in the case of low-density materials where attenuation contrast is not sufficient due to the small dif- ferences in the attenuation coefficients of materials. This technique requires a monochromatic beam and alterable sample to camera distances [8]. There is also a possibility to form a 3D map of the composition of samples with the X-ray diffraction method [9].
Computed tomography (CT) is a non-destructive 3D imaging technique based on the different X-ray attenuation of materials. Its non-destructive nature allows temporal investigation (some call it four-dimensional (4D) imaging, where the fourth dimension is time), and the examined samples remain unchanged, can be further investigated (even in situ), or can be put to use. Virtually no sample preparation is required, and thus it is suitable for samples that would lose their shape if sectioned manually. Samples remain intact during the measurement. In some cases, there is a need for contrast enhancement by contrast agents, but this usually does no harm to the sample. CT imaging allows multiscale investigation from millimeter resolution with clinical or industrial instruments to submicron resolution achievable using nano-CT. A broad variety of samples from biological materials to electronic devices can be investigated at a relatively high spatial resolution. Data obtained from CT scans can be the input of simulations or 3D models for additive manufacturing. The main limitations of CT are related to the high Z contrast necessary for good imaging quality. Low-Z materials and samples with low X-ray attenuation contrast are difficult to measure, whereas very high Z materials (e.g. metals) can introduce serious artifacts and worsen image quality. Some addi- tional shortcomings are related to the very large data sets and lengthy image postprocessing procedures, the sample sizeedependent resolution (in certain geometries), and the diffi- culties due to radiation-induced changes in the sample.
3D imaging modalities are compared inFig. 1. Each technique has its own advantages and disadvantages (Table 1). Higher reso- lution typically means higher acquisition and operating cost. The use of low energy, non-ionizing radiation is cheaper, but its draw- backs are smaller penetration depth and inferior resolution. Some techniques allow examining a high variety of samples, but the increasing sample size is frequently paired with lower resolution, while higher resolution and better image quality often require longer measurement times. The use of non-destructive and non- invasive techniques is important for materials science applica- tions, while the use of non-ionizing radiation can eliminate health hazards.
Imaging methods can be combined advantageously to eliminate certain drawbacks, for example, SEM can be combined with micro- CT to obtain 100-nm spatial resolution, which is worse than the resolution of SEM but is superior to that of most micro-CTs. The key idea here is to use the SEM electron beam to produce the X-ray radiation. This makes investigating the 3D structure possible in high resolution and non-destructively but only for small sample sizes [10]. It is also possible to capitalize on the complementarity of techniques, for example, CT and neutron tomography. Neutron to- mography is an attenuation-based, non-destructive technique, with high contrast for low-Z materials with micrometer resolution.
CT complements it well because the materials with high neutron attenuation have low X-ray attenuation. The methodological basis of the two techniques is the same [11,12]. However, neutron to- mography has a restricted availability compared with CT because it requires a neutron source. Table 2 gives examples, where the combination of techniques is required to advance understanding in thefield.
1.2. Micro-CT
1.2.1. Definition of micro-CT
Generally speaking, micro-CT is an X-ray tomography technique with (sub)micron resolution, using an X-ray tube with cone-beam geometry as a source and using a rotating sample holder. The his- tory of X-ray imaging has begun in 1895 with the discovery of X- rays by Wilhelm Conrad Roentgen. In the 1970s, Sir Godfrey Hounsfield created thefirst computer tomograph for medical pur- poses [13]. With the advances in technology, high-resolution micro-CT was invented [14], followed by X-ray microscopy [15] and nano-CT [16]. Microcomputed tomography, computed micro- tomography, X-ray CT, X-ray microtomography, CT, X-ray micro- scopy, and microscopic CT are expressions where all refer to essentially the same technique. Micro-CT simply means high-res- olution CT. With the decrease in focal spot size and increase in resolution, developers could achieve submicron resolution and started referring to devices capable of this high resolution as nano- CT [16]. After some time, with the use of synchrotron radiation and special X-ray optics, even better resolution (below 100 nm) became obtainable [17,18]. CTs equipped with X-ray lenses are often called X-ray microscopes. Stock [19] defines micro-CT as a high-resolution CT that can reach at least 50e100mm resolution. Others place the resolution of micro-CT between 500mm and 3mm or even less [20].
Besides resolution, the second most apparent difference be- tween medical CT and laboratory-based micro-CT is the measure- ment geometry. In medical scanners, there is afixed patient table
Fig. 1.Radar chart of the comparison of 3D imaging modalities. Axes are scaled in relative arbitrary units to facilitate qualitative comparison. 3D, three-dimensional.
arhelyi et al. / Materials Today Advances 8 (2020) 100084 2
with the detector and source rotating around it, whereas in typical micro-CT, the sample holder rotates around its own axis and the detector and source arefixed. Moreover, medical scanners tend to use fan-beam geometry, while in micro-CTs, cone-beam geometry is the most common. However, there are micro-CTs with fixed sample holders (e.g. for in vivo small animal imaging [21]), labo- ratory-based systems that use fan beams [22], and even parallel beam CTs (using synchrotron radiation) [23]. It is worth noting that besides the conventional X-ray attenuationebased approach, it is also possible to build other types of X-ray tomographs, for example, based on phase-contrast imaging [24].
Clearly, micro-CT is not a distinct, well-defined method, rather a diverse group of slightly different 3D X-ray absorption imaging techniques. For clarity, in this review, micro-CT will refer to devices capable of resolution better than 100mm.
1.2.2. Basics of micro-CT
CT is a 3D non-destructive imaging technique based on the different X-ray attenuation of materials. The change in X-ray in- tensity upon passing through a material is described by the Lambert-Beer law as follows:
I¼I0emx
whereIis the transmitted intensity, I0is the incident X-ray in- tensity,mis the linear attenuation coefficient (LAC), and xis the thickness of the sample. The LAC depends on the density and atomic number of the material and the applied X-ray energy.
The X-ray beam passes through the material, where e depending on the LACesome of the X-ray photons are absorbed.
Transmitted photons are detected by a detector (e.g. a high-reso- lution charge-coupled device (CCD)) placed on the opposite side of the sample, and thus a single 2D attenuation map (shadow pro- jection) is obtained. Because the sample is rotated (in 180or 360), the shadow projection image is acquired in numerous different angles. The detailed 3D structure of the samples is reconstructed from these hundreds (or even thousands) of images with the help of image reconstruction algorithms, most frequently some modi- fied versions of Feldkamp's back-projection algorithm [25]. After reconstruction, an image postprocessing step is required to analyze the results. For most calculations, an image segmentation step is
needed to convert the original greyscale attenuation image into a 2- bit data set. In a lot of cases, the analysis of the images is more time consuming than the image acquisition itself because of the huge size of the data set.
The X-ray source in laboratory-based micro-CTs is usually an X- ray tube with cone-beam geometry. In this case, geometric magnification occurs, which highlights the importance of the source to object and source to detector distances. The magnification (M) can be calculated as follows:
M¼SDD SOD
For the same comparability and reproducibility, the Hounsfield unit (HU) was introduced, which is also termed as the CT value. The HU value of water is 0 and that of air is1000. The HU value of a material can be calculated as follows:
HU¼100*
m m
waterm
waterm
airwheremis the LAC of the sample,mwateris the LAC of water, andmair
is the LAC of air.
The image quality is influenced by the voltage and current of the X-ray tube. Other important parameters are the rotation rate, the exposure time, and the quality of the sample. The detector system and the applied reconstruction algorithm can also affect the quality.
For optimizing the image quality, the proper mounting of the sample is crucial because even a small displacement of the sample can introduce serious artifacts.
1.2.3. Resolutionelimits and possibilities
The resolution can be calculated with the following equation.
R¼d Mþ
11
M
*s
Here,Ris the size of the voxel,dis the resolution of the detector, Mis the magnification, ands is the size of the focal spot of the source. With different types of CTs (e.g. industrial, medical, micro- CT, nano-CT, X-ray microscopy) allowing different sample size and resolution, there are multiscale opportunities with CT. The typical resolution of medical, industrial, micro-CT, and nano-CT scanners is 70e1000 mm, 5e150 mm, 1e100 mm, and around 0.5 mm [26], respectively. With X-ray microscopy, resolution less than 100 nm is also achievable.
The resolution improves with decreasing pixel size but only to the point where the pixel size reaches the diameter of the focal spot. Although the pixel size could be smaller than the focal spot in theory, the actual resolution will not improve [27]. The size of the focal spot increases with the applied X-ray tube power. In systems with cone-beam geometry, the effective resolution of micro-CT images depends greatly on the size and shape of the sample.
Table 1
Typical advantages and drawbacks of the discussed 3D imaging modalities.
Characterization method Pros Cons
Confocal optical microscopy Cost effective, non-destructive Only transparent samples, limited penetration depth
Electron tomography High resolution Small sample size
Photoacoustic tomography Non-destructive Low resolution
Neutron tomography Good contrast for low-Z materials Costly, not readily available, highly trained operator required Magnetic resonance imaging Non-destructive, excellent contrast in soft
tissues
Not suitable for ferromagnetic materials, radio frequency (RF) transparent sample needed
3D scanning electron microscopy
High resolution Destructive, labor-intensive, sectioning required, not suitable for delicate samples Computed tomography Non-destructive, broad variety of samples Costly, not ideal for high Z materials
Table 2
Examples of sample types requiring a combination of 3D imaging techniques.
Task Ideal combination
Materials with highly different Z CTþneutron tomography Materials with highly different pore sizes CTþSEM
Biological samples CTþMRI
Samples with greatly varying feature sizes CTþSEM
CT, computed tomography; SEM, scanning electron microscopy; MRI, ,magnetic resonance imaging.
arhelyi et al. / Materials Today Advances 8 (2020) 100084 3
Cylindrical samples are optimal forfixed X-ray sourceþfixed de- tector geometries because imaging artifacts are unavoidable for asymmetrical sample shapes. Synchrotron X-ray sources can pro- vide parallel, monochromatic, highflux beams for superior image quality.
Fig. 2presents an overview of the operating principle of X-ray tomography, the characteristic length scales of the currently available CT methods, the main do's and don'ts of micro-CT sample choices, and most important perturbations compatible with in situ micro-CT measurement.
Similarly to many characterization methods, temporal and spatial resolution is inversely related in a micro-CT experiment.
However, unlike most techniques (e.g. electron microscopy, spec- troscopies, X-ray diffraction, and so on), micro-CT inevitably in- volves the physical movement of the sample. High spatial resolution is only achievable by using a large number of slices that requires many sample motion steps. To avoid motion artifacts (refer following paragraphs), it is necessary to wait some for time after each rotation, and even very bright X-ray sources (e.g. synchrotron radiation) are unable to fully compensate for the time lost here.
Therefore, very fast, quasi real-time measurements lack the high quality and resolution of standard micro-CT imaging and vice versa: measurements with good resolution can take several hours.
It is an accepted practice in the field to circumvent this byfirst taking high resolution, high quality images to evaluate the detailed structure of the sample and then acquiring a series of lower quality
‘fast’images to monitor ongoing inner processes or changes in the investigated systems in situ.
1.2.4. Imaging artifacts
Many factors can introduce artifacts at various stages of the micro-CT measurement, but most of these artifacts are normally corrected in the image reconstruction step to some extent. The samples have intrinsic attributes that can lead to imaging errors. For example, wet samples can suffer shape alterations caused by drying
during imaging. This can be prevented by the airtight sealing of the samples. High Z contrast is an important criterion for high-quality X- ray imaging. Too high contrast, however, is apt to cause streak ar- tifacts. This effect mainly appears parallel to large areas offlat sur- faces; therefore, it is advisable to avoid such sample geometries.
Very light and thin samples can shift because of the rotating motion of the sample holder, resulting in so-called motion artifacts.
These can be avoided by adding a short waiting period after each rotation step. Inadequate sample mounting and any off-axis movement of the sample holder besides the rotating motion (e.g.
wobbling of the rotation stage) also causes artifacts. These motion artifacts can be corrected if reference images are taken to monitor the incidental movements. The importance of appropriately small rotation step size must be emphasized because undersampling is one of the main causes of imaging artifacts. The more asymmetric the sample, the more issues are caused by undersampling. For an accurate reconstruction of the sample, the precise definition of the rotation axis is indispensable; the incorrect definition of the reconstruction center leads to the appearance of tail-like artifacts.
Beam hardening appears when polychromatic X-ray radiation is used. Because the softer components of the radiation are absorbed more easily, the attenuation cannot be described by a linear coef- ficient. This effect worsens with increasing sample thickness and can be eliminated by using appropriatefilters. The most commonly used cone-beam geometry itself is a source of error because in this setting only a single slice (the middle one, aligned with the cone axis) is imaged perfectly. In this plane, the imaging is practically performed by a fan beam. Consequently, only the middle line of the detector gets information exclusively from one sample slice and all the others receive combined information from many slices. There- fore, the reconstruction of these off-axis slices is more uncertain.
This effect worsens, the further away we get from the middle slice.
Contamination of the detector surface or the failure of even a single detector element can introduce ring artifacts, thus causing inferior image quality. Ring artifacts are routinely corrected during
Fig. 2.A micro-CT cheat sheet prepared using actual images of a commercial dice recorded in the authors' laboratory. In situ measurement possibilities are limited only by innovativeness in measurement cell design. Thus, custom-made equipment for, for example, electrical testing, catalytic reactions studying wetting/wicking phenomena is also used.
CT, computed tomography.
arhelyi et al. / Materials Today Advances 8 (2020) 100084 4
reconstruction. A lot of imaging errors originating from the im- perfections of the X-ray source or the detector can be corrected by white and dark flat-field correction (images taken without the sample in thefield of view or with the source turned off). Phase- contrast phenomena are useful in some cases, but when they appear unintentionally, they are considered artifacts. They appear only in the case of monochromatic radiation and manifest in the sharpening of edges [28].
1.2.5. In situ investigations
The non-destructive nature of micro-CT makes it suitable for temporal investigations (time-lapse imaging or 4D micro-CT). For example, the effects of corrosive environment or different weather conditions on structural materials can be investigated or changes during the lifetime of an electronic device can be monitored. This type of investigation is called postmortem tomography: a sample is exposed to external impacts and then measured by micro-CT.
Repeated measurements are carried out on either different sam- ple pieces or on a single piece measured repeatedly over time. If the sample is removed from the CT instrument to apply changes, the method is called ex situ tomography, whereas in situ micro-CT refers to carrying out the investigation without the need to remove the sample by using specially designed testing stages. This
facilitates the identification of the exact changes in the structure and even allows individually monitoring the changes occurring in a single pore or in a predefined part of the sample.
In situ micro-CT measurements provide unique possibilities in manyfields, especially in material design and development. The two main types of in situ investigations are interrupted and continuous [29]. In case of interrupted in situ tomography, the sample is exposed to a certain impact, then for the time of the measurement, the sample is‘frozen’into this state, after which it can be exposed to changes again. For example, the sample is compressed with a certain force and a measurement is performed, afterward the force is increased and another CT measurement is performed, and this is repeated for several cycles. Mechanical tests can be compressive or tensile measurements, as well as indentation or bending tests. Changes in shape, size, and porosity, as well as crack initiation and propagation as a result of mechanical impact are readily investigated this way. One of the main advantages of in situ micro-CT is its ability to provide information about the exact changes in the structure. This eliminates the need for additional characterization by other methods and thus reduces the required sample size. Moreover, it is also possible to follow the exact changes a specific external force has on structural features and determine if the sample deforms uniformly or not. Interrupted in situ Fig. 3.Brushing-induced assembly forflexibly aligning 1D micro/nanofibers and structural characterizations. (a) Schematic illustration of the brushing-induced assembly method for aligning Hydroxyapatite (HA) microfibers on a heated substrate. (b) SEM image showing the surface of the HA-SAfilm with unidirectionally aligned HA microfibers; the yellow arrow denotes the brushing direction. The inset is a digital image of thefilm. Scale bars: 50mm and 5 cm (inset). (c) Nano-CT image of the HA-SAfilm with unidirectionally aligned HA microfibers. Scale bar: 10mm. (d) Absorbance curve of the HA-Sodium Alginate (SA)film with unidirectionally aligned HA microfibers, showing the typical peak value due to the birefringence effect. Note that the angle values labeled on the abscissa only represent the rotated angle range (0e90) of alignedfilm and do not indicate the real-time deviation angle between alignment direction and polarizing directions. When the alignedfilm was rotated to around 45, the peak value of absorbance appeared. Actually the deviation angle between alignment direction and polarizing direction (one of the two polarizers) was around 0rather than 45at this moment, demonstrating the largest absorption. (e) X-ray diffraction pattern of the HA-SAfilm with unidirectionally aligned HA microfibers. (f) Schematic illustration showing the programmed and continuous brushing procedure with each brushing process twisting at a predefined deviation angle for designing a complicated twisted plywood structuralfilm. (g) Cross-sectional SEM image of the obtained HA-SA film prepared by the programmed and continuous brushing procedure, showing obviously twisted plywood structure. Various colored arrows represent gradually twisted mi- crofiber lamellae. Scale bar: 20mm. (h) Cross-sectional SEM image of the xonotlite nanowire (20 wt%)-SA compositefilm prepared by the continuous and crossed brushing pro- cedure, showing ~90cross-stacked xonotlite nanowires in an SA matrix. Scale bar: 2mm. (i) Cross-sectional SEM images of the xonotlite nanowire (20 wt%)-SA compositefilm prepared by the programmed and continuous brushing procedure with each brushing process twisting at a predefined ~30deviation angle, showing distinct periodically helical structure. Scale bars: 20mm and 2mm. Copyright©The Author(s) Si-Ming Chen, Huai-Ling Gao, Yin-Bo Zhu, Hong-Bin Yao, Li-Bo Mao, Qi-Yun Song, Jun Xia, Zhao Pan, Zhen He, Heng-An Wu, Shu-Hong Yu 2018. Published by Oxford University Press on behalf of China Science Publishing&Media Ltd. SEM, scanning electron microscopy.
arhelyi et al. / Materials Today Advances 8 (2020) 100084 5
investigations can also be used with a gradual thermal profile to determine shrinkage, thermal expansion, or freezing characteristics.
In continuous in situ tomography, processes are monitored in quasi real time. This assumes a short image acquisition time because even slight changes in the structure during measurement can introduce serious artifacts upon the reconstruction and thus decrease the final image quality. Fortunately, software post- processing offers an opportunity to compensate for artifacts caused by motion and improve the quality of the reconstructed images, and this makes investigating dynamic processes possible [30].
Synchrotron X-ray sources are particularly well suited for contin- uous in situ tomography because the high photon flux reduces micro-CT image acquisition times to seconds. This allows the in operando investigation of electrochemical cells, batteries, fuel cells, and other electronic devices. In situflow micro-CT systems offer insight into oil recovery from rocks or gas storage capacity assessment.
2. Applications
CT imaging traditionally served medical purposes, but with the spread and improvement of the technique, other applications came into view. Medicine, food chemistry, dentistry, geoscience, life sci- ences, petroleum geology, scaffolds, building materials, nanotech- nology, additive manufacturing, and tissue engineering are just a few examples of the possiblefields of micro-CT application.
The primary information from micro-CT is the difference in X- ray attenuation, and the resulting direct quantitative outcome is the absorption map (2D or 3D) that can be enhanced by postprocessing.
The presence of pores, cracks, and structural errors can be verified, and the 3D inner structure of samples can be investigated. In this sense, micro-CT is a qualitative diagnostic tool. However, quanti- tative data are also obtainable: porosity, pore size distribution, connectivity of pores, shape, size and orientation of individual pores/objects/phases/regions, spatial distribution, volume fraction, and other density variations can be determined [31].
While appreciating the visual stimulation of 3D reconstructions, it is important to remember that they are based solely on X-ray attenuation contrast. Application fieldespecific meaning is bestowed upon the differences only later, and vastly different in- terpretations of the same observation are possible depending on what the images actually represent. For example, pores in bricks are normal and important for thermal insulation and freeze tolerance, while identically sized pores in a metallic car part can reveal severe manufacturing errors. Therefore, it is with the critical interpreta- tion of the obtained information that real material science in micro- CT begins.
2.1. Bio(inspired) materials
The term‘biomaterial’is a very generic one. It can refer to any material that is designed to interact with a biological system (often as part of a medical treatment). When materials science turns to nature for ideas to create new types of materials and improve the quality and applicability of existing ones,‘bioinspired’materials are the result; when inspiration turns into direct plagiarism, we create
‘biomimetic’materials. Micro-CT investigation can provide valuable information about each class. For example, micro-CT is a very capable tool for investigating bone formation/regeneration around implants. Cohen et al. [32] examined the bone growth around a solid implant and the bone penetration into a porous implant in the rabbit femur. X-ray imaging was also used successfully to reveal inferior screw stability in an implant [33] and in revealing the 3D structure of the bone to possibly create a superior bone-mimicking
material [34]. Several features of porous bioceramic scaffolds were compared with the bone tissue by micro-CT, and a metric was created for the comparison of scaffolds to the bone in an attempt to help the fabrication of bone-like ceramics [35]. Bioscaffold design and investigation by micro-CT was recently reviewed by Cengiz et al. [36]. Some other notable examples of micro-CT applications at the interface of the live world and materials science include dentistry (where it can help improve dentalfillings, crowns, and implants) and artificial organ design (assisting cardiovascular en- gineering and bioinspired design) [37].
Biomimetic materials are designed to replicate biological phe- nomena for scientific purposes. To truly mimic the beneficial fea- tures of various biological systems, it is imperative to learn their 3D structure.Fig. 3gives a representative example for creating a bio- mimetic twisted plywood structural material [38], and the recent work of du Plessis and Broeckhoven [39] reviews the biomimicry aspects of micro-CT in detail.
Micro-CT application examples are plenty for functional bio- mimetics as well. The morphological characterization of a beetle wing was helpful in creating artificial insect-sized wings for micro air vehicles [40]. X-ray imaging turned out to be particularly useful in mapping the microstructure of the wings, their vascular network, theflight muscles, and the wing joints [41]. Bioinspired artificial body armor was created by the micro-CT study, reverse engineering, and 3D printing of an extinct armadillo-like mammal species [42]. Data obtained from the micro-CT investigation of tree joints were used to create biomimetic aerospace composite joints with improved mechanical properties. The study showed that there is a porosity difference between the parts experiencing different levels of stress in tree joints. The fabricated biomimetic joints tolerated 27% higher bending load without any adverse effects in tensile or compressive strength [43]. In 2016, Frank et al. [44] have suggested a protocol for biomimetic design and demonstrated it by 3D printing a sediment sampler inspired by the micro-CTebased 3D model of the jaw of a sea urchin (also known as Aristotle's lantern). Later, a bionic hydraulic system was designed on the basis of a micro-CTebased 3D model of the joints in spider legs [45], and highly sensitive and directional acoustic sensors were inspired by the micro-CTederived microstructure of the hearing organ of Ormia ochraceaflies [46].
Interestingly, in situ micro-CT is also applicable in functional biomimetic material research. In 2018, Wang et al. [47] reported the in situ compression stress testing of pomelo peel and used the micro-CT insight into its hierarchical structure to understand its outstanding stress resistance, damping capability, and energy ab- sorption properties.
2.2. Structural materials
Micro-CT is widely applicable for the characterization of struc- tural materials both on a small scale, such as 3D printed objects, and on bigger samples, such as building materials, for example, cement or concrete. It is particularly well suited for investigating fatigue-induced structural changes. Chowdhury et al. [48] deter- mined the micro-mechanisms of damage in carbon-carbon com- posites for application in the aerospace industry. The micro-CT evaluation helped them understand the crack advancing mecha- nism, which is an important step in improving the composites and finding the ideal microstructure [48].
Porosity analysis is one of the most popular applications of micro-CT as it yields both qualitative (shape, size, distribution) and quantitative (porosity, connectivity) information about the open and closed pores in micrometer scale. This is of pivotal importance for structural materials where even a slight change in porosity or an asymmetrical pore distribution can lead to huge differences in arhelyi et al. / Materials Today Advances 8 (2020) 100084
6
mechanical properties and behavior of the materials. Failure visu- alization can help determine the cause of the failure and improve the material properties, and micro-CT images can be inputs for 3D simulations, for example, stress distribution and possible failure site modeling [49]. Filler aggregation and fatigue behavior (crack formation and propagation) of carbon black (CB) or silica-rein- forcedfilled rubber materials were also visualized successfully by micro-CT [50].
The discontinuities, pores, fractures, and inaccuracies occurring during the 3D printing process are typically in the micrometer- millimeter scale, which makes them very well suited for micro-CT examination. Moreover, micro-CT characterization is a valuable element of method development in additive manufacturing; it helps in thefine tuning of the printing parameters.
Besides the most common polymers, Polylactic Acid, Acryloni- trile Butadiene Styrene, Polyethylene Terephthalate, Polycarbonate (PLA, ABS, PET, PC), ceramics, concrete, and even metals [51] can be 3D printed today, and they are all examinable by micro-CT. In an interesting recent study, Wu et al. [52] designed and fabricated gradient porous Tie6Ale4V specimens by 3D printing (electron beam melting) and studied their mechanical properties. These materials can be used as implants; they have regions with differing porosities to endure the differing stress levels experienced by various regions of bones. With the help of micro-CT, they couldfind the interface mismatches, redesign the specimens, and thus improve their mechanical strength [52]. We refer to the review by du Plessis et al. [53] for the in-depth coverage of the additive manufacturing topic.
Cement and concrete are among the most researched building materials. Studies focusing on the investigation of these materials with the help of micro-CT are abundant, and specific reviews are available [54e56]. The most important micro-CT derived structural parameters are porosity, density, and phase distribution. The
resulting images can be used as input for 3D simulations [20], and temporal investigation allows the monitoring of damage evolution as well.
A key issue in building material development is strengthening the materials while lowering their density, and lightweight cement foams are good candidates for this. Their fracture initiation and propagation mechanism was recently investigated by in situ micro- CT [57] that revealed a clear relationship between the appearance of cracks and the presence of standard K15 and K46 microspheres.
The non-destructive nature of micro-CT is particularly valuable in building material characterization because it makes examining the same sample repeatedly over the time possible; thus, we can follow the changes occurring during, for example, cement hydra- tion, binding/curing/aging of the concrete, or freeze-thaw cycles in mortars [58]. Micro-CT can be used to differentiate between cement paste and corrosion products close to a rebar in reinforced concrete [59], and the damage caused by sulfate attacks in concrete can also be visualized [60].
2.3. Energy and environment 2.3.1. Porous rocks
Micro-CT studies are extremely important in energy and envi- ronment applications because these rely often on understanding the 3D pore structure andfluid migration dynamics in solid objects.
For example, images from a time lapse micro-CT study performed in a high pressure in situflow cell could be used as input for the simulation of capillary CO2 trapping in sandstone relevant for geological storage development [61]. The effect of injection pres- sure on gas storage in sandstone gas saturation was investigated by micro-CT using the differences between the X-ray absorption characteristics of nitrogen gas and water during displacement in the pores [62]. In hydraulic fracturing for geothermal energy Fig. 4.Horizontal cross-sectional slices through the plug (diameter¼1400 voxel) and the image processing workflow of wet and dry images taken during the water-wet plug flooding (slice number¼135, 24.92 mm from the inlet). (a) Filtered dry reference image; (b) pore map obtained from thefiltered dry image, where the pore is transparent and the grain is black; (c)filtered wet image, where the darkest phase is oil, the light gray phase is brine, and the intermediate phase is solid particle; (d) combined wet image, where oil, brine, and the solid are dark gray, light gray, and black, respectively; (e) segmented wet image (brine: blue; oil: red; and grains: gray); (f) three-dimensional rendering of the oil phase. Brine and rock are transparent for effective visualization. Copyright©2018 Junjian Li et al.
arhelyi et al. / Materials Today Advances 8 (2020) 100084 7
extraction, the micro-CT investigation of the microstructure and fracture propagation in a high temperature and high pressure environment has led to the better understanding of the underlying mechanisms [63].
It is possible to conduct in situ micro-CT studies on drill core samples and model rock formations to assess oil recovery options,
survey fractured hydrocarbon reservoirs, investigate the remaining oil saturation, study the impact of spreading, and performflow experiments [64]. Understanding the multiphaseflow inside real- istic rock structures is crucial for oil recovery efficiency maximi- zation. Micro-CT was used successfully for understanding fluid distribution in sandstone at different saturation states. 2D Fig. 5.(a) 3D reconstruction of the pouch cell in its fresh state. The LiCoO2electrode is displayed as gray, and the copper current collector and tabs are shown in yellow. (b) 3D reconstruction showing the pouch cell after overcharge-induced thermal runaway. Copper and LiCoO2phases are labeled as yellow and aluminum is shown in blue. Samples were taken from regions A and B for further analysis using micro-X-ray CT. Republished with permission of Royal Society of Chemistry, from Investigating lithium-ion battery materials during overcharge-induced thermal runaway: an operando and multi-scale X-ray CT study, Donal P. Finegan, Mario Scheel, James B. Robinson, Bernhard Tjaden, Marco Di Michiel, Gareth Hinds, Dan J. L. Bretta, Paul R. Shearing, 18, 2016; permission conveyed through Copyright Clearance Center, Inc. 3D, three-dimensional; CT, computed tomography.
Fig. 6.Volume-rendered SGL 29BC gas diffusion medium (GDM) showing microporous layer (MPL), gas diffusion layer (GDL), and void with separate renderings of individual components at (a) 0%, (b) 34%, and (c) 41% compression. The z-axis indicates the GDM through-plane direction; the y-axis corresponds to the in-plane direction. Reprinted with permission from Robert W. Atkinson, III, Yannick Garsany, Benjamin D. Gould, Karen E. Swider-Lyons, and Iryna V. Zenyuk ACS Applied Energy Materials 2018 1 (1), 191e201https://
doi.org/10.1021/acsaem.7b00077. Copyright (2018) American Chemical Society. MPL, microporous layer; GDL, gas diffusion layer.
arhelyi et al. / Materials Today Advances 8 (2020) 100084 8
saturation maps were made from simple radiographs during flooding, and after each sequence, 3D X-ray imaging was performed [65]. In a study performed on the porous rockebrineeoil ternary system, the oil cluster dynamics were revealed by micro-CT during drainage and imbibition. The authors have found that‘wettability, pore size distribution, and pore connectivity have a strong impact onfluid saturations, cluster morphologies, and potentially cluster size distributions’ [66]. Fig. 4 presents characteristic horizontal cross-sectional slices obtained by micro-CT in this study.
2.3.2. Energy storage
Micro-CT imaging allows the investigation of the complex inner structure of energy storage devices in high detail from the smallest batteries to whole fuel cells and can help in quality control and the detection of faulty parts. Beyond simple 3D imaging, micro-CT holds a greater advantage because devices can be investigated in operando conditions over time. This is typically made possible by using synchrotron X-ray sources where the highflux of the syn- chrotron source allows 3D image acquisition in seconds [67].
The performance loss of energy storage devices over time is due to changes in their microstructure. Therefore, visualizing their microstructure in 3D e preferably repeatedly over time or in operando conditione is crucial in their development. Originally synchrotron radiation was needed for electrical device character- ization but advances in laboratory-based micro-CT systems rendered them more and more suitable for such work. Nowadays, the main areas of investigation in thefield of energy storage are batteries (especially Li-ion) and fuel cells, mainly polymer-elec- trolyte and solid oxide fuel cells (SOFCs) [68].
Micro-CT was successfully used to investigate inhomogeneities in the microstructure of Li-ion battery electrodes to determine their
role on the battery performance [69]. The method is particularly useful to visualize the effects of extreme conditions. For example, nail penetration tests were carried out to investigate the short circuits and the changes in the 3D battery structure [70]. In another work, a Li-ion 18,650 battery cell was exposed to axial compression tests to understand its failure mechanism. The obtained micro-CT data were in good agreement with thefinite element model sim- ulations [71]. One of the early works in thefield is that of Finegan et al. [72] who studied the overcharge-induced thermal runaway in Li-ion battery materials by in operando CT and facilitated the even better understanding of the failure process by postmortem micro- CT scans (Fig. 5).
Micro-CT also proved its merits in the characterization of Li-iron phosphate batteries postmortem after high rate cycling [73] and helped optimize the electrode microstructures of Li-sulfur battery electrodes [74]. The depletion region in the sulfur composite cathode was very clearly observable even after 2 cycles at 0.15 mA cm2.
An important noneLi-ion batteryerelated micro-CT application is the optimization of the absorptive glass mat separator, a pivotal component of valve-regulated lead acid batteries [75]. Shukla et al [76] have recently used micro-CT to develop a comprehensive, predictive model of hydraulic tortuosity for this importantfield.
2.3.3. Energy conversion
The performance of fuel cells is largely determined by the microstructure and spatial distribution of components in the gas diffusion layer (GDL), the microporous layer, and the catalyst layers [77]. Each of these components can be studied by micro-CT [78] even though in operando fuel cell design can be challenging [79].
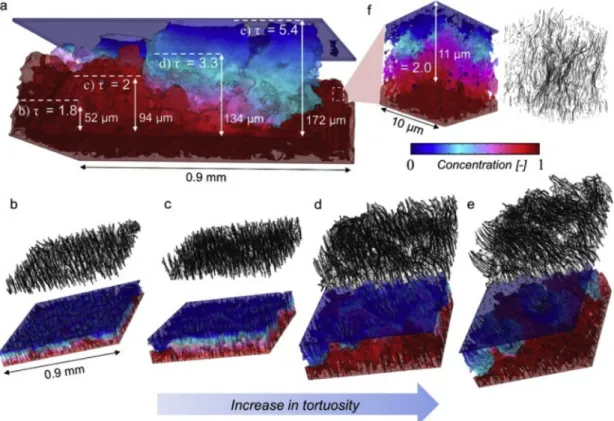
Fig. 7.Study of tortuosity as a function of sample thickness with micro-CT starting from the MPL interface, where (a) shows full sample thickness and each subdivision. (bee) Samples of varied thicknesses. (f) Mesoscale tortuosity obtained with nano-CT. Reprinted from Applied Catalysis B: Environmental, Vol. 237, Alexey Serov, Andrew D. Shum, Xianghui Xiao, Vincent De Andrade, Kateryna Artyushkova, Iryna V. Zenyuk, Plamen Atanassov, Nano-structured platinum group metal-free catalysts and their integration in fuel cell electrode architectures, Copyright (2018), with permission from Elsevier. CT, computed tomography; MPL, microporous layer.
arhelyi et al. / Materials Today Advances 8 (2020) 100084 9
The effect of GDL microstructure on mass transport in a proton exchange membrane fuel cell was successfully investigated by in situ micro-CT compressive tests [80]. In the work illustrated in Fig. 6, the gas diffusion media of a polymer electrolyte fuel cell (PEFC) were compressed in a micro-CT and the changes in the microstructure and the performance were monitored [81].
In another work, to complement the results of oxygen concen- tration measurement, 3D X-ray microanalysis was conducted on the diffusion media of a PEFC [82].
Micro-CT is very well suited to monitor water distribution inside a GDL that affects the performance of PEFCs to a large extent [83].
Water formation could also be observed in alkaline exchange membrane fuel cells (platinum group metalefree catalyst) in operando conditions [84]. The mainfinding of these studies was that large pores in the GDL are undesirable because of water pooling and blocking of active sites [85]. The wetting and evapo- ration of a carbon cloth type GDL by aqueous alcohol mixtures was systematically studied very recently. Micro-CT was crucial in this work to link the observed behavior to GDL structural features [86].
Fuel starvation caused degradation can be an important limiting factor of the lifetime of fuel cells. Micro-CT measurements have recently helped Yezerska et al. [87] to determine the influence of starvation of the thickness of the cathode and the anode catalyst layers in high-temperature proton exchange membrane (HT-PEM) fuel cells.
The effects of hot-pressing parameters on the microstructure of PEFCs were investigated. Micro-CT combined with electrochemical measurements helped in the development of optimized membrane electrode assemblies (MEAs) [88], and Serov et al. [89] have un- covered the relationship between MEA thickness and tortuosity as shown inFig. 7.
Another notable multiscale approach was published by Meyer et al. [90] who advantageously combined micro-CT with nano-CT, transmission electron microscopy, and helium-ion microscopy to investigate PEFC MEA structure.
A good example of micro-CT studies focused on fuel cell cata- lysts was published by Roy et al. [91] about in situ and in operando MEA measurements with integrated nickel-copper catalysts sup- ported on CB. From the CT results, the hydrophobicity of the NiCu state in the NiCu/CB system was determined that has led to improved water distribution and could explain the high catalytic activity of the composite [91]. Cracks in the catalyst layer, the re- sults of degradation processes, and mechanical defects can also be visualized by postmortem (ex situ) micro-CT MEA analysis [92].
As for non-polymeric fuel cells, it is worth mentioning that a SOFC anode with hierarchical microstructure was characterized by a multiscale 3D X-ray tomography method to help and understand its operation mechanism. The unique microstructure led to a 250%
increase in the mass transport and a 2e3 orders of magnitude in- crease in the permeability. These results can help to design and optimize hierarchical electrode microstructures [93]. Micro-CT has helped infinding the connection between performance loss and changes in microstructure (carbonate scale deposition) in microbial
fuel cell biocathodes that were measured were in different stages of operation [94].
It would be excellent to investigate the layered structure of solar cells by micro-CT to observe, for example, perovskite deterioration or transport layer inhomogeneities. Unfortunately, the typical solar cell layer thickness tends to be too thin for micro-CT to resolve correctly, especially because the image quality is worsened by ar- tifacts originating from the highly asymmetrical shape of the layer.
Nevertheless, it seems reasonable to anticipate progress in thisfield in the next few years.
2.3.4. Filtration
Micro-CT is very useful in the design of efficientfilters and in improving filter models for more accurate simulations. For example, it revealed local changes in porosity through the whole thickness of afibrousfilter and captured the structure-dependent behavior of deposits: these do not leave the filter, rather they gradually move to the deeper regions [95]. It was also possible to study the effects of microstructure on aerosol deposition in high efficiency particulate air (HEPA)filters [96], assess liquid distribu- tion in thefilter during liquid aerosolfiltration, and uncover the effects of filtration velocity on clogging [97]. Water filtration membranes are also accessible for micro-CT analysis. A porous membrane with well-defined microstructure was designed and monitored by micro-CT. It offered improved antifouling ability because of the site-specific silver decoration of the polyethylene ionomer membrane [98].
3. Outlook
It is without doubt that micro-CT is becoming a mainstream materials science and material development tool today. Its chief merits are its non-destructive nature that allows temporal investi- gation, the relative ease of combining 3D structural characterization with real-time in situ perturbations, and the natural link between computational materials science and CT-based models. We can expect further development in the following directions. The tech- nical improvement of the hardware (e.g. more powerful and brighter X-ray tubes, better detectors) will bring about better res- olution and shorter exposure times, thus narrowing the gap be- tween synchrotron based and laboratory-based units. This will be particularly relevant for more widely accessible in operando studies.
The spreading of benchtop laboratory CT units is not hindered by unmet technological challenges, as adequate small-size X-ray sources, detectors, and precision sample stage mechanics are already available. Rather the main limiting factor appears to be the physical size of the unit. Lead plating is necessary to protect the operator from X-ray exposure, and a heavy base plate (e.g. granite slab) is required for mechanical precision. State-of-the-art bench- top CT units are only slightly larger in volume than an upmarket UV-Vis spectrometer but they are much heavier (Table 3.). Note that the performance metrics of the units listed inTable 3are clearly inferior to those of‘full size’micro-CT instruments that tend to have Table 3
An overview of commercially available benchtop micro-CT instruments. Specifications are taken from the brochures available from the manufacturer’s homepages unless noted otherwise.a
Instrument Dimensions (mm) Weight (kg) Max. tube voltage (kV) Voxel size (mm)
Bruker Skyscan 1273 1250815820 400 130 <3
Procon CT-Compactb Not stated explicitly 500 160 3.5
Rigaku CT Lab HX 980700580 380 130 2.2
Sanying nanoVoxel-1000 900500650 500 110 2
Shimadzu inspeXio SMX-90CT Plus 830501587 250 90 Not stated explicitly
aWell-known full-scale CT manufacturers GE, Siemens and Yxlon do not feature any comparable benchtop units on their respective homepages as of May 8, 2020.
bData collected from secondary sources because the datasheet directly available from the homepage of the manufacturer does not cite specific values.
arhelyi et al. / Materials Today Advances 8 (2020) 100084 10
the volume of a large wardrobe, weight 2e4 tons, have X-ray tubes going above 190 kV, and offer submicrometer resolution. The footprint of current benchtop micro-CT systems is unlikely to decrease significantly in the near future. However, we can expect improvements in X-ray tube voltage and resolution, and thus the benchtop micro-CTs of the near future are likely to be very capable laboratory-based unitseit is just that high performance and true portability in a single package are not in sight yet.
The smallest commercially available CT scanner today is the ProCon CT-Portable. Measuring 350 300 230 mm and weighting 20 kg, this unit can be carried by a single person;
therefore, its portability is unquestionable. However, the severe trade-offs in the X-ray tube voltage (50 kV) and resolution (voxel size<18mm) narrow the materials science applicability of this unit mostly to the non-demanding 3D imaging of soft materials.
Software developments will improve automated image analysis including advanced thresholding by artificial intelligence, reduce analysis errors introduced by the human operator, and provide workarounds for eliminating image artifacts. A parallel develop- ment direction with a strong mechatronic focus will be the improvement of auxiliary systems such as faster and moreflexible robotic sample manipulation devices and novel in situ measure- ment cells. It is important to emphasize that even with the micro- CT hardware and software available commercially right now, there are vast unexploredfields of applications that are readily accessible by custom-built in situ cells. We believe that photovoltaics, high entropy materials, foodstuff analysis, heterogeneous catalysis, ad- ditive manufacturing, and fibrous composite research will be among the first areas where exciting new micro-CTebased de- velopments will appear in the near future.
Declaration of competing interest
The authors declare that they have no known competing financial interests or personal relationships that could have appeared to influence the work reported in this paper.
Acknowledgment
This authors acknowledge the financial support by the Hungarian National Research, Development and Innovation Office through the GINOP-2.3.3-15-2016-00010 and K126065 projects.
References
[1] A.J. Sederman, Magnetic resonance imaging, in: Ind. Tomogr, Elsevier, 2015, pp. 109e133,https://doi.org/10.1016/B978-1-78242-118-4.00004-6.
[2] S. Zaefferer, S.I. Wright, D. Raabe, Three-dimensional orientation microscopy in a focused ion beamescanning electron microscope: a new dimension of microstructure characterization, Metall. Mater. Trans. 39 (2008) 374e389, https://doi.org/10.1007/s11661-007-9418-9.
[3] T. Hashimoto, G.E. Thompson, X. Zhou, P.J. Withers, 3D imaging by serial block face scanning electron microscopy for materials science using ultramicrot- omy, Ultramicroscopy 163 (2016) 6e18, https://doi.org/10.1016/
j.ultramic.2016.01.005.
[4] P. Ercius, O. Alaidi, M.J. Rames, G. Ren, Electron tomography: a three- dimensional analytic tool for hard and soft materials research, Adv. Mater.
27 (2015) 5638e5663,https://doi.org/10.1002/adma.201501015.
[5] M. Sun, D. Hu, W. Zhou, Y. Liu, Y. Qu, L. Ma, 3D photoacoustic tomography system based on full-view illumination and ultrasound detection, Appl. Sci. 9 (2019) 1904,https://doi.org/10.3390/app9091904.
[6] J. Deng, Y.H. Lo, M. Gallagher-Jones, S. Chen, A. Pryor, Q. Jin, Y.P. Hong, Y.S.G. Nashed, S. Vogt, J. Miao, C. Jacobsen, Correlative 3D x-rayfluorescence and ptychographic tomography of frozen-hydrated green algae, Sci. Adv. 4 (2018) 1e11,https://doi.org/10.1126/sciadv.aau4548.
[7] C.T. Badea, S.M. Johnston, Y. Qi, K. Ghaghada, G.A. Johnson, Dual-energy micro- CT imaging for differentiation of iodine- and gold-based nanoparticles, in:
Med. Imaging 2011 Phys. Med. Imaging, 2011, p. 79611X,https://doi.org/
10.1117/12.878043.
[8] S.C. Mayo, A.W. Stevenson, S.W. Wilkins, In-line phase-contrast X-ray imaging and tomography for materials science, Materials (Basel) 5 (2012) 937e965, https://doi.org/10.3390/ma5050937.
[9] J. Oddershede, Sø Schmidt, H.F. Poulsen, H.O. Srensen, J. Wright, W. Reimers, Determining grain resolved stresses in polycrystalline materials using three- dimensional X-ray diffraction, J. Appl. Crystallogr. 43 (2010) 539e549, https://doi.org/10.1107/S0021889810012963.
[10] P.R. Miller, S.C. Mayo, T. Gureyev, S.W. Wilkins, J. Sheffield-Parker, An SEM- based X-ray microtomography system, Microsc. Microanal. (2006) 1592e1593,https://doi.org/10.1017/S1431927606067420.
[11] E.H. Lehmann, A. Kaestner, C. Grünzweig, D. Mannes, P. Vontobel, S. Peetermans, Materials research and non-destructive testing using neutron tomography methods, Int. J. Mater. Res. 105 (2014) 664e670,https://doi.org/
10.3139/146.111053.
[12] P. Vontobel, E.H. Lehmann, R. Hassanein, G. Frei, Neutron tomography:
method and applications, Phys. B Condens. Matter 385e386 (2006) 475e480, https://doi.org/10.1016/j.physb.2006.05.252.
[13] G.N. Hounsfield, Computerized transverse axial scanning (tomography): Part I.
Description of system, Br. J. Radiol. 46 (1973) 1016e1022,https://doi.org/
10.1016/0360-3016(94)E0127-6.
[14] J.C. Elliott, S.D. Dover, X-ray microtomography, J. Microsc. 126 (1982) 211e213,https://doi.org/10.1111/j.1365-2818.1982.tb00376.x.
[15] B. Niemann, D. Rudolph, G. Schmahl, X-ray microscopy with synchrotron radiation, Appl. Optic. 15 (1976) 1883,https://doi.org/10.1364/AO.15.001883.
[16] A. Sasov, X-ray nanotomography, Dev. X-Ray Tomogr. IV (2004) 201e211, https://doi.org/10.1117/12.559009.
[17] W. Chao, J. Kim, S. Rekawa, P. Fischer, E.H. Anderson, Demonstration of 12 nm resolution fresnel zone plate lens based soft X-ray microscopy, Optic Express 17 (2009) 17669e17677,https://doi.org/10.1364/oe.17.017669.
[18] A. Sakdinawat, D. Attwood, Nanoscale X-ray imaging, Nat. Photon. 4 (2010) 840e848,https://doi.org/10.1038/nphoton.2010.267.
[19] S.R. Stock, X-ray microtomography of materials, Int. Mater. Rev. 44 (1999) 141e164,https://doi.org/10.1179/095066099101528261.
[20] A. du Plessis, W.P. Boshoff, A review of X-ray computed tomography of con- crete and asphalt construction materials, Construct. Build. Mater. 199 (2019) 637e651,https://doi.org/10.1016/j.conbuildmat.2018.12.049.
[21] Y. Arai, A. Yamada, T. Ninomiya, T. Kato, Y. Masuda, Micro-computed to- mography newly developed for in vivo small animal imaging, Oral Radiol. 21 (2005) 14e18,https://doi.org/10.1007/s11282-005-0024-5.
[22] A. Kohlbrenner, S. H€ammerle, A. Laib, P. Rüegsegger, A 3D microtomographic system with stacked fan-beam geometry, Nucl. Instruments Methods Phys.
Res. Sect. A Accel. Spectrometers, Detect. Assoc. Equip. 443 (2000) 531e539, https://doi.org/10.1016/S0168-9002(99)01045-1.
[23] R.T. Lopes, H.S. Rocha, E.F.O. De Jesus, R.C. Barroso, L.F. De Oliveira, M.J. Anjos, D. Braz, S. Moreira, X-ray transmission microtomography using synchrotron radiation, Nucl. Instruments Methods Phys. Res. Sect. A Accel. Spectrometers, Detect. Assoc. Equip. 505 (2003) 604e607, https://doi.org/10.1016/S0168- 9002(03)01157-4.
[24] Y.I. Nesterets, T.E. Gureyev, M.R. Dimmock, Optimisation of a propagation- based x-ray phase-contrast micro-CT system, J. Phys. D Appl. Phys. 51 (2018) 115402,https://doi.org/10.1088/1361-6463/aaacee.
[25] L.A. Feldkamp, L.C. Davis, J.W. Kress, Practical cone-beam algorithm, J. Opt.
Soc. Am. A. 1 (1984) 612e619,https://doi.org/10.1364/JOSAA.1.000612.
[26] A. du Plessis, C. Broeckhoven, A. Guelpa, S.G. le Roux, Laboratory x-ray micro- computed tomography: a user guideline for biological samples, GigaScience 6 (2017) 1e11,https://doi.org/10.1093/gigascience/gix027.
[27] J.E. Elkhoury, R. Shankar, T.S. Ramakrishnan, Resolution and limitations of X- Ray Micro-CT with applications to sandstones and limestones, Transp. Porous Media 129 (2019) 413e425,https://doi.org/10.1007/s11242-019-01275-1.
[28] S.R. Stock, MicroCT in practice, in: S.R. Stock (Ed.), Microcomput. Tomogr.
Appl., CRC Press, 2009, pp. 85e114,https://doi.org/10.1201/9780429186745.
[29] L. Salvo, M. Suery, A. Marmottant, N. Limodin, D. Bernard, 3D imaging in material science: application of X-ray tomography, Compt. Rendus Phys. 11 (2010) 641e649,https://doi.org/10.1016/j.crhy.2010.12.003.
[30] T. De Schryver, M. Dierick, M. Heyndrickx, J. Van Stappen, M.A. Boone, L. Van Hoorebeke, M.N. Boone, Motion compensated micro-CT reconstruction for in- situ analysis of dynamic processes, Sci. Rep. 8 (2018) 7655,https://doi.org/
10.1038/s41598-018-25916-5.
[31] E. Maire, P.J. Withers, Quantitative X-ray tomography, Int. Mater. Rev. 59 (2014) 1e43,https://doi.org/10.1179/1743280413Y.0000000023.
[32] D.J. Cohen, A. Cheng, K. Sahingur, R.M. Clohessy, L.B. Hopkins, B.D. Boyan, Z. Schwartz, Performance of laser sintered Tie6Ale4V implants with bone- inspired porosity and micro/nanoscale surface roughness in the rabbit fe- mur, Biomed. Mater. 12 (2017), 025021,https://doi.org/10.1088/1748-605X/
aa6810.
[33] D. Nakashima, K. Ishii, M. Matsumoto, M. Nakamura, T. Nagura, A study on the use of the Osstell apparatus to evaluate pedicle screw stability: an in-vitro study using micro-CT, PLoS One 13 (2018), e0199362, https://doi.org/
10.1371/journal.pone.0199362.
[34] H.S. Tuan, D.W. Hutmacher, Application of micro CT and computation modeling in bone tissue engineering, Comput. Des. 37 (2005) 1151e1161, https://doi.org/10.1016/j.cad.2005.02.006.
[35] G. Falvo D'Urso Labate, G. Catapano, C. Vitale-Brovarone, F. Baino, Quantifying the micro-architectural similarity of bioceramic scaffolds to bone, Ceram. Int.
43 (2017) 9443e9450,https://doi.org/10.1016/j.ceramint.2017.04.121.
arhelyi et al. / Materials Today Advances 8 (2020) 100084 11