Journal of Physics: Conference Series
PAPER • OPEN ACCESS
Non-destructive texture measurement methods for centreless X-ray diffractometers in reverse modified X (CHI) mode
To cite this article: V Mertinger et al 2019 J. Phys.: Conf. Ser. 1270 012012
View the article online for updates and enhancements.
This content was downloaded from IP address 178.171.2.149 on 14/08/2019 at 15:50
7th International Conference on Recrystallization and Grain Growth IOP Conf. Series: Journal of Physics: Conf. Series 1270 (2019) 012012
IOP Publishing doi:10.1088/1742-6596/1270/1/012012
Non-destructive texture measurement methods for centreless X-ray diffractometers in reverse modified (CHI) mode
V Mertinger, M Sepsi, M Benke
Institute of Physical Metallurgy Metalforming and Nanotechnology, University of Miskolc, Miskolc, Hungary
femvali@uni-miskolc.hu
Abstract. Conventional X-ray diffraction-based pole figure measurements have been carried on with dedicated instrument which are accompanied with certain limitations such as sample size, geometry, and no possibility for on-site measurements. These restrictions limit the availability of texture measurements to situations in which cutting a small sample from large parts is difficult or even not allowed at all. The present paper introduces new texture measurement method developed on mobile centreless X-ray diffractometers which are originally applied for residual stress measurements. The essence of this new method, named reverse modified mode is that it uses the data obtained by residual stress measurement to describe anisotropic characteristics, even to the determination of pole figure. Using this method, pole figures can be obtained with all the benefits of centreless diffractometers: no need for sample cutting, flexibility in case of large components with complex shapes, short measuring time and portability. The obtained pole figures are equivalent to the pole figures determined by conventional diffractometers. The presentation describes the measurement method and includes the validation with conventional pole figure measurements and provides instances of applications of the new technique.
1. Introduction
The definition of crystalline anisotropy, also known as texture, is the key in many technological and solid-state processes since many properties such as mechanical properties, deform-ability, magnetic properties, or several metallic processes such as plastic deformation, recrystallization are texture dependent. To control or to modify the texture is also crucial question during all thermomechanical treatments. The conventional techniques to measure crystallographic texture are based on neutron, X- ray or electron diffraction, which involve the determination of several pole figures and ODF (Orientation Distribution Function) for investigated materials. The general differences between these methods are the size of radiated volume and the spatial resolution [1-4]. Except for neutron diffraction, which is limited by source and the activation process, other methods are destructive. Sample cutting is usually necessary for conventional texture measurements by X-ray diffraction (XRD) and a very dedicated sample preparation technique is required for TEM (transmission electron microscopy) and electron backscatter diffraction (EBSD) investigations. The full 3D representation for crystallographic texture is given by the ODF which can be achieved by evaluation of a set of non-equivalent pole figures. Non- destructive determination of the pole figures by XRD method in many cases, such as when the test object is unique or valuable or when the sampling is forbidden by many other reasons can be beneficial [5-7].
The present paper introduces new texture measurement methods developed for mobile centreless X-ray
7th International Conference on Recrystallization and Grain Growth IOP Conf. Series: Journal of Physics: Conf. Series 1270 (2019) 012012
IOP Publishing doi:10.1088/1742-6596/1270/1/012012
2
diffractometers which are originally developed for residual stress measurements [8]. The pole figure measurements can be realized with centreless diffractometers in modified (CHI), (PSI) and (OMEGA) modes. Using these methods, pole figures can be obtained with all the benefits of centreless diffractometers: no need for sample cutting, flexibility in case of large components with complex shapes, short measuring time and portabilityű
2. Description of the new method
2.1. Scheme of beam paths of X-ray goniometers
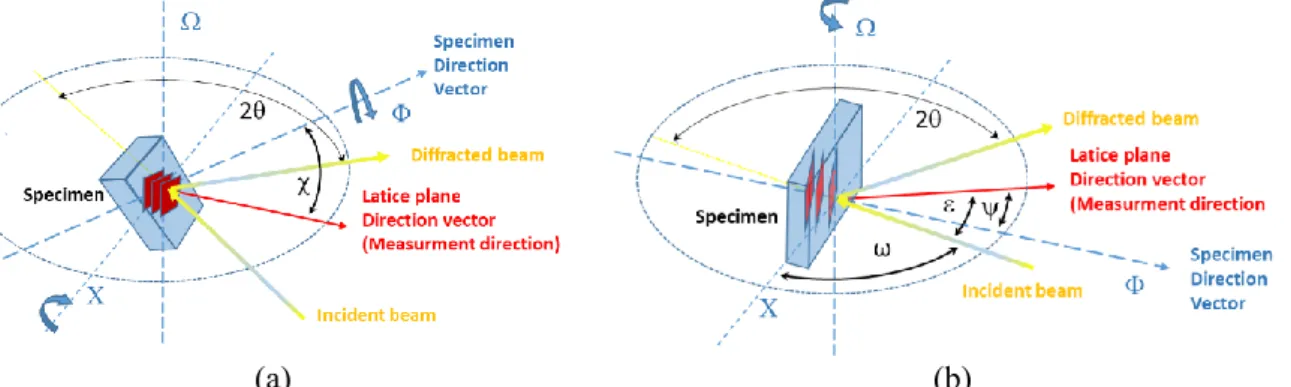
In general, three different modes can be distinguished based on goniometer tilting relative to sample: Ω (OMEGA), (CHI) or Ψ (PSI) and modified or modified . The term “Ψ mode” is widespread in Europe, while “ mode” is more commonly used in North America. The names refer to the axis around which the goniometer circle (holding the source and detectors) is tilted. Here, a universal nomenclature system (Figure.1.) is applied in which the three different modes can be univocally distinguished [9].
Axes are represented with Greek uppercase letters while tilting/rotation angles with Greek lowercase letters. The axis is the intersection of the plane of sample surface and the plane of the goniometer circle. Tilting around axis is indicated by the angle χ. It is the angle between the normal of the sample surface and the normal of the diffracting plane series (i.e, the measuring direction). The Ω axis lies within the plane of sample surface and it is perpendicular to the goniometer circle. The Ω axis is thus perpendicular to the plane of primary (incident) and diffracted beam. The ω angle is interpreted as the angle between the primary beam and the sample surface (or the axis). While rotating/tilting around Ω axis, angle forms between the measuring direction and the normal of the sample’s surface. The Φ (PHI) axis is normal to the sample surface. Rotation around Φ axis is marked with φ, which increases clockwise.
(a) (b)
Figure 1. General scheme of beam path, tilting axes and relevant angles of X-ray goniometers (a)0°, (b) =0°. [9]
2.2. Comparison of centreless and conventional diffractometers
Different setup of centreless diffractometer is available on the market. Such devices do not require sample cutting and virtually have no sample size limit. Those are designed to determine residual stress in a non-invasive manner even in surface mapping conditions. Mechanical stress can be represented by a stress tensor and, when is presence in materials resulting in variations of interatomic plane distances.
As the distances are modified along different directions in the crystal, the angle of diffraction satisfying the Bragg-condition changes. This situation results in a shift of reflections measured by the detector. In practice, the stress on the sample could be represented by a tensor, i.e., each orientation in the crystal lattice of the sample has its own independent value for strain, and shear stress could also be present. By collecting the diffracted X-ray beam with the sample rotated at different orientations along a particular angular direction referred to as the “tilt angle” , and by comparing the deviation or shift in diffraction angle with respect to the expected diffraction angle of an unstressed sample, the stress tensor can be characterized. Tilting and rotating is generally performed by modified or modes. In contrast, the
7th International Conference on Recrystallization and Grain Growth IOP Conf. Series: Journal of Physics: Conf. Series 1270 (2019) 012012
IOP Publishing doi:10.1088/1742-6596/1270/1/012012
diffraction cones are not distorted in the textured materials, but the intensity distribution on the cone surface will be different. In practice, this texture is often represented using a pole figure, in which a specified crystallographic axis (or pole) from each of a representative number of crystallites is plotted through stereographic projection, along with directions relevant to the processing history of materials.
During the determination of stereographic projection tilting and rotating of the sample is performed, conventional pole figure measurements are carried out in mode.
During operating the centreless diffractometer in contrast to conventional one the measured object is stationary while the diffractometer is tilted around the object. However, the main difference in stress and conventional texture measurement is not the tilting of the sample but the beam path. Therefore, the transition between the two methods (stress and texture test) is not obvious. While describing the solution of transition, axes, angles, directions regarding the centreless diffractometer system are distinguished by apostrophe (’) from the conventional ones. There are basically two ways to find the solution. First case is when the coordinate ( rotating and tilting angles) of the conventional pole figure is fixed and used to calculate the appropriate ’rotating and ‘ tilting angles to be applied on the centreless diffractometer. This modified method is described in detail in a previous article [9]. The other case is a much more convenient solution for the user, when the pole figure coordinates of the applied rotating and tilting angles of the centreless diffractometer (’, ’) are calculated. This is the reverse modified method and is described in this manuscript. The advantage of this method is that in this case stress values can also be determined from the measurement data, which in many cases can also provide useful information. To make the difference between the modified mode and the reverse modified mode easier to understand, we will use the same graphics and nomenclature. Figure 2 shows the beam path and the different set ups. The main parts of the conventional and the centreless diffractometer setup are indicated: C-collimator, A, B detectors, S0, S0’ incident beam, SA, SB, SA’, SB’ diffracted beams, mA, mB, mA’, mB’ -measurement directions or diffraction vector or normal of the plains in Bragg position.
2.3. Reverse modified mode
It is possible to determine the pole figure coordinates (, ) from the data obtained during residual stress measurements, if the position of the sample (- angle between the and ’or the physical rotation of the centreless diffractometer around the ’ axis), the value of the tilting (’) and the Bragg-angle (2) are known. The transition from the centreless system to the conventional one is not obvious, because of the different beam passes of the two systems. The pass of the measuring direction vector is represented by concentric cones series during operation in both systems. For simplicity, let us consider the length of the cone generatrix unity. The two rotating axes of the two cones series are perpendicular to each other (Figure 3.). Determination of the coordinates of the intersections (P at ’=0 and Q at ’0°,) is the crucial point when measuring pole figures with centreless diffractometers. The questions are the and
value at these positions. Equations 1-11 give the solution. Notice that the Ri value is difference between the modified and the reverse modified mode.
Since 2ψ’ is the complementary angle of 2θ’ (Figure 2.), thus, ψ’ can be calculated from the Bragg- angle (2θ’) by (1) [9].
ψ’= (180 − 2𝜃)/2 (1)
M’ is the perpendicular projection of mB’ on the tilting axis () and can be calculated according to (2) and Figure 3 [9].
𝑀′ = sin 𝜓′ (2)
U’ is the distance of P or Q from the and can be calculated according to (3) [9].
𝑈′ = cos 𝜓′ (3)
Li is the distance of the vertical projection of P or Q from X and can be calculated by (4) [9].
𝐿𝑖 = sin 𝜒′𝑖∗ cos 𝜓 (4)
Ri, the perpendicular projection of mB’ on the sample surface can be calculated according to (5).
7th International Conference on Recrystallization and Grain Growth IOP Conf. Series: Journal of Physics: Conf. Series 1270 (2019) 012012
IOP Publishing doi:10.1088/1742-6596/1270/1/012012
4
𝑅𝑖 = √M′2+ 𝐿𝑖2=√(sin 𝜓)2+ (sin 𝜒′𝑖*cos 𝜓)2 (5) α is the angle between R and Ω axis and can be calculated according to (6).
𝛼𝑖 = arcsin (M′
𝑅𝑖)=arcsin ( sin 𝜓′
√(sin 𝜓′)2+(sin 𝜒′𝑖*cos 𝜓′)2) (6) χi can be calculated using equation (7).
𝜒𝑖 = arcsin(𝑅𝑖) = arcsin (√(sin 𝜓′)2+ (sin 𝜒′𝑖*cos 𝜓 ′)2) (7) Then, φj can be calculated according to equations (8), (9), (10) and (11) within the I., II., III. and IV.
quarter of the current coordinate system, respectively (Figure 3.), where β is the angle between Ω and Ω’ or the physical rotation of the centreless diffractometer around ’ axis [9].
j= 𝛼𝑖+ 𝛽𝑗 (8)
j= (180 − 𝛼𝑖) + 𝛽𝑗 (9)
j= (180 + 𝛼𝑖) + 𝛽𝑗 (10)
j= (360 − 𝛼𝑖) + 𝛽𝑗 (11)
conventional diffractometer
=0 =0 0°,
centreless diffractometer
’=0 ’=0 ’0°,
Figure 2. Beam path of different diffractometer configurations at 0°, and =0°. [9]
After absorption (defocusing) correction, the measured intensity values are available as a function of and , from which the pole figure can be constructed.
3. Results and the validation of the new method
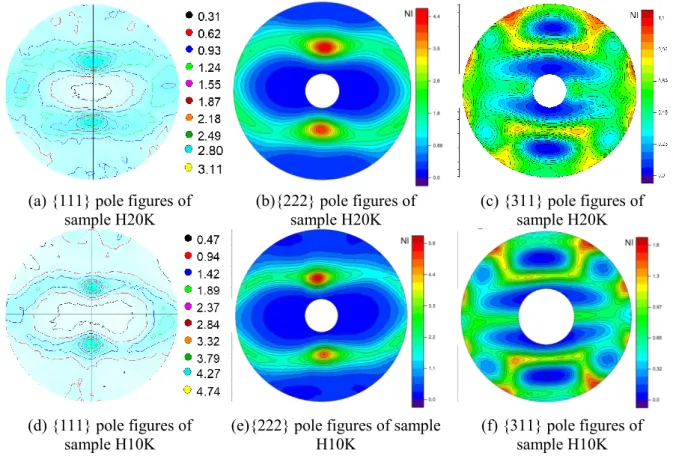
A 3104 type cold rolled aluminium sheets were chosen for the validation. Figure 4 shows the {222} pole figures determined by a conventional and the centreless diffractometers. The cold rollings were performed by a Von Roll experimental rolling mill, having 220 mm roll diameter, using 50 m/min rolling speed and mineral oil-based liquid lubricant. The sheets were cold rolled from 4.8 mm thickness to 1 mm (H20K) and from 4.8 to 0.2 mm (H10K), respectively. Conventional pole figure measurements were carried out by Bruker D8 Advance diffractometer equipped Eulerian cradle and Co K radiation source
7th International Conference on Recrystallization and Grain Growth IOP Conf. Series: Journal of Physics: Conf. Series 1270 (2019) 012012
IOP Publishing doi:10.1088/1742-6596/1270/1/012012
operating with 40kV tube voltage and 40 mA tube current. Pole figure were measured up to 75% tilting with 5° increments and visualised by the TexEval software. The new method was introduced using a Stresstech XStress 3000 G3R type centreless diffractometer with CrKα source operating with 30 kV tube voltage and 8 mA tube current. The used ’ values were -59°+59°, with 5° increments, was chosen as -90…+90°, with 5° increments. The absorption corrected pole figures were visualised by Origin software. For both equipment, absorption correction was performed on Al powder. It is evident that the relevant information of the pole figures of the two methods is the same.
at χ’=0° tilting at χ’≠0° tilting. at χ’≠0° tilting.
(front) view from the direction perpendicular to the tilting axis (X’), (top) view from the primary beam,
(side) view from the tilting axis (X’).
Intersection is in the I., II., III., the IV. quarter.
Figure 3. Theoretical view of measurement directions of different configuration X and X’ modes. Q and P are the intersections. Interpretation of parameters. [9]
4. Summary
The reverse modified mode as a new non-invasive pole figure measurement method was introduced based on the non-destructive residual stress measurement performed with centreless diffractometer. The centreless diffractometers generally operate by modified (CHI) and (OMEGA) modes. The full method to use modified mode for pole figure determination had already shown [9]. In this paper the mathematical background demonstrated for the reverse modified mode. It means that the centreless diffractometer operates as during residual stress measurements and the mathematical correlations describing the connection of the data set from the residual stress measurement with the coordinates of the pole figure have been shown. Each of the two measurement methods can be implemented in any case where the sample cut is not allowed, the surface is not even flat and the object to be examined is too large. The limit of the methods is that the centreless diffractometers operate at high value of 2
diffraction angles based on the principle of residual stress measurements so that these pole figures can be detected. The lack of the method can be eliminated by a diffractometer system attached to the robot arm ( mode).
5. Acknowledgement
The present paper was supported through the National Research, Development and Innovation Office – NKFIH K119566 project and by the ÚNKP-18-2-I. New National Excellence Program of the Ministry of Human Capacities. Marton Benke was supported by the Janos Bolyai Research Scholarship of the Hungarian Academy of Sciences.
7th International Conference on Recrystallization and Grain Growth IOP Conf. Series: Journal of Physics: Conf. Series 1270 (2019) 012012
IOP Publishing doi:10.1088/1742-6596/1270/1/012012
6
(a) {111} pole figures of sample H20K
(b){222} pole figures of sample H20K
(c) {311} pole figures of sample H20K
(d) {111} pole figures of sample H10K
(e){222} pole figures of sample H10K
(f) {311} pole figures of sample H10K
Figure 4. {hhh} pole figures and pole density levels of cold rolled 3104 type aluminium sheets after different degrees of cold rolling. (a, d) pole figures measured with a conventional diffractometer (max χ=75°); (b,c,e,f) pole figures measured with a centreless diffractometer (max χ’=60°) using reverse modified mode
References
[1] Engler O, Randle V Introduction to Texture Analysis – Macrotexture, Microtexture and Orientation Mapping, CRC Press. 2010
[2] Suwas S, Kumar Ray R. Crystallographic Texture of Materials, Springer-Verlag, London, 2014.
[3] Rollet A, Humphreys F,.Hatherly M, Recrystallization and Related Annealing Phenomena 3rd ed. , Elsevier, 2017
[4] Kocks U. F, Tomé C. N, Wenk H.-R, Texture and Anisotropy, Cambridge University Press 2005.
[5] Duran A, Herrera L, Jimenez de Haro M, Justo A and Perez-Rodriguez J 2008 Nondestructive analysis of cultural heritage artefacts from Andalusia, Spain, by X-ray diffraction with Göbel mirrors, Talanta 76, Issue 1, pp 183-188
[6] Adriaens A 2005 Nondestructive analysis and testing of museum objects: An overview of 5 years of research Spectrochimica Acta Part B 60 pp 1503 – 1516
[7] Giacomo C, Philippe S, Arlen H, (2016) Non-conventional applications of a noninvasive portable X-ray diffraction/fluorescence instrument Appl. Phys. A 122:990 2-17
[8] Fitzpatrick M, Fry A, Holdway P, Kandil F, Shackleton J, and Suominen L. 2005. A National Measurement Good Practice Guide, Determination of Residual Stresses by X-ray Diffraction - Issue 2 No. 52 (Teddington: Crown)
[9] Sepsi M, Mertinger V, Benke M 2019 Sample cutting-free pole figure measuring method for centreless diffractometers in modified X mode Mat. Char. 151 351–357
![Figure 2. Beam path of different diffractometer configurations at 0°, and =0°. [9]](https://thumb-eu.123doks.com/thumbv2/9dokorg/1333013.107973/5.892.121.779.391.914/figure-beam-path-different-diffractometer-configurations.webp)