T E C H N I C A L A D V A N C E Open Access
Radiomics-based differentiation of lung disease models generated by polluted air based on X-ray computed tomography data
Krisztián Szigeti1*, Tibor Szabó2ˆ, Csaba Korom3, Ilona Czibak2, Ildikó Horváth1, Dániel S. Veres1, Zoltán Gyöngyi4, Kinga Karlinger3, Ralf Bergmann5, Márta Pócsik2, Ferenc Budán4,6and Domokos Máthé1,2
Abstract
Background:Lung diseases (resulting from air pollution) require a widely accessible method for risk estimation and early diagnosis to ensure proper and responsive treatment. Radiomics-based fractal dimension analysis of X-ray computed tomography attenuation patterns in chest voxels of mice exposed to different air polluting agents was performed to model early stages of disease and establish differential diagnosis.
Methods:To model different types of air pollution, BALBc/ByJ mouse groups were exposed to cigarette smoke combined with ozone, sulphur dioxide gas and a control group was established. Two weeks after exposure, the frequency distributions of image voxel attenuation data were evaluated. Specific cut-off ranges were defined to group voxels by attenuation. Cut-off ranges were binarized and their spatial pattern was associated with calculated fractal dimension, then abstracted by the fractal dimension–cut-off range mathematical function. Nonparametric Kruskal-Wallis (KW) and Mann–Whitney post hoc (MWph) tests were used.
Results:Each cut-off range versus fractal dimension function plot was found to contain two distinctive Gaussian curves. The ratios of the Gaussian curve parameters are considerably significant and are statistically distinguishable within the three exposure groups.
Conclusions:A new radiomics evaluation method was established based on analysis of the fractal dimension of chest X-ray computed tomography data segments. The specific attenuation patterns calculated utilizing our method may diagnose and monitor certain lung diseases, such as chronic obstructive pulmonary disease (COPD), asthma, tuberculosis or lung carcinomas.
Keywords:Fractal dimension, Radiomics, In vivo micro-CT, Air pollution, Lung disease
Background
“Radiomics” is an approach currently recognized in bio- medical image analysis as a tool to define a potentially diverse array of meta-data obtained from images using quantitative radiology image analytics. Some well- selected features of these meta-data can be informative of the health status of the imaged organ system and
impact therapy decisions. Such therapy decisions are best taken early in the course of disease. Early therapy decisions have tremendous impact on quality of life in pulmonary diseases.
Fractals are often used to characterize non-Euclidean structures in biology [1]. Utilizing the scaling factor of statistically self-similar and non-overlapping subsets, fractal dimension can be computed [2] providing rele- vant information describing a structure’s complexity and homogeneity [3]. Fractal dimension represents, with cer- tain limitations, the “less or more branching nature” of structures [4, 5] including the respiratory organ [6].
* Correspondence:szigeti.krisztian@med.semmelweis-univ.hu ˆDeceased
1Department of Biophysics and Radiation Biology, Semmelweis University, Tűzoltó utca 37-47, Budapest H-1094, Hungary
Full list of author information is available at the end of the article
© 2016 Szigeti et al.Open AccessThis article is distributed under the terms of the Creative Commons Attribution 4.0 International License (http://creativecommons.org/licenses/by/4.0/), which permits unrestricted use, distribution, and reproduction in any medium, provided you give appropriate credit to the original author(s) and the source, provide a link to the Creative Commons license, and indicate if changes were made. The Creative Commons Public Domain Dedication waiver (http://creativecommons.org/publicdomain/zero/1.0/) applies to the data made available in this article, unless otherwise stated.
We sought to implement a fractal-based radiomics ap- proach to X-ray computed tomography attenuation data without respiratory gating thereby averting the risk of los- ing relevant information. Analysis of fractal dimensions in specially binned non-gated X-ray computed tomography image patterns has been the method of our choice.
The currently accepted method of analysing pulmon- ary fractal dimensions of X-ray computed tomography attenuation data usually consists of segmenting parts of the lung such as the alveolar respiratory units, or pul- monary arteries and veins [7–10]. Al-Kadi and Watson [2] distinguished tumours and blood vessels based on their X-ray attenuation differences (using contrast ma- terial) to perform fractal dimension analysis on the image segments. The usually applied methods therefore provide the reader with a fractal dimension value for each of the tissue component segments of lung images.
A usual outcome measure e.g. is the fractal dimension of lung arterial vasculature.
Our approach to radiomics has been greatly different from simply calculating fractal dimensions of segmented pulmonary tissue components (“dissected” vessels, bron- chi etc.). The examination of fractal dimensions of ideally selected attenuation ranges in relative Hounsfield units (HU) may provide the foundation towards discovering additional hidden tissue features in integrative patterns of lung images instead. These fractal dimension calculations may perhaps detect small scale tissue alterations such as those caused by harmful environmental conditions. Our objective was to unveil possible correlations between air pollutant categories and specific features or patterns of damaged lungs. These features of small magnitude might not be evident in either custom visual X-ray computed tomography image analysis or in the calculation of seg- mented pulmonary tissue fractal dimensions.
We aimed at distinguishing between different air pollu- tant effects on the lungs via a radiomic approach with a clinically translatable mathematical algorithm. We pre- ferred using non-gated X-ray computed tomography data.
Non-gated data acquisition still contains effects of e.g. hin- dered chest or lung motion. In our analysis we intended to examine data features reflecting disease-related changes also in lung organ movements rather than anatomical re- lationships. Thus in our analysis method presented here simple non-gated X-ray computed tomography mouse chest scans have been acquired and evaluated by the cal- culation of fractal dimension of binary images. We binned voxel sets from each mouse chest X-ray computed tomog- raphy volume into numerous attenuation ranges in our study [1, 11], instead of pulmonary tissue-based image segmentation. Additionally we also averted the use of any contrast agent.
Generally speaking, (both in the “classic” and in our novel method), the result of fractal dimension
calculation is a number corresponding to how often ex- amined structures (dissected arteries and veins in “clas- sical” methods and voxel 3D patterns with specific attenuation values in our approach) branch and/or fill the space within the chest. However, in our novel ap- proach, the fractal dimension calculation method exam- ines and depicts integrative binary images of lung voxels which are selected according to their attenuation values.
We then aimed at the application of our algorithm to discriminate among groups of mice treated with differ- ent air pollutants in an early phase of their respective disease models.
Methods Ethics Statement
The animal experiment was reviewed and approved by the local authorities (Committee on the Ethics of Animal Experiments of Semmelweis University, permit number:
PMK ÉBÁI-XIV-I-001/29-7/2012) according to Hungar- ian animal protection laws in accordance with EU guidelines.
Experimental animals
Three groups of BALBc/ByJ female mice (6–8 weeks old, 18–22 g) were used in the context of our current re- search. Their exposure was performed in a plexiglass in- halator chamber (30 cm × 30 cm × 50 cm). One group (n= 5) was treated with inhalation of sulphur dioxide (SO2) gas 2 % v/v (SDO group). A second group (n= 5) was treated with air diluted, fresh mainstream cigarette smoke from ‘3R4F’ Reference Cigarettes (Kentucky To- bacco Research & Development Center, USA) mixed with ozone-air gas mixture (50 mg/h, 3.7 l/min dilution with air; SAO group). Cigarettes with a shortened filter only (approx. 2 mm) were smoked according to our protocol (1 puff/9 s of 3 s duration and 40 mL volume).
The SAO group first received one 20 min long exposure, followed by two 20 min long exposures, and lastly, three 20 min long exposures on the additional remaining days.
A control group (n= 6) was also used, treated with the inhalation of filtered and humidified (30–40 %), air under identical conditions (CON group). Treatment dur- ation was 14 days, and then imaging was carried out within all groups. An untreated BALB/CyJ female mouse (Janvier, France) was imaged too, in serving the purpose of representation of the attenuation profile of the chest (Fig. 1).
In vivo imaging
X-ray computed tomography information was collected using a NanoX-CT (Mediso Ltd, Hungary) cone-beam in vivo micro-CT imaging system (8 W power of X-ray source, 55 kV source voltage, 3.6x zoom) without using contrast material. It is important to emphasize the
Szigetiet al. BMC Medical Imaging (2016) 16:14 Page 2 of 10
physics of cone-beam X-ray computed tomography ac- quisitions which represents specific technical consider- ations beyond the scope of our current paper and may distort the direct comparison of attenuation values of the same organs measured with other detection tech- niques, such as those applied in clinical slice-based
X-ray computed tomography systems. Therefore, attenu- ation values are presented in relative Hounsfield units.
Reconstruction algorithm (Mediso Ltd.) utilizing the Feldkamp-filtered back projection was run on a 64 bit graphics processing unit (GPU). The reconstructed voxel sizes were 54 × 54 × 54μm in one 370 × 370 × 370 voxel
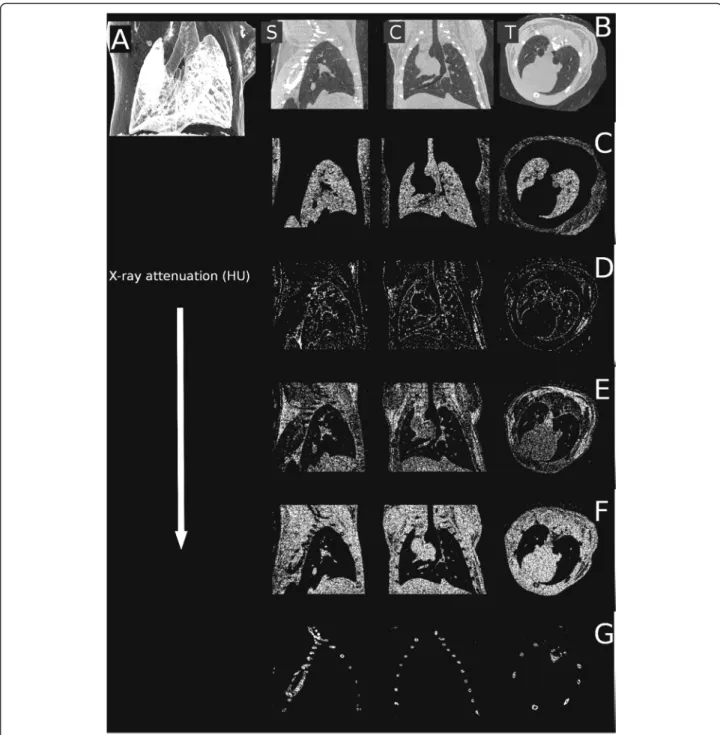
Fig. 1The reconstruction of the lungs of an untreated mouse shown with the sole intent of representing the attenuation profile of the chest.
Sagittal (leftb), coronal (centerb), transaxial (rightb) planes and minimum intensity projection (a). Certain attenuation ranges were abstracted from these slices in sagittal, coronal and transaxial planes.c−700–-400 relative HU (lung parenchyma), (d):−100–+200 relative HU (pleura, endothoracic fascia, epipleural fat and interlobar fissures), (e): +200–+500 relative HU (respiratory- and heart muscles, diaphragm), (f): +500– +800 relative HU (blood inside the vessels, aorta and heart, lymphatic fluid and interlobar fissures), and (g): +1400–+3800 relative HU (bones)
matrix, as region of interest (ROI) following our image acquisition. During data acquisition animals were con- stantly anaesthetized using a mixture of 2.5 % isoflurane and medical air, and their body temperature was main- tained at 38 C. One image acquisition took 4.5 min.
Non-respiration-gated data sets were acquired and fur- ther analysed.
Fan-beam technology, used earlier and extensively within clinical practice, has today largely been replaced by multislice detector technology. As a result, the differ- ence between pre-clinical and clinical instruments is quickly disappearing and clinical systems are gradually becoming similar to cone-beam computer tomography instruments.
Sensitivity in small animal imaging may be worse when compared to the human counterpart. Voxel size is one tenth or twentieth of the human voxel size, and so the signal-to-noise ratio could be worse (as this ratio is inversely proportional to the third power of voxel vol- ume), however, the measurement time is much longer.
In summary, signal-to-noise ratio is better in human measurements, meaning our method will have an in- creased sensitivity when applied to human cases.
Evaluation of X-ray attenuation histograms
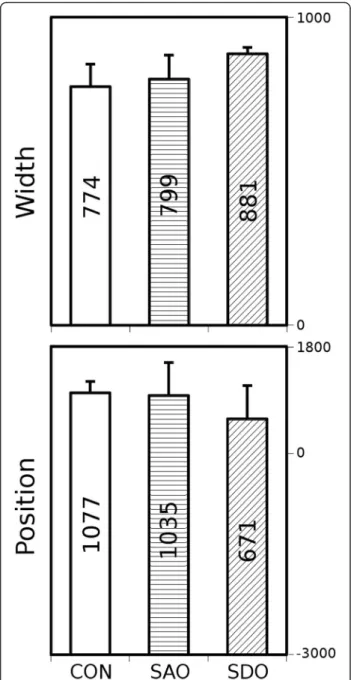
In the first step, our algorithm segmented the acquired 3D X-ray computed tomography volume reconstructions to contain only the whole lung volumes and to automat- ically distinguish between the lung tissue, chest bones and other tissues. The attenuation values of lung voxels were represented in a frequency distribution function, commonly referred to as a histogram [12] (data not shown). In the next step of evaluation, Gaussian curves were fitted by a minimum square algorithm (Gnuplot 4.4), featuring height, width and position. We calculated the means and standard deviations of positions and widths of the Gaussian curves of all examined groups (Fig. 2). The height is not presented on Fig. 2 as this par- ameter is dependent on width and area under histogram by definition.
Characterization by fractal dimension analysis of voxels of various attenuation ranges
Final data analysis was performed in five steps (Fig. 3).
The entire attenuation range of the reconstructed chest area of animals was divided into 100 distinct cut-off ranges. Once the attenuation value of a given voxel was within a certain cut-off range, the voxel was represented by “1”, or otherwise,“0”. This generated a binary image.
Each such derived binary pattern was then associated with a calculated fractal dimension via box-counting al- gorithm [13]. The lung morphology was quantified by plotting the fractal dimension of all cut-off ranges in each given X-ray computed tomography 3D attenuation
map. This plot is defined as the fractal dimension - cut-off range function.
Here we present the exact details of the mentioned five steps of data analysis with the purpose of demon- strating how the cut-off range associated fractal dimen- sion data were achieved (Fig. 3).
Step 1. The whole attenuation range in the experiments was between−3,000 and +10,000 relative HU.
The 100 distinct ranges of attenuation values were chosen by the Freedman-Diaconis rule [14].
A chosen range is defined mathematically as the
Fig. 2Width and position parameters (mean, SD) of attenuation histograms. CON, SAO, SDO groups
Szigetiet al. BMC Medical Imaging (2016) 16:14 Page 4 of 10
standard cut-off range. Certain attenuation values ranging between the chosen higher and lower value were ranked into one cut-off range. The 100 cut-off ranges involved the whole scale of the voxel attenuations of all scans and one cut-off range contained 130 relative HU.
Step 2. The X-ray computed tomography images were partitioned into cubic voxels (size: 54μm in a 370 × 370 × 370 voxel matrix). When the attenuation value of a given voxel was inside a certain cut-off range, then that voxel was associated with“1”, or otherwise with“0”in the representation of the cut-off range.
Step 3. This association step was repeated which resulted in a pattern of voxels with“1”and“0”
for every cut-off range. These patterns as binary images were used in the next steps. The 100 binary images were derived from 100 previously defined cut-off ranges.
Step 4. The box counting algorithm [13] was used to calculate the fractal dimension number associated with each binary image. See
additional details below in the sub-steps labelled a through d.
Sub-step a) In this box-counting algorithm, the length of cubic boxes varied from 1 to 100 voxels.
A given box was shifted from one position to another without overlapping in a certain binary image. The number of boxes containing at least one voxel with value“1”was summarized.
Thereby, a number was calculated defined as the number of boxes of a given side length (NB).
Sub-step b)The previous sub-step a) was repeated including the difference that the boxes are overlapped. Thus, NB results were produced derived from the shifted overlapped positions. A certain box size in a certain binary image produced two different NB results (from overlapping and non-overlapping boxes). From these two NBs, an average (E(NB)) was calculated and that value was used in further evaluation.
Sub-step c) For each box size, both the a and b sub-steps were repeated. E(NB) was represented as the function of the box size in a certain binary image.
Sub-step d)To determine fractal dimension, the function from sub-step c) was fitted by a power function. The exponent of the power law is the
Fig. 3Representation of the five steps of data analysis.a: The entire attenuation range of the reconstructed chest area of animals was divided into 100 distinct cut-off ranges (Step 1).b: Binary images are generated (Step 2 and 3) and each such derived binary pattern was next associated with a calculated fractal dimension via box-counting algorithms (Step 4).c: The fractal dimension–cut-off range function plot (Step 5)
fractal dimension. To each binary image, a fractal dimension number was ordered and calculated utilizing this method.
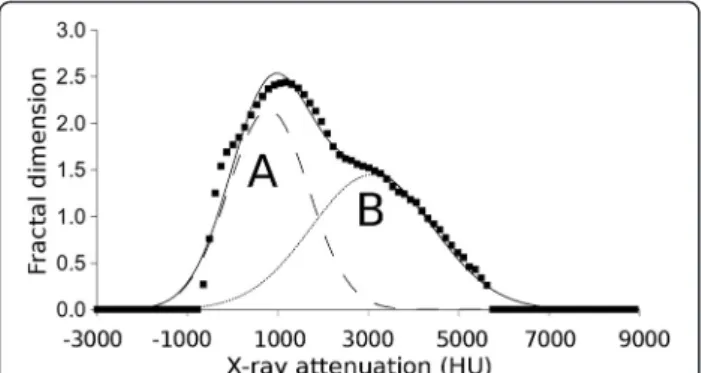
Step 5. In this step, the cut-off ranges were associated with the calculated fractal dimension. At both the very high and very low cut-off range values, the fractal dimension number is zero, while near the middle values of cut-off ranges the associated fractal dimension number becomes nearly maximal.
The resulting fractal dimension - cut-off range func- tion was fitted by two Gaussian curves (Gaussian curve
“A”and “B”) using the so-called“least box square”algo- rithm. The outputs of our algorithm, the height, width and position parameters of these fitted “A” and “B”
Gaussian curves, were calculated for all animals (Table 1).
Lists these numerical features of the Gaussian curves for every group based on Additional file 1 (supporting data).
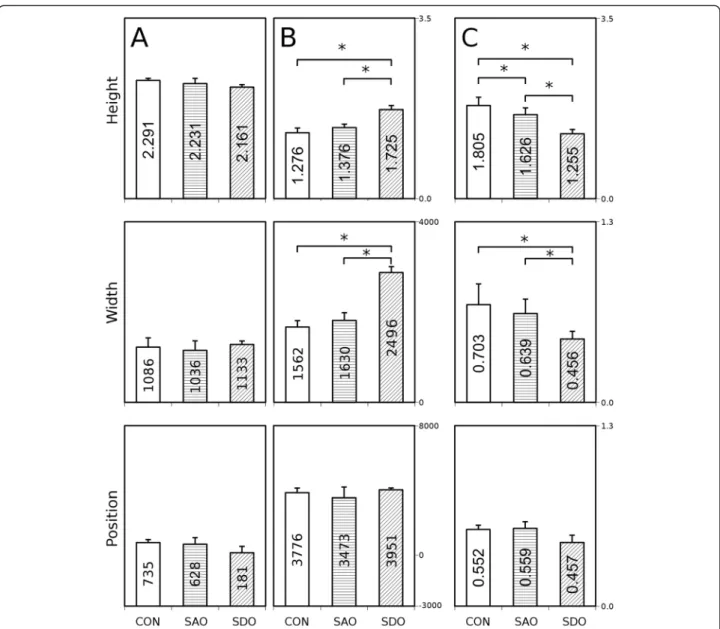
The lungs of all three groups, SDO, SAO and CON, were characterized by these parameters (Fig. 4).
Lastly, to further attempt significant discrimination of the groups, ratios of all three mean parameters derived from both“A” and“B” Gaussian curves were calculated.
The C insets represent the ratios of “A” parameters di- vided by “B” parameters (where a certain“C”parameter is calculated by dividing the “A” parameter of a given group by the“B”parameter of the same group) (Fig. 5).
These steps were repeated to evaluate the images of each animal.
Statistical analysis
Statistical analysis was performed using the nonparamet- ric Kruskal-Wallis (KW) test for fitted parameters of
groups (STATISTICA 7.0, Statsoft Inc., USA). Differ- ences between all groups were evaluated by the Mann–
Whitney post hoc (MWph) test (Figs. 2 and 5).
A chi-square test was used to test the reliability (p<
0.05) of fit of the histogram and the fractal dimension, or the cut-off range function (either fitted with one sin- gle or two independent Gaussian curves).
Results
The mean values of width and position of the voxel density histograms demonstrate no significant differ- ences between the three groups (Fig. 2).
The fractal dimension - cut-off range functions were evaluated by fitting them with Gaussian curves “A” and
“B” (Fig. 4). These functions can be characterized by height, maximum position and width of the peak. The means of height, width and position of the“A” curve of the CON group do not differ significantly when com- pared to the SDO or the SAO group. The means of height, width and position are unchanged between the SDO and SAO groups, too (Fig. 5a).
The mean of height of“B” curve of the SDO group in- creased significantly when compared to the CON group (KW p= 0.002, MWphp= 0.036) and to the SAO group (KW p= 0.002, MWph p= 0.024), but not significantly when the CON group was compared to the SAO group (Fig. 5b top). The mean of widths of “B” curves of the SDO group increased significantly (KW p= 0.016, MWphp= 0.036) compared to the CON group, and also significantly when compared to the SAO group (KW p
= 0.016, MWph p= 0.024), but not significantly when the CON group was compared to the SAO group (KW p= 0.016, MWphp= 0.429) (Fig. 5b middle). The means of maximum positions are not significantly altered be- tween the SDO, SAO and CON groups (Fig. 5b bottom).
The difference between the ratios of height is signifi- cant if the SDO group is compared to the CON group (KW p= 0.005, MWph p= 0.0357), if the SDO group is compared to the SAO group (KWp= 0.005, MWphp= 0.024) and if the SAO group is compared to the CON group (KWp= 0.005, MWphp= 0.042) (Fig. 5c top).
The ratios of width of the SDO and CON groups (KW p= 0.021, MWph p= 0.036) and the SDO and SAO groups (KW p= 0.021, MWph p= 0.024) demonstrate a slight but significant difference (Fig. 5c middle), however, the difference between the SAO and CON groups is not significant.
Discussion
Differences between parameters based on the relative HU–frequency histograms of the animals in the three groups, i.e. the differences between mean maximum posi- tions and widths (Fig. 2) could be neither the basis of de- tection of an altered lung structure nor the categorization Table 1Contains averages and standard deviations of all fitted
parameters for all groups of animals
Average SDO SAO CON
Height A 2,161 2,231 2,291
Height B 1,725 1,376 1,276
Position A 181 628 735
Position B 3951 3473 3776
Width A 1133 1036 1086
Width B 2496 1630 1562
STD
Height A 0,049 0,104 0,042
Height B 0,080 0,063 0,090
Position A 386 540 217
Position B 110 647 277
Width A 61 165 169
Width B 161 169 135
Szigetiet al. BMC Medical Imaging (2016) 16:14 Page 6 of 10
of air pollution exposure. Either the absence of gating or the reduced period of mouse model symptom production was likely the reason. Indeed, Sasaki et al. (2015) too could not distinguish the effect of cigarette smoke on lung tissue attenuation in comparison to the control using X-ray computed tomography with gating [15]. However, inter- estingly enough, a number of differences could be shown using our novel radiomics analysis method.
In our opinion, there are distinctly altered tissue features with respectively changed attenuation patterns in the differ- ent mouse models of air pollution related disease. However, the readout of these changes necessitates subtle differenti- ation and radiomics analysis methods in early phases of lung harm when symptoms are yet considerably subtle.
Severe lung diseases alter the inhalatory and exhala- tory movements and these changes can be detected even in mild cases or after relatively short exposure to air pol- lutants (e.g., the slower exhalation in COPD is evident) [16, 17]. This may be paradoxically advantageous in our approach and likely will help in discerning exposure sources. The hindered motion in the smoke/air and sulphur dioxide groups presumably decreases or even negates spatial and temporal overlapping of different tis- sues in the same voxel caused by respiratory movement and finally contributes to the mentioned increase of width parameter in the exposed groups. This change in motion dynamics (probably due to inflammation, mucus build-up and entrapped air bubbles) may be an import- ant part of the diagnosis and it is ignored when using re- spiratory gating. Notably, this finding suggests the fractal dimension- cut-off range function derived radiomic data might unveil some pathologic changes in lung diseases [3, 18]. Possibly the onset of disease as a result of expos- ure to air pollution could also be observed with our data analysis method.
The Gaussian curves of Fig. 5 display a different pat- tern of respiratory pulmonary motion in the exposed an- imals, possibly due to an increase in lung stiffness caused by pollutants.
The height of Gauss curve B is significantly increased in the SDO group compared to the other two groups (Fig. 5b top). We infer this change is attributable to the hindered motion of inflamed tissue.
Sulphurous gases are irritants and induce inflamma- tion, bronchoconstriction and bronchitis resulting in an increase of mucus [3, 19]. Overproduction of mucus can form plugs which entrap air or temporally and partly ob- struct the upper airways [20]. Airway clearance of mucus depends on the interactions between physical properties of the mucous gel, serous fluid content, and ciliary func- tion, in addition to airflow [19]. Wagner et al. (2006) dis- covered in a Sprague–Dawley rat model that 80 ppm concentration of SO2(besides overproduction of mucus) caused epithelial cells to lose their ciliae [21]. Nano- sized solid particles originating from fumes tend to accu- mulate in deeper airways and alveoli [22], as inflamma- tory agents increase water permeability and dilate cell volume thus thickening airway walls and resulting in the narrowing of the airways (in addition to minor mucus production which cannot be excluded). In our interpret- ation, this narrowing of the airways causes the different motion dynamics of this group.
The width parameter of the SDO group is significantly increased compared to the other two groups (Fig. 5b center). We believe this change is attributable to the hin- dered motion of inflamed tissue.
The number of voxels representing thickening airway walls is increased, caused by SO2 exposure often pene- trating into deeper airways and inducing inflammation in the alveoli, leading to the appearance of fluid, derived from necrotic cells [19, 23]. Mucus plugs trap air inside the alveoli and lead to the formation of micro-sized bub- bles [24, 25] inside the lung parenchyma. Indeed mucus production is an early response to increased amounts of air pollution [19]. In our interpretation, the increased number of voxels representing thickening airway walls causes the different shape of the fractal dimension - cut- off range function of this group.
Only a slight difference was observed between the means of height of Gaussian curve “B” of SAO and CON groups (Fig. 5b top). In addition to mean values of maximum positions (Fig. 5b bottom), the width param- eter of the SAO group was compared to the control group (Fig. 5 middle), however it did not significantly change.
Theoretically speaking, emphysema-diseased areas within the lungs could occur caused by destroyed walls of airways and alveoli [11, 12, 18], however, it appears only in long term experiments [26].
In using the corresponding ratios of parameters of Gaussian curves “A” and “B” (Fig. 5c) and the heights and widths of “B” Gaussian curves (Fig. 5b), all three groups could be distinguished. We believe the difference
Fig. 4The fractal dimension–cut-off range function fitted by Gaussian curves“a”and“b”
between the ratios of parameters refers to the different proportion of various kinds of tissue damage caused by different air pollution agents.
The proportion of tissue alterations has a specific pat- tern in lung diseases of different origin. Altered tissue (e.g., increased mucus production in one model or in- creased presence of tissue microbubbles in another) was explored.
The mechanism of these changes affecting the respira- tory movement remains unclear and warrants further research.
Data acquired in our study (Fig. 5b, c) proved a worthy basis for differentiating specific air pollution caused lung changes in the early stage by direct fractal dimension -
cut-off range function pattern analysis. It could be hy- pothesized that molecular features and presence of mucus in smaller airways [19] and inflammation profile of lung tissues [27] contribute to our fractal dimension analysis-based results. In reference to published litera- ture [19, 28], we postulate that the fractal dimension - cut-off range function calculated with our method may be used as an imaging biomarker. It could be effectively converted to both preclinical applications and clinical use in humans, ideally providing patients the benefit of early warning towards avoiding environmental risks.
Additional benefits are expected in the proper treatment at the onset of symptoms of disease, and lastly, to pre- vent aggravation of disease and exacerbation of COPD
Fig. 5Calculated height, width and position parameters of the fractal dimension - cut-off range functions.a: Height, width and position parame- ters of Gaussian curve„A”(CON, SDO, SAO groups).b: Height, width and position parameters of Gaussian curve„B”(CON, SDO, SAO groups).c:
The ratios of the relevant parameters of Gaussian curves„A”and„B”(CON, SDO, SAO groups). *p< 0.05, Kruskal-Wallis (KW) test with Mann–Whitney post hoc (MWph) test
Szigetiet al. BMC Medical Imaging (2016) 16:14 Page 8 of 10
and/or asthma bronchiale symptoms. Here, we highlight the importance of length of smoke exposure and genetic susceptibility [28] to emphysema [26], which may later develop and will be reflected in the reported imaging biomarker parameters [3, 18].
The radiomic analysis of the fractal dimension - cut- off range function may be useful in early diagnosis of both exposure to air pollution and lung diseases (such as COPD or asthma), containing information about both the molecular features and patterns of mucus in smaller airways [19] and the inflammation profiles of lung tis- sues [27]. We propose an increase in the number of structurally quantitative imaging biomarker research studies, towards early detection and follow-up of therapy of other pulmonary diseases, for example, cystic fibrosis, lung carcinomas [3] or tuberculosis [29].
In translational research, our most important goal is to develop methods in animal models which later may be used in clinical practice. In the case of our paper, the translatability of the method is dependent upon three aspects of it. The first is the usability of the algorithm in clinical practice, the second is the relation between anatomy sizes and reconstruction voxels, and the third is the applicability of the algo- rithm in clinical protocols.
The algorithm does not use specific data, as it only re- quires a 3D reconstruction, that is attenuation distribu- tion. These data are also available in the clinical setting, so our algorithm proposed here can also be applied for clinical lung computed tomography volumes.
The human body is about 15–20 times longer than the body of the mouse and there is nearly the same differ- ence between spatial resolution (voxel size in preclinical CT is 50μm and in clinical CT is 500–750μm). Gener- ally speaking, anatomy size and voxel size change pro- portionally. Because of the partial-volume effect, though, true resolution does not reach voxel size calculated from reconstruction. It is important to note that the size of al- veoli is invariable between species and is around 200 μm. Consequently, neither the pre-clinical nor the clin- ical instrument can visualize individual alveoli with suit- able resolution, but in the case of the pre-clinical instrument, we see one alveolus in the adjacent voxels, whereas in case of the clinical instrument, we see more than one alveoli in one voxel.
Practically speaking, the proposed algorithm can be applied in the clinics and it is not necessary to change protocols, since the usual examinations and unchanged data acquisition chain should be followed by this new
“off-line”analysis.
In summary, the use of the algorithm will be self- evident in clinical practice. Naturally, its diagnostic ef- fectiveness needs to be assessed meticulously throughout different diseases.
Conclusions
We discovered a novel diagnostic and disease characterization method providing results within a re- markably short disease model production time com- pared to the former 8–24 weeks needed to produce detectable lung tissue changes as described in published literature [30]. Additionally, as our method does not apply gating, it may contribute to the simplified and more cost-effective (through higher throughput) data analysis utilizing simple X-ray computed tomography scans in mouse experimental models. The implementa- tion of our data analysis is straightforward and applic- able in clinical image data sets and does not require additional hardware. As the early diagnostic potential of COPD-related lung and airway changes was shown here in data containing approximately clinical levels of noise, we remain convinced the translation and validation of our algorithm and data analysis in human clinical trials is warranted [3].
Additional file
Additional file 1:Lists of the numerical features of the Gaussian curves for every mouse.(DOC 36 kb)
Competing interests
The authors hereby declare they have no competing interests. Tibor Szabó, Ilona Czibak, Márta Pócsik, and Domokos Máthé are employees of CROmed Translational Research Centers. CROmed Translational Research Centers does not have any financial or non-financial interest in the subject matter or mate- rials discussed in this manuscript. Ferenc Budán is an employee/stakeholder of MedProDevelop Kft that has no financial or non-financial interest in the subject matter or materials discussed in this manuscript.
Authors’contributions
DM and TS designed the study; TS, IC, DM and IH did the preclinical imaging work; CK, DSV and FB analyzed the data; KS takes responsibility for the integrity of the data and the accuracy of the data analysis; DM, KS, FB, ZG and MP wrote the paper; KK and RB contributed expert advice and valuable insight. All authors read and approved the final manuscript.
Acknowledgements
Miklós Kellermayer and Jon Marquette are gratefully acknowledged for providing support. The technical help from Mediso’s Evaluation Software Team especially László Papp is gratefully acknowledged.
Author details
1Department of Biophysics and Radiation Biology, Semmelweis University, Tűzoltó utca 37-47, Budapest H-1094, Hungary.2CROmed Translational Research Centers Ltd., Baross utca 91-95, Budapest H-1047, Hungary.
3Department of Radiology and Oncotherapy, Semmelweis University, Üllői út 78/A, Budapest H-1082, Hungary.4Department of Public Health Medicine, University of Pécs, Szigeti út 12, Pécs H-7624, Hungary.5Institute of Radiopharmaceutical Cancer Research, Helmholtz-Zentrum
Dresden-Rossendorf, Dresden D-01314, Germany.6MedProDevelop Kft, Irgalmasok utcája 16, Pécs H-7621, Hungary.
Received: 1 October 2015 Accepted: 1 February 2016
References
1. Mandelbrot BB, Blumen A. Fractal Geometry: What is it, and What Does it do? Proc R Soc A. 1989;423:3–16.
2. Al-Kadi OS, Watson D. Texture analysis of aggressive and nonaggressive lung tumor CE CT images. IEEE Trans Biomed Eng. 2008;55(7):1822–30.
3. van Rikxoort EM, van Ginneken B. Automated segmentation of pulmonary structures in thoracic computed tomography scans: a review. Phys Med Biol. 2013;58:R187–220.
4. Smith TG, Lange GD, Marks WB. Fractal methods and results in cellular morphology - Dimensions, lacunarity and multifractals. J Neurosci Methods.
1996;69(2):123–36.
5. Helmberger M, Pienn M, Urschler M, Kullnig P, Stollberger R, Kovacs G, et al.
Quantification of tortuosity and fractal dimension of the lung vessels in pulmonary hypertension patients. PLoS One. 2014;9(1):e87515.
6. Shlesinger MF, West BJ. Complex fractal dimension of the bronchial tree.
Phys Rev Lett. 1991;67(15):2106–8.
7. Keller BM, Reeves AP, Henschke CI, Yankelevitz DF. Multivariate
Compensation of Quantitative Pulmonary Emphysema Metric Variation from Low-Dose. Whole-Lung CT Scans Am J Roentgenol. 2011;197(3):495–502.
8. Huo Y, Choy JS, Wischgoll T, Luo T, Teague SD, Bhatt DL, et al. Computed tomography-based diagnosis of diffuse compensatory enlargement of coronary arteries using scaling power laws. J R Soc Interface. 2013;10(81):20121015.
9. Gould DJ, Vadakkan TJ, Poche RA, Dickinson ME. Multifractal and Lacunarity Analysis of Microvascular Morphology and Remodeling. Microcirculation.
2011;18(2):136–51.
10. Glenny RW. Emergence of matched airway and vascular trees from fractal rules. J Appl Physiol. 2011;110(4):1119–29.
11. Wright JL, Cosio M, Churg A. Animal models of chronic obstructive pulmonary disease. Am J Physiol Lung Cell Mol Physiol. 2008;295(1):1–15.
12. Smith Jr TG, Lange GD, Marks WB. Fractal methods and results in cellular morphology—dimensions, lacunarity and multifractals. J Neurosci Methods. 1996;69:123–36.
13. Freedman D, Diaconis P. On the histogram as a density estimator: L2 theory. Zeitschrift für Wahrscheinlichkeitstheorie und Verwandte Gebiete.
1981;57:453–76.
14. Sasaki M, Chubachi S, Kameyama N, Sato M, Haraguchi M, Miyazaki M, et al.
Evaluation of cigarette smoke-induced emphysema in mice using quantitative micro-computed tomography. Am J Physiol Lung Cell Mol Physiol. 2015;308(10):1039–45.
15. Tantisuwat A, Thaveeratitham P. Effects of Smoking on Chest Expansion, Lung Function, and Respiratory Muscle Strength of Youths. J Phys Ther Sci.
2014;26:167–70.
16. Gagnon P, Guenette JA, Daniel L, Louis L, Vincent M, François M, et al.
Pathogenesis of hyperinflation in chronic obstructive pulmonary disease.
Int J of Crohn Obstruct Pulmon Dist. 2014;9:187–201.
17. Nagao M, Murase K. Measurement of heterogeneous distribution on Technegas SPECT images by three-dimensional fractal analysis. Ann Nucl Med. 2002;16(6):369–76.
18. Williams OW, Sharafkhaneh A, Kim V, Dickey BF, Evans CM. Airway mucus:
From production to secretion. Am J Respir Cell Mol Biol. 2006;34(5):527–36.
19. Kim WD. Lung mucus: A clinician’s view. Eur Respir J. 1997;10(8):1914–7.
20. Wagner U, Staats P, Fehmann H-C, Fischer A, Welte T, Groneberg DA.
Analysis of airway secretions in a model of sulfur dioxide induced chronic obstructive pulmonary disease (COPD). J Occup Med Toxicol. 2006;1:12.
21. van Dijk WD, Gopal S, Scheepers PT. Nanoparticles in cigarette smoke;
real-time undiluted measurements by a scanning mobility particle sizer.
Anal Bioanal Chem. 2001;399:3573–8.
22. Castañer E, Gallardo X, Pallardó Y, Branera J, Cabezuelo MA, Mata JM.
Diseases affecting the peribronchovascular interstitium: CT findings and pathologic correlation. Curr Probl Diagn Radiol. 2005;34(2):63–75.
23. Bossé Y, Riesenfeld EP, Paré PD, Irvin CG. It’s not all smooth muscle:
non-smooth-muscle elements in control of resistance to airflow. Annu Rev Physiol. 2010;72:437–62.
24. Moldoveanu B, Otmishi P, Jani P, Walker J, Sarmiento X, Guardiola J, et al.
Inflammatory mechanisms in the lung. J Inflamm Res. 2009;2:1–11.
25. Maeno T, Houghton AM, Quintero PA, Grumelli S, Owen CA, Shapiro SD.
CD8+ T Cells are required for inflammation and destruction in cigarette smoke-induced emphysema in mice. J Immunol. 2007;178(12):8090–6.
26. Jeffery PK. Structural and inflammatory changes in COPD: a comparison with asthma. Thorax. 1998;53(2):129–36.
27. Churg A, Cosio M, Wright JL. Mechanisms of cigarette smoke-induced COPD: insights from animal models. Am J Physiol Lung Cell Mol Physiol.
2008;294(4):612–31.
28. Chen RY, Dodd LE, Lee M, Paripati P, Hammoud DA, Mountz JM, et al.
PET/CT imaging correlates with treatment outcome in patients with multidrug-resistant tuberculosis. Sci Transl Med. 2014;6(265):166.
29. Jobse BN, Rhem RG, Wang IQ, Counter WB, Stämpfli MR, Labiris NR.
Detection of lung dysfunction using ventilation and perfusion SPECT in a mouse model of chronic cigarette smoke exposure. J Nucl Med.
2013;54(4):616–23.
30. Beckett EL, Stevens RL, Jarnicki AG, Kim RY, Hanish I, Hansbro NG, et al. A new short-term mouse model of chronic obstructive pulmonary disease identifies a role for mast cell tryptase in pathogenesis. J Allergy Clin Immunol. 2013;131(3):752–62.
• We accept pre-submission inquiries
• Our selector tool helps you to find the most relevant journal
• We provide round the clock customer support
• Convenient online submission
• Thorough peer review
• Inclusion in PubMed and all major indexing services
• Maximum visibility for your research Submit your manuscript at
www.biomedcentral.com/submit
Submit your next manuscript to BioMed Central and we will help you at every step:
Szigetiet al. BMC Medical Imaging (2016) 16:14 Page 10 of 10