Manuscript Details
Manuscript number EST_2019_769_R1
Title Probing the three-dimensional porous and tortuous nature of absorptive glass mat (AGM) separators
Article type Research Paper
Abstract
The valve regulated lead acid (VRLA) battery is a predominant electrochemical storage system that stores energy in a cheap, reliable and recyclable manner for innumerable applications. The absorptive glass mat (AGM) separator is a key component, which is pivotal for the successful functioning of the VRLA battery. Herein, the intricate three- dimensional (3D) porous structure of AGM separators has been unveiled using X-ray micro-computed tomography (microCT) analysis. X-ray microCT has quantified a variety of fiber and structural parameters including fiber
orientation, porosity, tortuosity, pore size distribution, pore interconnectivity and pore volume distribution. A predictive model of hydraulic tortuosity has been developed based upon some of these fiber and structural parameters.
Moreover, the pore size distribution extracted via X-ray microCT analysis has served as a benchmark for making a comparison with the existing analytical model of the pore size distribution of AGM separators. Pore size distributions obtained via the existing analytical model and through X-ray microCT analysis are in close agreement.
Keywords fiber orientation; separator; pore size; tortuosity; porosity
Taxonomy Energy Storage, Energy Sustainability, Electrochemical Energy Engineering Corresponding Author Akos Kukovecz
Corresponding Author's Institution
University of Szeged, Dept. of Applied and Environmental Chemistry
Order of Authors Siddharth Shukla, Vijay Kumar, P.V. Kameswara Rao, Sumit Sharma, Daniel Sebok, Imre Szenti, Amit Rawal, Akos Kukovecz
Suggested reviewers Krisztian Kordas, Robert Vajtai, Stefan Schlichter
Submission Files Included in this PDF
File Name [File Type]
cover_letter_JES.doc [Cover Letter]
response_letter.docx [Response to Reviewers]
Revised_Manuscript_JES Akos4.docx [Revised Manuscript with Changes Marked]
Highlights.doc [Highlights]
Graphical Abstract.jpg [Graphical Abstract]
Revised_Manuscript_JES Akos4 unmarked.docx [Manuscript File]
declaration-of-competing-interests.docx [Conflict of Interest]
Supp_Info.docx [e-Component]
Submission Files Not Included in this PDF
File Name [File Type]
Joined.mp4 [e-Component]
To view all the submission files, including those not included in the PDF, click on the manuscript title on your EVISE Homepage, then click 'Download zip file'.
Probing the three-dimensional porous and tortuous nature of absorptive glass mat (AGM) separators
Siddharth Shuklaa, Vijay Kumarb, P.V. Kameswara Raoa, Sumit Sharmaa, Dániel Sebőkc, Imre Szentic, Amit Rawala1, Akos Kukoveczc1
aIndian Institute of Technology Delhi, Hauz Khas, New Delhi, India
bUniversity of Boras, Boras, Sweden
cUniversity of Szeged, Interdisciplinary Excellence Center, Department of Applied and Environmental Chemistry, H-6720 Szeged, Rerrich Béla tér 1, Hungary
Abstract
The valve regulated lead acid (VRLA) battery is a predominant electrochemical storage system that stores energy in a cheap, reliable and recyclable manner for innumerable applications. The absorptive glass mat (AGM) separator is a key component, which is pivotal for the successful functioning of the VRLA battery. Herein, the intricate three-dimensional (3D) porous structure of AGM separators has been unveiled using X-ray micro-computed tomography (microCT) analysis. X-ray microCT has quantified a variety of fiber and structural parameters including fiber orientation, porosity, tortuosity, pore size distribution, pore interconnectivity and pore volume distribution. A predictive model of hydraulic tortuosity has been developed based upon some of these fiber and structural parameters. Moreover, the pore size distribution extracted via X-ray microCT analysis has served as a benchmark for making a comparison with the existing analytical model of the pore size distribution of AGM separators. Pore size distributions obtained via the existing analytical model and through X-ray microCT analysis are in close agreement.
1 Corresponding Authors: E-mail: kakos@chem.u-szeged.hu (Akos Kukovecz), arawal@iitd.ac.in (Amit Rawal)
Keywords: fiber orientation; separator; pore size; tortuosity; porosity
1. Introduction
Valve regulated lead acid (VRLA) batteries offer cheap, reliable, environment-friendly and provide long service uninterruptible power supplies for an ever-increasing list of applications.
Traditionally, the main applications of VRLA batteries are either based upon stationery and starting, lighting and igniting (SLI) types [1]. The emerging applications of VRLA batteries require certain improvements in terms of dynamic charge acceptance [2], reduction in sulfation under high-rate partial state-of-charge [3,4], maintaining high energy density and controlling dendrite growth [5]. The operating principle of VRLA batteries involves the transportation of oxygen gas from the positive electrode to react with the hydrogen gas released at the negative electrode to produce water through a process known as ‘oxygen recombination’ cycle [6]. The passage of oxygen is channelized via a separator, that is typically sulfuric acid immobilized either in silica leading to a ‘gel’ type VRLA battery or in a paper-like glass resulting in an ‘absorptive glass mat’
(AGM) type of variant [7].
The AGM in the VRLA battery essentially comprises of a three-dimensional (3D) network of glass fibers prepared through a conventional wet laying process [8]. It serves a multitude of functions including the separation of electrodes, the retention of electrolyte in a uniform manner, promoting oxygen recombination efficiently, providing the necessary resistance to the plate-group pressure, and controlling dendrite growth [9–14]. The intricate porous morphology of an AGM separator can be deciphered in terms of pore size, shape, volume, and the interconnectivity, which is analogous to the porous characteristics of a typical thermoplastic nonwoven material [15]. The
‘tortuous and porous’ nature of AGM separators not only modulates various functions including
electrolyte saturation and distribution, prevention of short-circuit, and recombination cycle of oxygen, but also averts the issues pertaining to the failure of the VRLA batteries [16–21]. For instance, electrolyte stratification – a phenomenon that arises as a result of the gradient in electrolyte (sulfuric acid) concentration between the upper and lower regions of the battery – can be well-controlled with the help of small-sized pores that hold the electrolyte during the recharging of the battery [22]. Zeng et al. [5] highlighted the significance of the porous morphology of AGM separators emanating from the diffusion of sulfuric acid into the porous system followed by the formation of lead sulfates. This leads to ‘sulfation’ on the plate surface that delays the diffusion of sulfuric acid into the separator. Subsequently, the lead sulfates are transformed into - and - PbO2
on charging, which not only affects the initial capacity and life cycle of the battery [23,24] but can also be the source of fast and exothermic reactions that raise the temperature of the battery quickly and become a leading cause of ‘thermal runaway’[25]. Similarly, highly tortuous pores in AGM separators can hinder the oxygen recombination cycle [15] that inevitably increases water loss and grid corrosion but can be a favorable tool for alleviating the issues of dendrite formation and thermal runaway [25–27]. Therefore, there is a need to decipher the 3D anisotropic porous morphology both from theoretical and experimental perspectives in order to design next generation AGM separators.
The 3D anisotropic porous morphology of AGM separators can be visualized through a large variation in the pore dimensions both in the in-plane and the out-of-plane directions dictating wicking characteristics and optimal oxygen transport rates, respectively [15,28,29]. A large variation also exists in entrance and exit pore dimensions leading to the so-called ‘pore size distribution’ [30]. It has been recommended to minimize the gap between the maximum and mean pore sizes in order to reduce the occurrence of thermal runaway in VRLA batteries [25]. Recently,
a 3D analytical model of the pore size distribution of AGM separators has been proposed by formulating a relationship with porosity, alignment of fibers and fiber dimensions [31]. However, the analytical model of pore size distribution was assessed via the experimental data obtained using a capillary flow porometer that employed high levels of compressive stresses resulting in significant modifications in the structural characteristics of AGM separators. Notably, the model of compression-recovery behavior of the AGM separator [32] was combined with that of the pore size distribution to simulate the stresses that are normally deployed in a capillary flow porometer.
With the aid of X-ray micro-computed tomography (microCT), the pore size distribution and the other porous characteristics of AGM separators can be extracted reliably without the need to modify any structural features. In the past, the microstructure of a variety of nonwoven materials has been revealed successfully via X-ray microCT analysis [33–35]. Therefore, there is a need to unravel the intricate 3D porous morphology of AGM separators using X-ray microCT analysis with a view that the obtained structural parameters can serve as a ‘feedstock’ for predictive modeling.
The porous characteristics of AGM separators consist of contracting and enlarging pores with defined orientation, size, shape and volume in a manner that the fluid often travels through a longer path than expected through well-connected pores [36]. Tortuosity is a parameter that describes the ratio of the actual length of the flow path to that of the straight length [36]. The tortuosity of cellulosic separators has been studied by Tye and his colleagues [37,38] through an electrical resistance approach but a detailed investigation related to the tortuous nature of AGM separators is non-existent in the open literature. Nevertheless, Culpin and Peters [39] have provided a blueprint to design AGM separators with the desired tortuosity level through a trade-off between the proportion of fibers present in the XY plane and along the Z-direction. However, a predictive
model of tortuosity formulating a relationship with a key set of fiber and structural parameters is yet to be established for AGM separators. Another important pore parameter is the proportion of pore volume available to be filled by the electrolyte, which is often described in terms of porosity or even pore volume distribution. The pore volume has a direct relationship with the saturation level that influences both the discharge performance and the recharge characteristics of a VRLA battery [39]. The pore volume distribution can be measured with the use of destructive methods such as liquid extrusion porosimetry, mercury intrusion porosimetry, etc. [40,41]. However, a non- destructive method that avoids structural modifications during the measurement has not been employed until now. In order to overcome these challenges, the present work aims to decipher the porous characteristics of AGM separators through X-ray microCT analysis in a systematic manner.
Specifically, a 3D analytical model has been developed to predict the hydraulic tortuosity of AGM separators based upon a key set of fiber and structural parameters. Here, the hydraulic tortuosity refers to the ratio of the mean path of fluid particles through the AGM sample to the straight-line distance through the porous medium based upon the direction of macroscopic flow [42]. To the best of the authors' knowledge, this is a first-of-its-kind model revealing the importance of alignment of fibers and porosity of AGM separators. For the first time, X-ray microCT analysis has been used in combination with 3D quantification of structural parameters via image based modeling techniques [43–45] to obtain spatial information about porosity, tortuosity, local pore size distributions, pore interconnectivity and pore volume distributions. Further, the pore size distribution extracted via X-ray microCT analysis has been compared with the existing analytical model of the pore size distribution of AGM separators [31].
2. Theoretical Framework
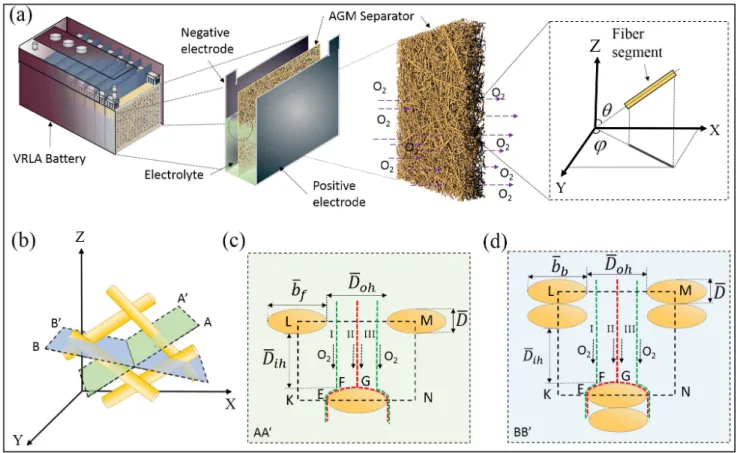
In AGM separators, tortuous pores present in the thru-thickness (out-of-plane) direction play a pivotal role in channelizing the optimal rate of oxygen transport and thus, they act as a deterrent in controlling the failure of the battery (see Fig. 1a). The intricate structure of AGM separators comprises of 3D anisotropic entities of solid (fibers) and pore (void) phases [12,39]. More specifically, the oxygen evolved at the positive plate has to transcend through free fiber segments between the successive contacts, fiber-fiber contacts and available pore spaces before it can react with hydrogen released from the negative plate. The densities and distributions of free fiber segments between the successive contacts, and the fiber-fiber contacts can modulate the tortuosity that effectively determines the hindrance to the passage of the oxygen. As we have previously shown, fibers in AGM separators are aligned in a 3D manner [31,32], thus the internal tortuous structure can be viewed as a 3D combinatorial network of fibers and pores that shares structural commonalities with conventional nonwoven materials [15]. By combining the first principles of stereology and stochastic distributions, the model of hydraulic tortuosity of AGM separators has been proposed based upon the following assumptions.
Fig. 1 (a) Schematic illustration of a VRLA battery revealing the key components, i.e. positive electrode, negative electrode, and partially saturated AGM separator with electrolyte. Here, the magnified views show the key components of the VRLA battery, the network of fibers in the AGM separator and the alignment of a typical constituent glass fiber segment in a 3D space. (b) Sectioning of free fiber segments and overlapping fibers in the defined planes AA’ and BB’, respectively. Here, the cylindrical fibers are sectioned by an inclined plane (AA’ or BB’) and accordingly, the cross-sections appear as ellipses. The flow of oxygen gas (represented by arrows) is either hindered by the presence of (c) free fiber segments or (d) overlapping fibers represented by region EFG. The rectangular unit cell (KLMN) has been formed such that the gaps between the two successive fibers in the width-wise and depth-wise directions are denoted by hydraulic diameters in the out-of-plane (Doh) and in-plane (Dih) directions, respectively.
1. The constituent fibers in AGM separators are cylindrical in shape with uniform geometrical properties expressed in terms of length and diameter [46,47]. The aspect ratio (length/diameter) of fibers is sufficiently large in order to neglect the end-end and side-end contacts.
2. Glass fiber segments are uniformly distributed in a unit volume such that their centers are also homogeneously dispersed in a 3D space [48].
3. The fiber segments between two successive contacts are assumed to be straight entities [49,50].
4. The internal resistance of glass fibers is considered to be low enough to be considered in the predictive modeling.
5. The passage of fluid in the thru-thickness direction of the AGM separator is primarily hindered by the presence of 3D aligned fibers in the porous system. The generation of vortexes within the porous media is not considered in this analysis [51].
As aforementioned, the tortuous path of the oxygen gas evolved at the positive plate is obstructed by the presence of free fiber segments between the successive contacts, fiber-fiber contacts and their densities and distributions. Therefore, it is pertinent to understand the structural characteristics of AGM separators.
2.1 Structural Analysis
Intriguingly, the AGM structure can be stratified as a network of fibers such that each of the fiber segments with diameter (D) is aligned in a typical spherical co-ordinate system, i.e. in terms of in- plane (azimuthal) ( ) and out-of-plane (polar) ( ) orientation angles (see Fig. 1a). Thus, the orientation of a fiber segment is uniquely determined by the pair (
,
)such that 0
,
. Also, the probability of finding the orientation of a fiber in the infinitesimal range and d, and and d is given by
, sindd, where
, is a probability density function. The orientation density function must satisfy the following criteria.
, 1 (1) sin0 0
d
d
According to Komori and Makishima [47], the number of fiber-to-fiber contacts per unit volume of assembly (n) is given by,
(2)
2
V DI L n
where
; ;0 0
) , ( sin ) ,
( d
J d
I
0 0
sin ) , ( ) , , , ( sin )
,
( d d
J
(3)
cos cos cos sin sin
2]1/2 1[
sin
where L is the total length of fibers in volume (V), D is the fiber diameter, and I is a global orientation parameter of the constituent fibers with defined orientation distributions
,
and
,
.
Let us use the basic definition of fiber volume fraction (Vf ), i.e. the ratio of the volume of fibers to the total volume of the AGM separators. Thus,
V (4) L Vf D
4
2
Combining equations (2) and (4),
3 (5)
2
16 2
D I n Vf
Similarly, the mean number of fiber-fiber contacts per unit length of fiber ( ) and the mean nl distance between the centers of two successive contacts ( ) is given by [47],b
I (6) V DL nl b1 2
Combining equations (2) and (6),
(7)
f
l IV
D b n
8 1
The above expression of is significantly important in computing the tortuosity caused by a fiber b segment present between two consecutive contacts. A mesodomain in the form of a representative volume element (RVE) can be defined as a fiber segment between two successive fiber-fiber contacts, which is confined between the two planes of unit cross-sectional area [52]. This RVE has a thickness equivalent to the mean distance between the centers of two successive contacts whilst being projected on the thickness or j-direction ( ). Here, comprises of two constituents, i.e. the bj b mean length of overlapping fibers ( ) and the mean free fiber length (bb bf). Therefore, the proportion of the mean free length of fiber (m) and that of overlapping fibers (n) in a typical AGM separator can be obtained using the following expressions [53].
; and (8)
b m bf
b
nbb mn1
where ; ;
I V
D
b Vf
8 ) 4 (
bb DR bf b bb
;
;
0 0
) , ( sin ) , ( ) ,
( K d
J
d p
0 0sin ( , , , )
sin ) , ) (
,
( d
d Kp
;
sin ) , ( ) , (
0
0
d d Kp
R
s s
sin 1
sin 1 1 1
Accordingly, the hindrance to the flow of oxygen gas is being developed due to the presence of free fiber segments and overlapping fibers. Thus, the tortuosity of AGM separators can be computed by calculating the weighted averaged tortuosity of all possible tortuous paths in an RVE based upon the densities and distributions of free fiber segments and those of overlapping fibers.
Further, it should be noted that there is a large variation in constituent fiber dimensions, thus, the fiber diameter (D) should be replaced by the mean fiber diameter (D).
2.2 Hydraulic Tortuosity
Let us assume that the glass fibers have circular cross-sections such that these fibers are aligned in a specific direction and when sectioned by a plane normal to the principal axes, the cross-sections are registered as ellipses (see Fig. 1c and 1d). In such a scenario, the flow of oxygen gas is obstructed either by the presence of free fiber elliptical segments or by means of overlapping ellipses. Consider the first case, when the oxygen gas is being hindered by the presence of free fiber segments forming a rectangular unit cell (KLMN) in the sectioning plane AA’ (see Fig. 1c).
Here, the gaps between the free fiber segments are considered to be equivalent to the hydraulic pore diameter (DH), a concept introduced previously in order to overcome the issue of non-circular and irregular pores [54]. In other words, the hydraulic pore represents the channels that have the same macroscopic properties as those of the actual system [55]. It is important to note that the width and depth of pore space dictates the quantity of fluid flow and the free distance traveled by
the fluid [47]. This concept has formed an important basis in our modeling strategy as the hydraulic diameter in the out-of-plane and in-plane directions represents the pore space in the width-wise and depth-wise directions, respectively. To simplify the analysis, the free fiber segment can be divided into three distinct and equal regions such that the straight pathways follow the direction of macroscopic flux by simply tracing the fiber segments whilst passing through the pore space (see the passage of oxygen gas in Fig. 1c) [51]. Therefore, the average hydraulic tortuosity (f) created by the free fiber segment in the AGM separator is given by
f (9)
f f
f 1 2 3
3 1 3
1 3
1
where 1f, 2f , and 3fare the tortuosities created by fiber segments in the equally spaced regions I, II, and III, respectively.
Due to symmetry, the regions I and III have the same level of tortuosity [51], therefore,
f (10)
f
f 1 2
3 1 3
2
Consider the unit cell (KLMN) formed by elliptical cross-sections of fibers, where the pore spaces are represented in the width-wise and depth-wise directions by the hydraulic diameters in the out- of-plane and in-plane directions, respectively (see Fig. 1c). The actual length of the fluid path includes tracing the surface of fiber segments depending upon the striking region. For region I, the hydraulic tortuosity (1f ) is given by,
D (11) D
F E D
D
ih ih
f
2 /
1
where Dih is the mean in-plane hydraulic pore diameter, and is the mean fiber diameter. D
Considering the fluid flow in the in-plane direction, the mean in-plane hydraulic pore diameter can be computed using an orientation averaging approach [56,57], i.e.
(12)
0
2 0
sin ) cos(
, 1
d d
V
V D D
f f
f ih
where ;
f f AGM
V
T mAGM
AGM
where Vf is the fiber volume fraction, f is the in-plane direction of the fluid flow, f is the density of glass fibers,AGM, mAGM and T are the bulk density, mass per unit area and thickness of an AGM separator, respectively.
Further, the mean hydraulic diameter can be calculated by considering all directions of f (i.e.
values between 0 and ), i.e.
(13)
f ff
f ih
d d V d
V D D
0 0
2 0
sin ) cos(
, 1
For simplification, EF~ as the elliptical arc is replaced by a circular arc of equivalent 4
D
diameter. Therefore,
D (14) D
D D
D
ih ih
f
/2 ( /4)
1
Similarly, the hydraulic tortuosity can be computed for region II, i.e.
D (15) D
G E D D
ih ih
f
2 /
2
Here, EGis the quarter of the perimeter of an ellipse with the major radius as , which is 2
f / b given by [58],
(16) )
2 E(k G b
E f
where
2 ,0
2 2sin 1
) (
dz z k
k E
2
1
bf
k D
where E(k) is the complete elliptic integral of the second kind, and k is the eccentricity of the ellipse.
Combining equations (15) and (16),
) (17) (
2
) ( 2
2 D D
k E b D D
ih f ih
f
Now consider the second case, whereby the oxygen gas is being hindered by the presence of overlapping fibers that form a rectangular unit cell in the sectioning plane BB’ (see Fig. 1d). This is similar to the first case, except the fact that the hydraulic tortuosity is created by overlapping fibers in region I (1b) as,
D (18) D
D D Dih
b 2
) 4 / ( 5 . 1
1
For region II, the hydraulic tortuosity created by overlapping fibers (2b) is given by the following expression. In this case, the ellipse has a major radius of bb/2 in region II, therefore,
) (19) 2 (
2
) ( 3
2
2 D D
l E b D D
ih ih b
b
where
2 ,0
2 2sin 1
) (
dz z l
l E
2
1
bb
l D
where E(l) is the complete elliptic integral of the second kind, and l is the eccentricity of ellipse.
Similar to the overall free fiber segment tortuosity, the mean hydraulic tortuosity created by overlapping fibers is given by
b (20)
b
b 1 2
3 1 3
2
Thus, the overall hydraulic tortuosity of an AGM separator ( ) can be computed by calculating the weighted average of tortuosities based upon the proportion of the mean free fiber length (m) and also on the proportion of the mean overlapping length of fibers (n), i.e.
b (21)
f n
m
Thus, the overall hydraulic tortuosity of AGM separator can be computed by combining equations (8), (10), (14), (17-19), and (21). Further, it should be noted that the above equation for computing the overall hydraulic tortuosity of AGM separator is not valid for particular cases, i.e. Vf 0 and
as they have no practical interest, which is similar to the tortuosity model formulated for
1 Vf
randomly packed particles [55].
2.3 Pore size distribution
In a VRLA battery, the optimal transportation of oxygen gas is assisted via the presence of thru- plane pores. Recently, we have developed a 3D model to predict the pore size distribution of AGM separators using a well-known sieving percolation theory that presumed the circular pores of diameter (d) to follow the gamma distribution [31,46]. Here, the cumulative probability of obtaining a circle of diameter equal or less than d inscribed in a polygonal network of fibers that form defined number of layers (N) in an AGM separator, Ff(d), is given by [46],
(22)
N d
f d e
d d
F
1 2 1 ) (
2 2
where
0 0
, sin 8 cos
d D d
Vf
where is the coverage parameter, and N is the number of layers, i.e. the ratio of the thickness of an AGM separator to the fiber diameter [59].
Previously, the predictive model of pore size distribution was assessed through capillary flow porometry that employed a high level of compressive stresses [31]. In the present work, microCT analysis in combination with a commercial post-processing image analysis software, i.e. CTAn® (Bruker) has extracted the pore size distribution of AGM separators reliably. The pore size distribution obtained via post-processing of microCT data has been compared with the results attained through predictive modeling.
3. Materials and Methods
Various porous characteristics of commercially available AGM samples were obtained using X- ray micro-computed tomography analysis with the help of X-ray Microtomography equipment (Bruker SkyScan 2211). The details of commercially available AGM samples are given in Table 1. A tungsten target was used for focusing the X-rays with a source voltage of 50 kV and a current of 600 µA. The samples were scanned with the open filter assembly in order to allow the sample stage to be in the closest proximity with the X-ray source for the realization of maximum possible image resolution. In this research work, the X-ray exposure time of 600 ms was kept by employing a rotation step of 0.15o over an angular range of 180o, which resulted in 2300-2400 projected images. Subsequently, the images were reconstructed with the help of the commercially available NRecon Reconstruction Software and the CtVox software (Skyscan, Bruker, Belgium). The quality of the scanned images of the cross-sectional area of 2 mm x 1.5 mm with varying thickness was improved by applying beam hardening correction, defect pixel masking and ring artefact reduction techniques.
3.1 Pre-processing of images
Following the reconstruction of X-ray microCT images, the obtained experimental data tend to be susceptible to certain irregularities such as noise, binarization artefacts, etc. [60]. In the case of AGM separators, such irregularities were noticeable as the image resolution is comparable to that of the dimensions of the structural elements. To overcome such issues, an edge-preserving median filter was applied to smoothen out the noise, followed by the segmentation of the images using the Otsu automatic thresholding technique [61]. Segmentation separated the foreground from the
background and converted the greyscale tomogram into a binary image by considering the material and void phases as white and black colored entities, respectively. Since the constituent microglass fiber diameter and image resolution were comparable, accordingly, the kernel size of the filter was kept small. This allowed the despeckle operation in 3D by removing small white speckles, which were generated due to the binarization of noise but inadvertently passed through the filter.
3.2 Porosity
The porosity was determined by counting the voxels in a defined volume of interest (VOI) of 3 mm3, which were identified on the segmented X-ray microCT images via CTAn® (Bruker, Belgium) by inverting the binary images to convert the pore phase into material phase. The ratio of the number of voxels occupied by the material phase to the total number of voxels that constitute the VOI has yielded the porosity of the sample. It should be noted that the VOI is strategically chosen in a manner to avoid the boundary irregularities that can occur during specimen cutting.
The variation of porosity with thickness was also determined by successively increasing the z- dimension of VOI by 100 voxels. Here, the z-axis refers to the thru-thickness direction of the sample.
3.3 Pore size distribution
The pore size distribution of the AGM samples was determined from the extracted VOI using CTAn® by combining distance transform and local thickness algorithms. A distance transform algorithm was applied to the segmented images for obtaining the medial axis network of pore space. In general, the distance transform algorithm replaces each voxel with an intensity value corresponding to its distance from the nearest boundary, thereby, assigning highest intensity to the medial axis voxels [43]. Local thickness was estimated by fitting the spheres locally on each of
the brightest voxels such that each sphere includes the related voxel and touches the nearest object boundary. Subsequently, the fraction of pore volume occupied by the spheres of defined diameters was computed in order to determine the pore size distribution [44].
3.4 Fiber Diameter Distribution
The constituent fiber diameter and its variation were determined via the local thickness algorithm, which was employed to determine the pore size distribution. Here, the pore phase images were simply inverted to fiber phase images using CTAn® via the in-built bitwise NOT operator.
Subsequently, the local thickness algorithm was employed to obtain a volume-weighted distribution of fiber diameters. The distribution was then converted to a length-weighted distribution by presuming the constituent fibers as cylinders of defined volume and diameter.
3.5 Pore volume distribution
The fiber network obtained via X-ray microCT images was inverted to obtain the pore phase of the AGM separator. This porous volume was further individualized into separate voids using a
‘separate objects’ feature in Avizo® (Evaluation version). This feature utilizes a combination of watershed separation algorithm [45], distance maps and numerical reconstruction to divide the complete pore volume into individual void spaces based upon the fiber structure of the network.
3.6 Tortuosity
With the aid of an open source MATLAB based application, i.e. TauFactor [62], the diffusive tortuosity of AGM separators was quantified in the thru-thickness direction. The principle involved
is based upon the resistance offered to the transportation of a diffusive flux through a predefined conductive phase in a segmented 3D volume. Here, a tortuosity value of unity signifies that the flow path in the pore phase is free from any perturbations developed as a result of constituent fibers.
3.7 Fiber orientation distribution
Fiber orientation angles values in the in-plane and out-of-plane directions were also obtained using CTAn®.
4 Results and discussion
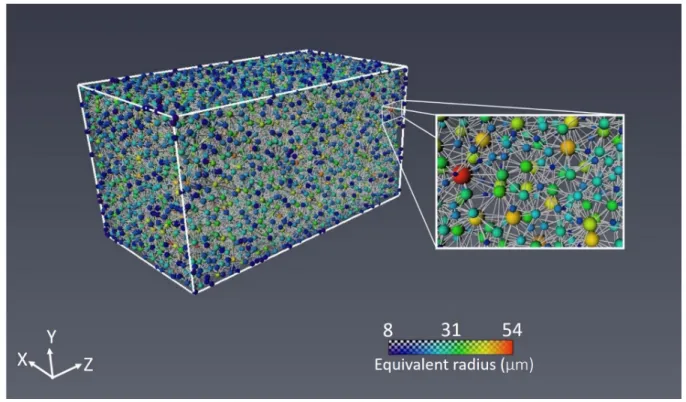
In general, an AGM separator possesses 3D anisotropic porous structure, which can be deciphered both in terms of fiber orientation, and pore geometry. Particularly, fiber orientation is a key structural parameter that not only dictates pore geometry [46] but also affects various physical, geometrical, wetting and mechanical characteristics [39,63]. Ball et al. [50] visualized the constituent glass fibers in AGM separator as 3D entities but limited works have been dedicated to quantify the 3D orientation of fibers [31,32,57]. Although numerous techniques are available to characterize the 3D orientation of fibers in an AGM separator, X-ray microCT is among the most suitable non-destructive methods that can be used for characterizing the structural aspects of AGM separators [36]. In this research work, the morphology of AGM separators was unveiled using X- ray microCT analysis (see Fig. 2 and supplementary movie 1). The 3D rendered image shows that the fibers are visible with a large variation both in terms of fiber alignment and fiber dimensions in addition to the volume covered by the pore in an AGM separator (see Fig. 2a).
To quantify the anisotropy in AGM separators, a color map of fiber alignment has been generated, as illustrated in Fig. 2b. Notably, the fibers are preferentially aligned in the vicinity of the machine (production) direction. From a 3D perspective, sample A shows preferential orientation having 43% of the fibers aligned at ±30° to the machine direction, as shown in Fig. 3. Samples B and C also reveal the preferential alignment of glass fibers with 52% of them aligned at ±45° to the machine direction, whereas sample D possesses a quasi-random structure. Interestingly, the out- of-plane orientation of all AGM samples followed a Gaussian distribution, with the majority of fibers orientated in the 90o or in the planar direction. Nevertheless, the fibers aligned in a 3D space not only block the passage of oxygen gas but can extend its path length. To a great extent, the alignment of fibers dictates the packing of glass fibers in an AGM separator [32]. In other words, porosity is another key structural parameter that needs to be quantified for AGM separators.
Fig. 2 Morphological analysis of a typical AGM separator (sample A) represented via (a) 3D rendered image, and (b) color mapping of fiber alignment (c) pore volume (indicated by gray color). Here, 0o in the in-plane fiber orientation distribution represents the machine (production) direction.
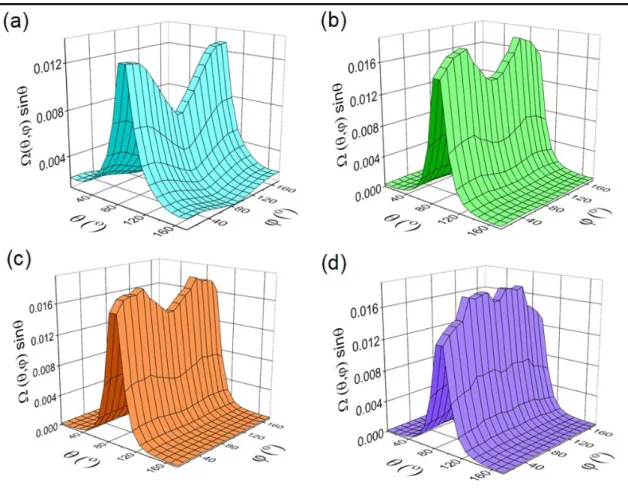
Fig. 3 3D fiber orientation distributions of AGM sample (a) A (b) B (c) C, and (d) D. Here, , and are the in-plane (azimuthal) and out-of-plane (polar) orientation angles, whereas
, is the probability density function. Here 0o represents the machine direction in the in-plane fiber orientation distribution, whereas 90o represents the planar direction in the out-of-plane fiber orientation distribution.Fig. 2c depicts the pore volume (indicated by gray color) covered in a typical AGM separator.
Quantitatively, a comparative analysis of the porosity values obtained using gravimetric method, and X-ray microCT analysis is shown in Table 1. Apparently, the porosity obtained using X-ray microCT analysis resulted in lower values than that of the gravimetric method. This can be attributed to the dilation of fibers, which has been carried out as a post-processing step for X-ray microCT images. Most importantly, the attenuation of X-rays at the material-void interface
generates a gradient of intensities at the fiber boundaries, also known as partial volume effect [64].
The smoothening filters enhance these voxels, and when included in the foreground of the images after segmentation, increase the fiber diameter. In the case of AGM separators this phenomenon can pose a serious issue as the image resolution (0.8-1 m) and the diameter of fibers are in close proximity. It should be noted that the dilation of even a single voxel can have a considerable effect on the fiber diameter.
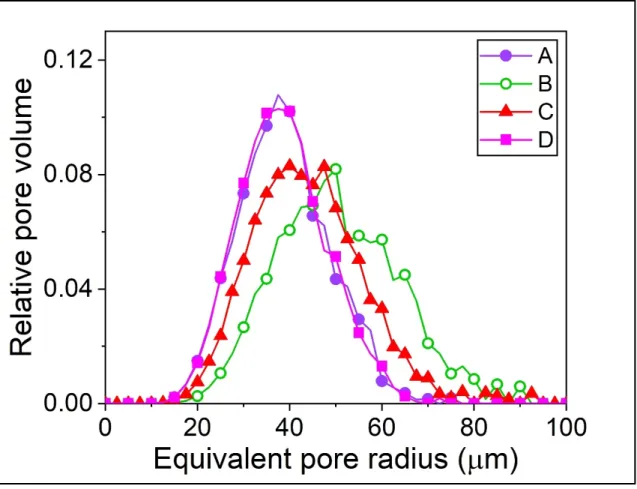
By definition, the porosity term evolves from the distribution of pore volumes; therefore, it is pertinent to analyze such characteristics. Fig. 4 shows the distribution of pore volumes in various AGM samples obtained via the post-processing of X-ray microCT analysis. Ostensibly, the distribution of pore volume follows a typical Gaussian distribution such that the majority of the void volume has been covered by an equivalent spherical pore of 35 μm diameter in case of samples A and D. However, a sphere of 50 μm diameter has covered the majority of the pore volume for samples B and C. Intriguingly, the spherically shaped pores have covered more than 99% of the porous network of AGM separators. Further, the local porosity along the thru-thickness direction has been analyzed and observed to be reasonably uniform and corroborated well with the overall porosity of AGM samples (see Fig. 5a and Table 1). Minimal local variation in porosity is essential to fulfill the functions related to oxygen transportation and electrolyte supply within the AGM separator [15].
Fig. 4 Pore volume distribution of AGM samples
It is also a known fact that porosity maneuvers the tortuous characteristics of any material [61].
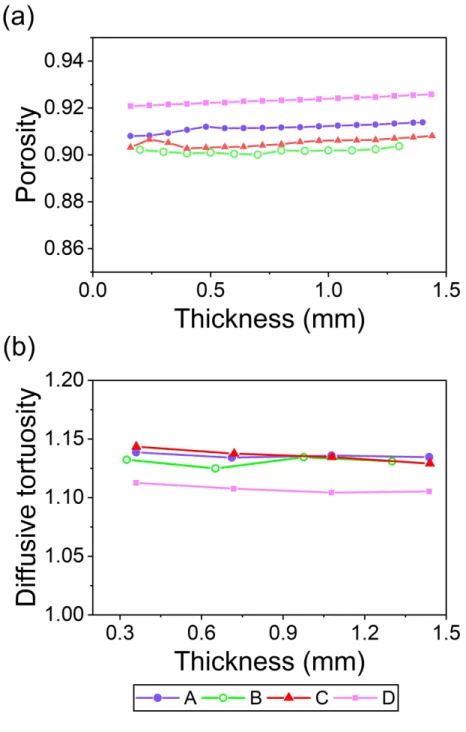
Accordingly, minimal local variations in diffusive tortuosity along the thru-thickness direction were also manifested (see Fig. 5b). Apparently, the diffusive tortuosity of sample D is lower than those of the other samples, which can be correlated with the quasi-random orientation of fibers in addition to the marginal increase in the porosity (see Figs. 3 and 5). Such a behavior clearly shows the importance of key structural parameters, i.e. fiber orientation distribution and porosity on the tortuous behavior of AGM separators.
Fig. 5 Variation of (a) porosity and (b) diffusive tortuosity along the thru-thickness direction. Here, the diffusive tortuosity has been computed in the thru-thickness direction via open source MATLAB based application, i.e. TauFactor [62].
The fiber orientation distribution and porosity obtained via X-ray microCT analysis served as key input parameters to predict the hydraulic tortuosity of AGM samples. A comparison has been made between the hydraulic tortuosity (by combining equations (8), (10), (14), (17-19), and (21)) and
the diffusive tortuosity obtained from TauFactor, as shown in Fig. 6. Surprisingly, the values of hydraulic and diffusive tortuosities for AGM separators are nearly in the same range. This is attributed to the large variability in the pore size distribution (see Fig. S1), which tends to yield the same magnitudes of hydraulic and diffusive tortuosities [65]. Notably, the porosity of AGM separators is significantly high (> 90%) that inevitably results in lower magnitudes of tortuosity.
Fig. 6 Diffusive and hydraulic tortuosities of AGM separators. Here, the diffusive tortuosity is computed via Taufactor [62] whereas the hydraulic tortuosity is predicted based upon the theoretical modeling.
To gain further understanding about the lower magnitudes of tortuosity, it is important to underpin the interconnectivity of pores. A highly porous structure tends to possess relatively more interconnectivity between the pores [66]. Fig. 7 shows the pore network model of a typical AGM separator revealing the interconnectivity between the pores. Indeed, the pore network model showed significantly higher pore interconnectivity with coordination number (number of
neighbors of each pore) as high as 42. High interconnectivity between the pores can leverage the oxygen recombination cycle that avoids water loss and grid-corrosion, and partially, fulfills the requirements of high-performance batteries [15,39]. On the other hand, the oxygen recombination cycle can be tuned by modulating the difference between the magnitudes of maximum and mean pore diameters. In other words, the understanding of pore size distribution is a pre-requisite for the successful functioning of AGM separators.
Fig. 7 Pore network model of sample D. Here, the magnified image shows network of pores represented using segments and spheres. The segment represents the pore body and the spheres depict either an end point or a connection point with another pore.
The previously developed analytical model of the pore size distribution for AGM separators has clearly revealed fiber diameter, fiber orientation, thickness and porosity as key fiber and structural parameters [31]. In this research work, the fiber diameter and its distribution played a pivotal role in tailoring the pore size distribution of AGM separators (see Figs. S1 and S2). Fig. S2 shows large
corresponding wider pore size distribution (see Fig. S1). Notably, the mean fiber diameter values obtained via X-ray microCT analysis were higher than the corresponding values determined from SEM analysis, as shown in Table 1 and Fig. S2. This is ascribed to the limitation of lower image resolution of X-ray microCT analysis, which has inevitably omitted fiber segments having diameters smaller than the pixel size. Further, the post-processing of X-ray microCT images has led to the averaging of fibers with diameters in the range of kernel size and thus, shifted the distribution towards the higher magnitude of fiber diameter. Nevertheless, the fiber diameter obtained via post-processing of X-ray microCT images has served as an input parameter in order to validate the previously developed model of pore size distribution [31].
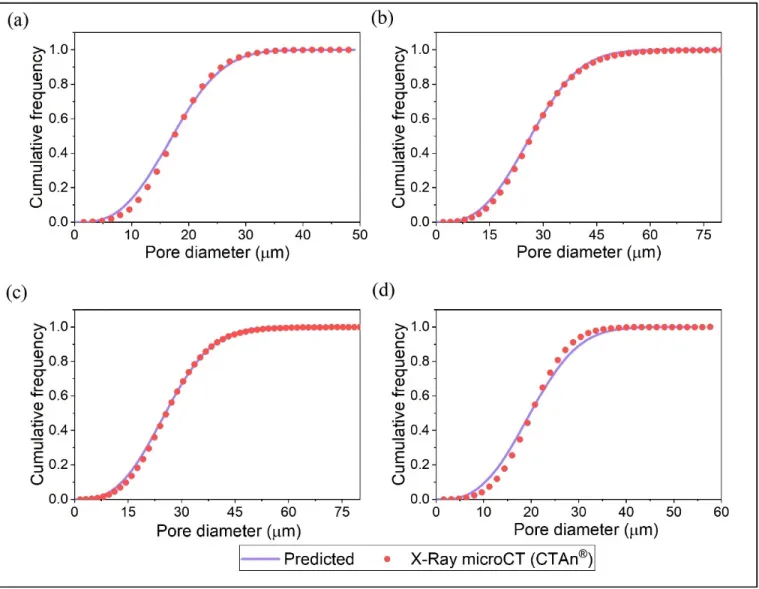
Fig. 8 shows a comparison between the pore size distribution obtained from the analytical model and the post-processing of X-ray microCT analysis using CTAn®. An excellent agreement has been observed for the pore size distribution of AGM separators obtained via analytical modeling and post-processing of X-ray microCT analysis. The predictive model and CTAn® shared similar principles for computing the pore size distribution as the latter allows local fitting of spheres of pre-defined diameters at the fiber boundaries, whereas the former modeling technique presumes pores as circular discs inscribed in a polygonal network of fibers [31]. Although current X-ray microCT analysis suffers from lower image resolution, it sets the stage to tailor the pore size distribution of AGM separators based upon predictive modeling. Previously, the predictive model was validated with the pore size data obtained from capillary flow porometry utilizing the same
levels of compressive stresses that were deployed during the measurement method [31].
Fig. 8 Comparison between the pore size distribution obtained via predictive modeling and post- processing of X-ray microCT analysis using CTAn® for AGM (a) sample A, (b) sample B, (c) sample C, and (d) sample D.
Such deployment of compressive stresses inevitably distorts the fibrous structure of the AGM separator, which has been successfully avoided using X-ray microCT analysis. Further, the analytical model of pore size distribution can guide us to tailor the ‘ideal’ AGM separator.
According to McGregor et al. [15], the ‘ideal’ AGM separator should possess the pore size in the
range of 10-30 m specifically in the thru-thickness direction. In this research work, samples B and C do not fulfil this criteria of ‘ideal’ AGM separators. The analytical model of pore size distribution can assist in fulfilling such a criteria by simply altering the fiber orientation distribution of AGM separators. For example, the experimentally obtained fiber orientation of samples B and C has been replaced by a 3D random orientation distribution to reduce the pore size (see Fig. S3), which has successfully allowed us to meet the criteria defined for ‘ideal’ AGM separators [15,31]. Pragmatically, fiber orientation can be controlled during the wet-laying process, which is generally used for the manufacturing of AGM separators. Future development of analytical models should account for the key parameters of the wet-laying process, which would eventually lead to the successful development of ‘ideal’ AGM separators.
5. Conclusions
The presented work has provided insights about the porous characteristics of AGM separators through X-ray microCT analysis in a systematic manner. Specifically, X-ray microCT analysis has been used to quantify the structural parameters via image-based modeling techniques to obtain the spatial information of fiber orientation, porosity, tortuosity, pore size distributions, pore interconnectivity and pore volume distributions. The (an)isotropic characteristics of AGM separators have been unveiled through 3D fiber orientation distribution. The majority of AGM samples examined in this work exhibited anisotropic behavior specifically in the machine (production) direction. In general, the porosity obtained via X-ray microCT analysis exhibited lower values than those determined using the gravimetric method, which has been ascribed to the partial volume effect [64]. Despite the fact the X-ray microCT analysis is limited by lower image resolution, the magnitudes of local porosity and diffusive tortuosity were observed to be reasonably uniform along the thru-thickness direction. Further, a 3D analytical model has been
proposed to predict the hydraulic tortuosity of AGM separators based upon a key set of fiber and structural parameters that were obtained via X-ray microCT analysis. Intriguingly, the lower magnitudes of hydraulic and diffusive tortuosities for AGM separators suggested higher interconnectivity between the pores, which was also evident through the pore network model of the AGM separator. One of the merits of the presented work can be foreseen in terms of obtaining the pore size distribution via X-ray microCT analysis without deploying any kind of stresses that distort the AGM structure. Moreover, an excellent agreement has been observed between the pore size distribution of AGM separators obtained via the previously developed analytical model [31]
and through X-ray microCT analysis. It is anticipated that X-ray microCT can be a way forward for characterizing various geometrical and physical properties of AGM separators in a non- destructive manner. This technique can serve as a roadmap to gain insights about the internal and heterogeneous structure of AGM separators that can be utilized for designing ‘ideal’ AGM separators.
Acknowledgements
The authors gratefully acknowledge the financial support by Indo-Hungarian joint research project no. INT/HUN/P-18/2017 (2017-2.3.7-TÉT-IN-2017-00008). Additional support from the
Hungarian National Research, Development and Innovation Office through the projects GINOP- 2.3.2-15-2016-00013 and GINOP-2.3.3-15-2016-00010, and the Ministry of Human Capacities, Hungary, grant 20391-3/2018/FEKUSTRAT is also acknowledged. D.S. is very thankful for the financial support from the János Bolyai Research Scholarship of the Hungarian Academy of Sciences.
References
[1] T. Isoi, H. Furukawa, Valve-regulated lead/acid batteries for SLI use in Japan, J. Power Sources. 59 (1996) 143–146.
[2] P.T. Moseley, D.A. Rand, K. Peters, Enhancing the performance of lead–acid batteries with carbon–In pursuit of an understanding, J. Power Sources. 295 (2015) 268–274.
[3] Q. Long, G. Ma, Q. Xu, C. Ma, J. Nan, A. Li, H. Chen, Improving the cycle life of lead-acid batteries using three-dimensional reduced graphene oxide under the high-rate partial-state- of-charge condition, J. Power Sources. 343 (2017) 188–196.
[4] P.T. Moseley, High rate partial-state-of-charge operation of VRLA batteries, J. Power Sources. 127 (2004) 27–32.
[5] Y. Zeng, J. Hu, W. Ye, W. Zhao, G. Zhou, Y. Guo, Investigation of lead dendrite growth in the formation of valve-regulated lead-acid batteries for electric bicycle applications, J. Power Sources. 286 (2015) 182–192.
[6] V. Toniazzo, The key to success: Gelled-electrolyte and optimized separators for stationary lead-acid batteries, J. Power Sources. 158 (2006) 1124–1132.
[7] J. Garche, P.T. Moseley, E. Karden, Lead–acid batteries for hybrid electric vehicles and battery electric vehicles, in: Adv. Battery Technol. Electr. Veh., Elsevier, 2015: pp. 75–101.
[8] A.L. Ferreira, A multi-layered approach for absorptive glass-mat separators, J. Power Sources. 78 (1999) 41–45.
[9] P.T. Moseley, Improving the valve-regulated lead–acid battery, J. Power Sources. 88 (2000) 71–77.
[10] A. Kirchev, D. Pavlov, B. Monahov, Gas-diffusion approach to the kinetics of oxygen recombination in lead-acid batteries, J. Power Sources. 113 (2003) 245–254.
[11] Y. Guo, J. Wu, L. Song, M. Perrin, H. Doering, J. Garche, The behavior of oxygen transport in valve-regulated lead-acid batteries with absorptive glass mat separator, J.
Electrochem. Soc. 148 (2001) A1287–A1293.
[12] B. Culpin, Separator design for valve-regulated lead/acid batteries, J. Power Sources. 53 (1995) 127–135.
[13] E. Nann, Improving the performance of deep-cycling, valve-regulated, lead/acid batteries, J. Power Sources. 33 (1991) 93–103.
[14] C. Lu, T.K. Hoang, T.N.L. Doan, H. Zhao, R. Pan, L. Yang, W. Guan, P. Chen,
Rechargeable hybrid aqueous batteries using silica nanoparticle doped aqueous electrolytes, Appl. Energy. 170 (2016) 58–64.
[15] K. McGregor, H. Ozgun, A.J. Urban, G.C. Zguris, Essential characteristics for separators in valve-regulated lead–acid batteries, J. Power Sources. 111 (2002) 288–303.
[16] B. Drenchev, M. Dimitrov, V. Boev, A. Aleksandrova, Absorptive glass mat separator surface modification and its influence on the heat generation in valve-regulated lead-acid battery, J. Power Sources. 280 (2015) 66–73.
[17] Y. Nakayama, K. Kishimoto, S. Sugiyama, S. Sakaguchi, Micro-structural design and function of an improved absorptive glass mat (AGM) separator for valve-regulated lead–acid batteries, J. Power Sources. 107 (2002) 192–200.
[18] M.R. Palacín, A. de Guibert, Why do batteries fail?, Science. 351 (2016) 1253292.
[19] G.C. Zguris, Advances in recombinant battery separator mat (RBSM) separators for lead- acid batteries—a review, J. Power Sources. 107 (2002) 187–191.
[20] G.C. Zguris, Fluid-transfer properties of recombinant battery separator media, J. Power Sources. 88 (2000) 36–43.
[21] G.C. Zguris, A broad look at separator material technology for valve-regulated lead/acid batteries, J. Power Sources. 73 (1998) 60–64.
[22] D. Berndt, Valve-regulated lead-acid batteries, J. Power Sources. 100 (2001) 29–46.
[23] J.E. Manders, L.T. Lam, K. Peters, R.D. Prengaman, E.M. Valeriote, Lead/acid battery technology, J. Power Sources. 59 (1996) 199–207.
[24] D. Pavlov, G. Papazov, V. Iliev, Mechanism of the Processes of Formation of Lead-Acid Battery Positive Plates, J. Electrochem. Soc. 119 (1972) 8–19.
[25] B. Culpin, Thermal runaway in valve-regulated lead-acid cells and the effect of separator structure, J. Power Sources. 133 (2004) 79–86.
[26] M.J. Weighall, Techniques for jar formation of valve-regulated lead–acid batteries, J.
Power Sources. 116 (2003) 219–231.
[27] S. Schaeck, A.O. Stoermer, F. Kaiser, L. Koehler, J. Albers, H. Kabza, Lead-acid
batteries in micro-hybrid applications. Part I. Selected key parameters, J. Power Sources. 196 (2011) 1541–1554.
[28] V. Toniazzo, U. Lambert, Developments in absorptive glass mat separators for cycling applications and 36 V lead- acid batteries, J. Power Sources. 133 (2004) 94–103.
[29] M.J. Weighall, The Function of the Separator in the Valve-regulated Lead-Acid Battery, in: Valve-Regul. Lead-Acid Batter., Elsevier, 2004: pp. 163–181.
[30] A. Rawal, H. Saraswat, Pore size distribution of hybrid nonwoven geotextiles, Geotext.
Geomembr. 29 (2011) 363–367.
[31] A. Rawal, P.K. Rao, V. Kumar, Deconstructing three-dimensional (3D) structure of absorptive glass mat (AGM) separator to tailor pore dimensions and amplify electrolyte uptake, J. Power Sources. 384 (2018) 417–425.
[32] P.K. Rao, A. Rawal, V. Kumar, K.G. Rajput, Compression-recovery model of absorptive glass mat (AGM) separator guided by X-ray micro-computed tomography analysis, J. Power Sources. 365 (2017) 389–398.
[33] S.S. Manickam, J.R. McCutcheon, Characterization of polymeric nonwovens using porosimetry, porometry and X-ray computed tomography, J. Membr. Sci. 407 (2012) 108–
115.
[34] C. Tötzke, G. Gaiselmann, M. Osenberg, J. Bohner, T. Arlt, H. Markötter, A. Hilger, F.
Wieder, A. Kupsch, B.R. Müller, Three-dimensional study of compressed gas diffusion layers using synchrotron X-ray imaging, J. Power Sources. 253 (2014) 123–131.
[35] T. Ishikawa, Y. Ishii, K. Nakasone, Y. Ohkoshi, K. Kyoung Hou, Structure analysis of needle-punched nonwoven fabrics by X-ray computed tomography, Text. Res. J. (2017) 0040517517736470.
[36] A. Rawal, P.K. Rao, V. Kumar, A. Kukovecz, A critical review on the absorptive glass mat (AGM) separators synergistically designed via fiber and structural parameters, J. Power Sources. 430 (2019) 175–192.
[37] F.L. Tye, Tortuosity, J. Power Sources. 9 (1983) 89–100.
[38] F.L. Tye, A.L.S. Vasanthakumar, Simple but informative experiments on a plain separator for lead-acid batteries, J. Power Sources. 15 (1985) 157–167.
[39] B. Culpin, K. Peters, Saturation influences on the performance of valve-regulated lead–
acid batteries, J. Power Sources. 144 (2005) 313–321.
[40] A. Jena, K. Gupta, Liquid extrusion techniques for pore structure evaluation of nonwovens, Int. Nonwovens J. 12 (2003) 45–53.
[41] A. Jena, K. Gupta, Characterization of pore structure of filtration media, FluidParticle Sep. J. 14 (2002) 227–241.
[42] A. Duda, Z. Koza, M. Matyka, Hydraulic tortuosity in arbitrary porous media flow, Phys.
Rev. E. 84 (2011) 036319.
[43] É. Rémy, É. Thiel, Medial axis for chamfer distances: computing look-up tables and neighbourhoods in 2D or 3D, Pattern Recognit. Lett. 23 (2002) 649–661.
[44] T. Hildebrand, P. Rüegsegger, A new method for the model-independent assessment of thickness in three-dimensional images, J. Microsc. 185 (1997) 67–75.
[45] S. Beucher, F. Meyer, The morphological approach to segmentation: the watershed transformation, Opt. Eng.-N. Y.-Marcel Dekker Inc.-. 34 (1992) 433–433.
[46] A. Rawal, Structural analysis of pore size distribution of nonwovens, J. Text. Inst. 101 (2010) 350–359.
[47] T. Komori, K. Makishima, Geometrical expressions of spaces in anisotropic fiber assemblies, Text. Res. J. 49 (1979) 550–555.
[48] T. Komori, K. Marishima, Estimation of fiber orientation and length in fiber assemblies, Text. Res. J. 48 (1978) 309–314.
[49] G.C. Zguris, ‘Density/solidity’of recombinant battery separator material—its influence on both separator and battery performance in valve-regulated lead- acid systems, J. Power Sources. 133 (2004) 67–78.
[50] R.J. Ball, R. Evans, R. Stevens, Characterisation of separator papers for use in valve regulated lead/acid batteries, J. Power Sources. 104 (2002) 208–220.
[51] A.E. Khabbazi, J. Hinebaugh, A. Bazylak, Analytical tortuosity–porosity correlations for Sierpinski carpet fractal geometries, Chaos Solitons Fractals. 78 (2015) 124–133.
[52] N. Pan, J. Chen, M. Seo, S. Backer, Micromechanics of a planar hybrid fibrous network, Text. Res. J. 67 (1997) 907–925.
[53] N. Pan, A modified analysis of the microstructural characteristics of general fiber assemblies, Text. Res. J. 63 (1993) 336–345.
[54] V. Kumar, P.K. Rao, A. Rawal, Amplification of electrolyte uptake in the absorptive glass mat (AGM) separator for valve regulated lead acid (VRLA) batteries, J. Power Sources. 341 (2017) 19–26.
[55] P.-Y. Lanfrey, Z.V. Kuzeljevic, M.P. Dudukovic, Tortuosity model for fixed beds randomly packed with identical particles, Chem. Eng. Sci. 65 (2010) 1891–1896.
[56] N. Mao, S.J. Russell, Capillary pressure and liquid wicking in three-dimensional nonwoven materials, J. Appl. Phys. 104 (2008) 034911.
[57] A. Rawal, P.K. Rao, V. Kumar, S. Sharma, S. Shukla, D. Sebők, I. Szenti, A. Kukovecz, Optimal design of absorptive glass mat (AGM) separator with fastest electrolyte uptake using X-ray micro-computed tomography, J. Energy Storage. 21 (2019) 505–509.
[58] T.R. Chandrupatla, T.J. Osler, The perimeter of an ellipse., Math. Sci. 35 (2010).
[59] Y. Faure, J.P. Gourc, F. Millot, S. Sunjoto, Theoretical and experimental determination of the filtration opening size of geotextiles, in: Proc. Third Int. Conf. Geotext. Vienna, 1986:
pp. 1275–1280.
[60] G. Gaiselmann, C. Tötzke, I. Manke, W. Lehnert, V. Schmidt, 3D microstructure modeling of compressed fiber-based materials, J. Power Sources. 257 (2014) 52–64.
[61] I.V. Zenyuk, D.Y. Parkinson, L.G. Connolly, A.Z. Weber, Gas-diffusion-layer structural properties under compression via X-ray tomography, J. Power Sources. 328 (2016) 364–376.
[62] S.J. Cooper, A. Bertei, P.R. Shearing, J.A. Kilner, N.P. Brandon, TauFactor: An open- source application for calculating tortuosity factors from tomographic data, SoftwareX. 5 (2016) 203–210.
[63] A. Rawal, P.V. Kameswara Rao, S. Russell, A. Jeganathan, Effect of fiber orientation on pore size characteristics of nonwoven structures, J. Appl. Polym. Sci. 118 (2010) 2668–2673.
[64] S. Schlüter, A. Sheppard, K. Brown, D. Wildenschild, Image processing of multiphase images obtained via X-ray microtomography: a review, Water Resour. Res. 50 (2014) 3615–
3639.
[65] B. Ghanbarian, A.G. Hunt, R.P. Ewing, M. Sahimi, Tortuosity in porous media: a critical review, Soil Sci. Soc. Am. J. 77 (2013) 1461–1477.
[66] R.W. Vervoort, S.R. Cattle, Linking hydraulic conductivity and tortuosity parameters to pore space geometry and pore-size distribution, J. Hydrol. 272 (2003) 36–49.
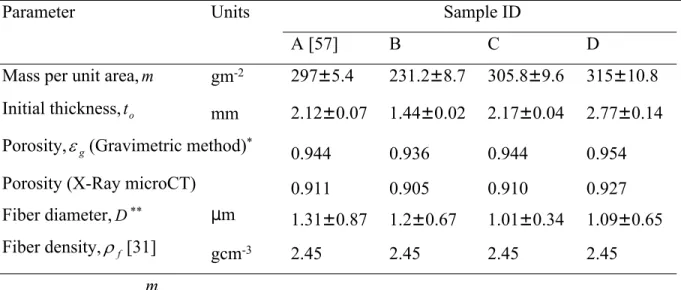
Table 1 Physical characteristics of AGM separators
Parameter Units Sample ID
A [57] B C D
Mass per unit area,m gm-2 297±5.4 231.2±8.7 305.8±9.6 315±10.8 Initial thickness,to mm 2.12±0.07 1.44±0.02 2.17±0.04 2.77±0.14 Porosity,g(Gravimetric method)* 0.944 0.936 0.944 0.954
Porosity (X-Ray microCT) 0.911 0.905 0.910 0.927
Fiber diameter,D** µm 1.31±0.87 1.2±0.67 1.01±0.34 1.09±0.65
Fiber density,f[31] gcm-3 2.45 2.45 2.45 2.45
*
o f f
g t
V m
1 1
** Fiber diameter values were obtained via scanning electron microscopy analysis


![Fig. 6 Diffusive and hydraulic tortuosities of AGM separators. Here, the diffusive tortuosity is computed via Taufactor [62] whereas the hydraulic tortuosity is predicted based upon the theoretical modeling](https://thumb-eu.123doks.com/thumbv2/9dokorg/999862.62005/28.918.113.729.333.788/diffusive-hydraulic-tortuosities-separators-tortuosity-taufactor-tortuosity-theoretical.webp)