Spa-RQ: an image Analysis tool to Visualise and Quantify Spatial phenotypes Applied to non-Small cell Lung cancer
Jie Bao
1, Margarita Walliander
1, ferenc Kovács
2, Ashwini S. nagaraj
1, Annabrita Hemmes
1, Virinder Kaur Sarhadi
3, Sakari Knuutila
3, Johan Lundin
1,4, peter Horvath
1,5&
emmy W. Verschuren
1*to facilitate analysis of spatial tissue phenotypes, we created an open-source tool package named
‘Spa-RQ’ for ‘Spatial tissue analysis: image Registration & Quantification’. Spa-RQ contains software for image registration (Spa-R) and quantitative analysis of DAB staining overlap (Spa-Q). it provides an easy-to-implement workflow for serial sectioning and staining as an alternative to multiplexed techniques. to demonstrate Spa-RQ’s applicability, we analysed the spatial aspects of oncogenic KRAS-related signalling activities in non-small cell lung cancer (nScLc). Using Spa-R in conjunction with ImageJ/Fiji, we first performed annotation-guided tumour-by-tumour phenotyping using multiple signalling markers. This analysis showed histopathology-selective activation of PI3K/AKT and MAPK signalling in Kras mutant murine tumours, as well as high p38MAPK stress signalling in p53 null murine nScLc. Subsequently, Spa-RQ was applied to measure the co-activation of MApK, AKt, and their mutual effector mTOR pathway in individual tumours. Both murine and clinical NSCLC samples could be stratified into ‘MAPK/mTOR’, ‘AKT/mTOR’, and ‘Null’ signature subclasses, suggesting mutually exclusive MAPK and AKT signalling activities. Spa-RQ thus provides a robust and easy to use tool that can be employed to identify spatially-distributed tissue phenotypes.
Epithelial cells are locally influenced by neighbouring stromal cells and secreted molecules, as well as tissue gradi- ents in oxygenation and mechanical forces1,2. During carcinoma progression, such factors contribute to microen- vironmental heterogeneity which, in conjunction with tumour cell-intrinsic genetic and molecular heterogeneity, fosters tumour evolution and compromises treatment success3–5. Tumour heterogeneity can be interrogated by gene-centric methods, such as multi-regional or single cell spatial sequencing, or by phenotypic assays, such as high-content in vitro imaging or tissue profiling using immunohistochemistry (IHC) analyses. Recent advances in multiplexed staining techniques have deepened our understanding of spatial phenotypes at tissue levels and yielded data with clinical relevance6–8. Although powerful in principle, practical factors limit flexible implementa- tion of multiplexed strategies, including availability of specific antibodies of varying host species or signal unmix- ing accuracy. No such issues exist for the staining of serial sections using standard IHC. However, this requires image analysis software that integrates image registration, annotation, and spatial signal quantification.
NSCLC accounts for 85% of all lung cancers and constitutes a heterogeneous set of diseases with complex genomic landscapes9,10. Therapies targeting mutations in the EGFR and ALK proteins are available, but these mutations are only detected in a small portion of NSCLCs11. Personalised medicine efforts currently focus on the identification of sample-specific drug sensitivities, or synergistic combinatorial strategies. However, drug-response studies are mostly done in vitro using biochemical means following extrinsic modulation, despite the knowledge that oncogenic functions are dynamically and spatially regulated within tumours. Furthermore, the oncogenic signalling landscapes of tumours or cancer cell lines are typically characterised by genetic
1Institute for Molecular Medicine Finland (FIMM), HiLIFE, University of Helsinki, Helsinki, 00014, Finland. 2Single-Cell Technologies Ltd, Szeged, Hungary. 3Department of Pathology, Haartman Institute, University of Helsinki, Helsinki, Finland. 4Department of Public Health Sciences, Karolinska Institutet, Stockholm, Sweden. 5Synthetic and Systems Biology Unit, Hungarian Academy of Sciences, Biological Research Center, Temesvári körút 62, 6726, Szeged, Hungary. *email: emmy.verschuren@helsinki.fi
open
profiling12 or mass spectrometry-based multi-omics analysis13, while the spatial aspects of networked oncogenic activities in native tumour tissues remain understudied.
The PI3K/AKT and MAPK pathways are frequently activated in cancers, including KRAS mutant NSCLCs, and around 30% of adenocarcinomas (ACs) and 3% of squamous cell carcinomas (SCCs) contain KRAS muta- tions14. By using NSCLC tumours from genetically engineered mouse models (GEMMs) driven by KrasG12D expression together with loss of Lkb1 (KrasG12D; Lkb1fl/fl, hereafter called KL) or p53 (KrasG12D; p53fl/fl, hereafter called KP), we previously demonstrated that NSCLC histopathologies exhibit differences in oncogenic signalling activities15. We further showed that an increased spatial overlap of phosphorylated ERK and 4EBP1, respec- tively marking MAPK and mTOR pathway activities, was associated with increased cytotoxic response towards co-inhibition of these pathways in murine tumour slice explants15. This highlights that baseline oncogenic sig- nalling phenotypes in tumour tissues may inform on drug sensitivity. Hence, we created a Spatial tissue analysis tool package for image Registration and Quantification, called ‘Spa-RQ’, to enable image alignment and quantita- tive examination of spatial tissue phenotypes detected by standard histochemical 3,3’-diaminobenzidine (DAB) staining of adjacent tissue sections. This study describes the features of the Spa-RQ tool package, and demon- strates how its implementation permits dissection of the spatial oncogenic signalling profiles of native murine and human NSCLC samples.
Results
introduction of the Spa-RQ software tool package.
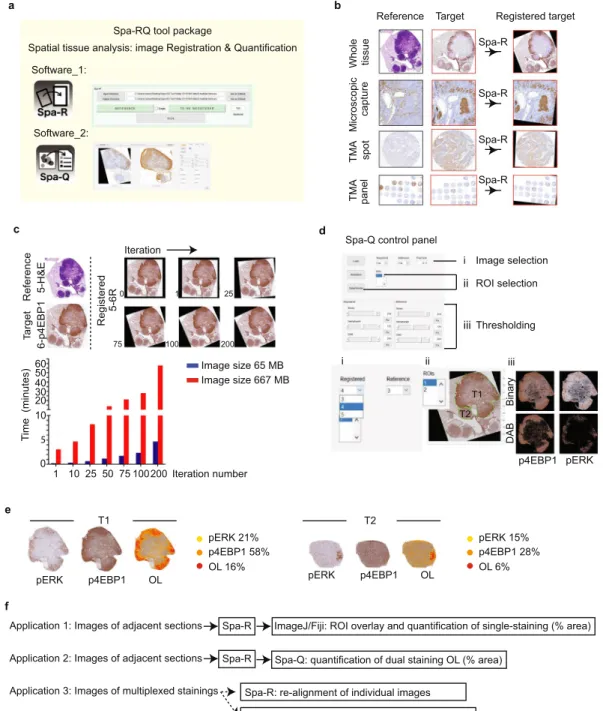
The Spa-RQ tool package was designed for spatial phenotyping on stained serial sections, as an easy-to-implement alternative to multiplexed strategies. It con- tains an image registration program named ‘Spa-R’, and a DAB quantification program named ‘Spa-Q’ (Fig. 1a).Spa-RQ is open-source, compatible with both Windows and Mac systems. In comparison to other open-source methods/software that operate on whole slide scans of serial sections16–18, it uniquely combines multiple image processing functions with a capacity to perform spatial analysis in selected regions-of-interest (ROIs).
Spa-R iteratively applies a similarity transformation method (the MATLAB
®
function imregtform) for image registration. It can be used to either register pairs or batches of input images in a variety of formats, including TIFF, JPEG or PNG, ranging from MB to GB in size. Image registration using Spa-R can be applied to a wide range of image captures, and generates newly registered uncompressed TIFF images as output (Fig. 1b). The iteration rate of the registration process can be manually adjusted, dependent on precision vs. processing speed considerations for a registration case (Fig. 1c). While selective additional parameters can be tested for registration optimization using Spa-R_optimizer (Supplementary Fig. S1a,b), Spa-R’s entire codebase is provided to enable computational optimization on registration tasks. A comparison of parameter optimization relative to the default settings, used for the registration of large >500 MB images, shows that the number of iterations is the major factor determining registration quality relative to registration speed (Supplementary Fig. S1d), while other factors have either less (PyramidLevels and InitialRadius; Supplementary Fig. S1c,e) or no effect (Epsilon and GrowthFactor;Supplementary Fig. S1f,g). Spa-R can be installed on multiple computers, and can thus be run in parallel with Spa-Q for optimal efficiency.
The Spa-Q image analysis program measures the areas (%) of two individual DAB signals and the area (%) of their overlap (OL). It is easy to operate and suitable for researchers with limited image analysis expertise. The con- trol panel of Spa-Q includes multiple image processing modules, specifically (i) image selection, (ii) ROI creation/
selection, and (iii) thresholding-based segmentation of tissue areas (binary thresholding), hematoxylin (segmen- tation of nuclei) and DAB-stained areas (Fig. 1d). Following image processing, the results folder is automatedly loaded with segmented images and an Excel sheet that lists the raw signal quantification results (percentages of individual DAB-stained areas, and area of OL per ROI). In addition, a pseudo-coloured mask depicting the two individual stainings in yellow and orange, and their OL area in red, is generated (Fig. 1e).
The next sections describe two proof-of-concept applications of the Spa-RQ tool package. In the first, Spa-R was used in conjunction with ImageJ/Fiji19 to perform annotation-guided quantification of multiple stainings on serial tissue sections (Application 1 in Fig. 1f). In the second application, Spa-RQ was used to quantify the spatial co-expression of two signalling markers, detected by staining on neighbouring tissue sections (Application 2 in Fig. 1f). Another possible application, not introduced here, is for re-alignment or quantification of multiplexed images (Application 3 in Fig. 1f). Importantly, Spa-RQ’s source code is freely available, and can be modified to match the user’s needs, for example to enable the quantitative analysis of fluorescent signals.
Using Spa-R for NSCLC histopathology-selective lesion profiling. The expression of oncogenic Kras together with loss of Lkb1 or p53 in murine lung progenitor cells gives rise to a spectrum of NSCLC lesions of different histopathologies20,21. These mice develop multiple tumours in the lungs, each marked by distinguishable histological features (Fig. 2a). We set out to use Spa-R to quantify NSCLC histopathology-selective oncogenic signalling activities, with primary focus on the PI3K/AKT, MAPK, and mTOR pathways, as well as the p38MAPK stress-sensing pathway (Fig. 2b). To achieve this, Spa-R was used to register DAB-stained images to their closest H&E reference (Fig. 2c). Registered DAB images were subsequently overlaid with the ROI mask generated by annotating the H&E references using ImageJ/Fiji, to permit quantification of DAB signal per ROI with ImageJ/
Fiji (Fig. 2d).
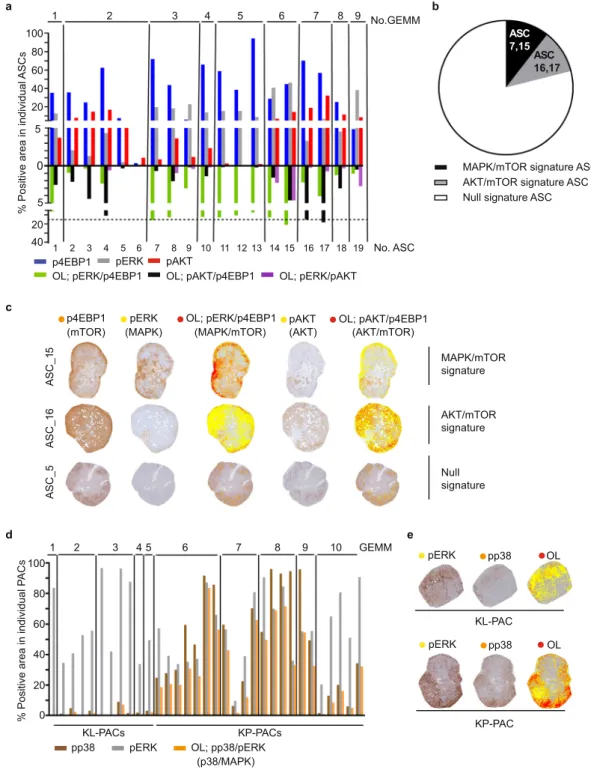
Lesions of the three most common histopathology types in KL and KP GEMMs, namely adenosquamous carcinoma (ASC), confined to KL mice, as well as papillary adenocarcinoma (PAC) and invasive adenocarcinoma (IAC) (Fig. 2e) were subjected to quantification of p4EBP1 (marking mTOR), pAKT (marking AKT), pERK (marking MAPK), and pp38 (marking p38MAPK) expression (Fig. 2f, Supplementary Fig. S2a). As reported15, phosphorylation of AKT was detected in ASCs but absent in PACs and IACs (P value < 0.0001). Furthermore, pERK expression was significantly higher in PACs than in IACs, suggesting differential MAPK regulatory pheno- types in these two AC subtypes (KL-PAC vs KL-IAC, individual tumours P value < 0.0001, grouped by animal P
value = 0.001; KP-PAC vs KP-IAC, individual tumours P value < 0.0001, grouped by animals P value = 0.0135).
MAPK signalling was activated more widely in PACs than ASCs (individual KL-PAC vs ASC P value = 0.0024, grouped by animals P value = 0.0257) (Fig. 2f,g, Supplementary Fig. S2a). p4EBP1 expression, on the other hand, was variable from lesion to lesion, showing no significant differences between the three histopathologies (Fig. 2f,g). Thus, NSCLC subtype-selective oncogenic signalling signatures were observed, with ASCs marked as ‘AKTpositive/MAPKlow-medium’, PACs as ‘AKTnegative/MAPKmedium-high’ and IACs as ‘AKTnegative/MAPKlow-medium’.
Interestingly, p38MAPK phosphorylation was found to be genotype-selective, showing pathway activation a
Spa-RQ tool package
Spatial tissue analysis: image Registration & Quantification b
Whole tissueMicroscopic capture
TMA spot
TMA panel
Reference Target Registered target
c
Spa-R
Spa-R Spa-R Spa-R
d Spa-Q control panel
f
Application 1: Images of adjacent sections Spa-R Application 2: Images of adjacent sections Spa-R
Application 3: Images of multiplexed stainings Spa-R: re-alignment of individual images
i Image selection ii
iii
ROI selection
Thresholding
e
pERK 15%
p4EBP1 28%
OL 6%
T1 T2
pERK 21%
p4EBP1 58%
OL 16%
ReferenceTarget
0 1 25
75 100 200
Iteration
5-H&E6-p4EBP1
Registered 5-6R
Iteration number Image size 667 MB Image size 65 MB 6050
4030 20
0
Time (minutes)
1 10 25 50 75 100200 10
5
pERK p4EBP1 OL pERK p4EBP1 OL
ImageJ/Fiji: ROI overlay and quantification of single-staining (% area) Spa-Q: quantification of dual staining OL (% area)
Spa-Q: quantification of dual staining OL (% area)
i ii iii
T1
T2 BinaryDAB
p4EBP1 pERK Software_1:
Software_2:
Figure 1. An introduction to the Spa-RQ software tool package. (a) Schematic overview of Spa-RQ, which includes software for image registration (Spa-R) and spatial quantification (Spa-Q). (b) Examples of image sets that can be registered by Spa-R. (c) Upper image panel illustrates the alignment outcomes following Spa-R implementation with different iteration numbers. The registration quality increases with the iteration number, which can be set by users. The lower bar plot shows how the time required for Spa-R registration increases with image size and iteration number. An iteration rate of 100 is recommended to register images on neighbouring 4 µm tissue sections. (d) Overview of the control panel of Spa-Q. A detailed User Manual can be found in the software folder at the official repository. (e) Examples of outputs generated by Spa-Q. For each ROI, a coloured overlay mask is provided in conjunction with an Excel file listing image quantification data. (f) Overview of various image modalities to which Spa-RQ can be applied.
Ad5-Cre
LKB1
mTOR pS6K p4EBP1
MEK KRAS PI3K
pAMPK pAKT
pERK pp38
RTKs
c d
e f
g
0 100 80 60
20
% Positive area in tumours
Stress signals
p53
pp38
p4EBP1 pAKT pERK
KL-IAC KP-IAC KP-PAC
12 3 76 4 89
1312 1011
1516 1718 14 5
Reference H&E
Target DAB images
H&E pAKT pERK pp38
AC core SCC of ASC
KP-PAC
p4EBP1pERKpp38 p4EBP1
IACASC
KL tumours
H&EpAKT KL or KP mice
12-20 weeks
ASCPAC
SCC of ASC AC of ASC
(mTOR) (AKT) (MAPK) (p38MAPK)
40
KL-ASC KL-PAC
0
Number of tumours Mixed AC
Solid AC ASCMAC PACIAC
KL KP n=9
n=5
40 80 120 160 200 240
a b
ImageJ/Fiji
Figure 2. Implementation of Spa-R to analyse oncogenic signalling activities in murine NSCLC histopathologies. (a) Schematic overview depicting FFPE lung tumour tissue block preparation from KrasG12D; Lkb1fl/fl (KL) or KrasG12D; p53fl/fl (KP) GEMMs. Multiple tumours arise in the lung lobes of an individual GEMM. (b) Diagram illustrating oncogenic signalling pathways regulated by KRAS and LKB1 or p53. Solid arrows indicate direct regulation. (c) Schematic overview showing the order of H&E- and DAB- stained tissues sections for image registration. (d) Diagram showing an example image analysis workflow using Spa-R for registration and ImageJ/Fiji for annotation and quantification. The former is used to align DAB images to H&E images, the latter is used to generate annotations and perform ROI-guided quantification of DAB signal on each of the registered images. Red outlines on DAB images are original overlays from H&E-based annotations; green outlines are adjusted overlays due to the distance between tissue sections stained with different antibodies. (e) Graphical representation of the numbers of NSCLC lesions of different histopathologies in 9 KL and 5 KP GEMMs. In mixed ACs (adenocarcinomas) multiple histological features
specifically in KP tumours (Fig. 2f,g). Implementation of Spa-R as an image pre-processing step is thus shown to achieve ROI-guided staining quantification, and identifies oncogenic signalling phenotypes characteristic for ASC, PAC, and IAC NSCLC histopathology types.
Using Spa-RQ to visualise and quantify the spatial features of phosphoprotein signals in murine nScLc tumours.
Our previous findings linked the extent of spatial co-activation of mTOR and MAPK path- ways to their combinatorial inhibitory response in slice explants15. We hence wished to demonstrate the use of Spa-RQ in measuring the spatial co-activation of signalling pathways to dissect histopathology-selective phe- notypes. Spa-RQ was applied to measure the expression of pERK, pAKT, p4EBP1, and their mutual areas of OL (marking MAPK-mTOR co-activation and AKT-mTOR co-activation respectively) in individual murine ASC lesions (Fig. 3a). Using a cut-off of >15% OL of pERK and p4EBP expression, as was used in15, Spa-RQ analysis showed 2 of 19 ASCs to have a ‘MAPK/mTOR’ signature (ASC_OL; pERK/p4EBP1 > 15%). This is lower than found before (4 out of 9 ASCs in15), indicating that quantification of manually-drawn stained area masks, as was done previously, can overestimate spatial biomarker quantification compared with intensity-based signal segmentation as done here. Additionally, 2 of 19 ASCs were shown to have an ‘AKT/mTOR’ signature (ASC_OL;pAKT/p4EBP1 > 15%). The remaining (15/19) ASCs were classified as having a ‘Null’ signature (Fig. 3b). Lesions never carried both ‘MAPK/mTOR’ and ‘AKT/mTOR’ signatures (Fig. 3b), indicating mutual exclusivity, con- sistent with the low OL of pERK and pAKT expression in ASC tumours (Fig. 3c). ‘MAPK/mTOR’ and ‘Null’
signature tumours co-existed in animals #3 and 6, indicating inter-tumour signature heterogeneity. We similarly analysed the spatial co-activation of the MAPK and mTOR pathways in AKTnegative/MAPKmedium-high papillary adenocarcinoma (PAC) tumours, which showed that PACs either classified as ‘MAPK/mTOR’ (PAC_OL; pERK/
p4EBP1 > 15%) or as ‘Null’ signature tumours, again indicating inter-tumour signalling heterogeneity within this histopathology group (Supplementary Fig. S2b,c). Taken together, quantitative analysis of signalling OL with Spa-RQ revealed that murine NSCLC lesions subclassify based on the levels of spatial MAPK/mTOR or AKT/
mTOR co-activation.
Finally, we applied Spa-RQ to investigate if there was any evidence of signalling pathway co-activation in KP-PACs which showed selectively high p38MAPK activity. Interestingly, high p38 phosphorylation was detected specifically in regions showing concomitant MAPK activation (Fig. 3d,e). Indeed, even the small areas showing pp38 positivity in KL-PACs were in regions showing high MAPK activity, tentatively suggesting dependency on MAPK activation to elicit detectable p38MAPK pathway activation in murine PACs.
Spa-RQ reveals spatial oncogenic phenotypes in clinical nScLc samples.
To investigate to what extent the histopathology-selective spatial signalling phenotypes detected in murine samples were representative of human NSCLC, we used Spa-RQ to analyse a set of clinical samples. We first visually evaluated the positivity of MAPK, AKT, mTOR, and p38MAPK activation in TMA panels of clinical ASCs and PACs (Supplementary Fig. S3a). As reported in15, AKT activation was seen uniquely in clinical ASCs (5/13), but absent in PACs (0/25).However, unlike GEMM tumours, where the % area range of pERK expression was clearly distinguishable between ASCs (pERKlow-medium) and PACs (pERKmedium-high), we did not find such signatures in human samples.
Instead pERKmedium-high ASCs and pERKlow-medium PACs were the most common phenotypes in clinical NSCLCs (Supplementary Fig. S3b). Moreover, pp38 positivity was observed in more clinical ASCs (61%) than in PACs (40%), differentiating from the selectively high pp38 expression in murine KP-PACs (Fig. 2f,g, Supplementary Fig. S3a,b). Therefore, histopathology-selective PI3K/AKT activation, but not MAPK or p38MAPK activation, was conserved between murine and clinical NSCLC tumours.
Noting that pERK, pAKT, p4EBP1, and pp38 were spatially expressed also in clinical NSCLC samples (Supplementary Fig. S3b), we next wished to explore if spatial measurements with Spa-RQ could identify signal- ling co-activation signatures selective for clinical NSCLC subtypes. We therefore applied Spa-RQ to investigate whether the classification of tumours based on MAPK/mTOR (OL; pERK/p4EBP1) or AKT/mTOR (OL; pAKT/
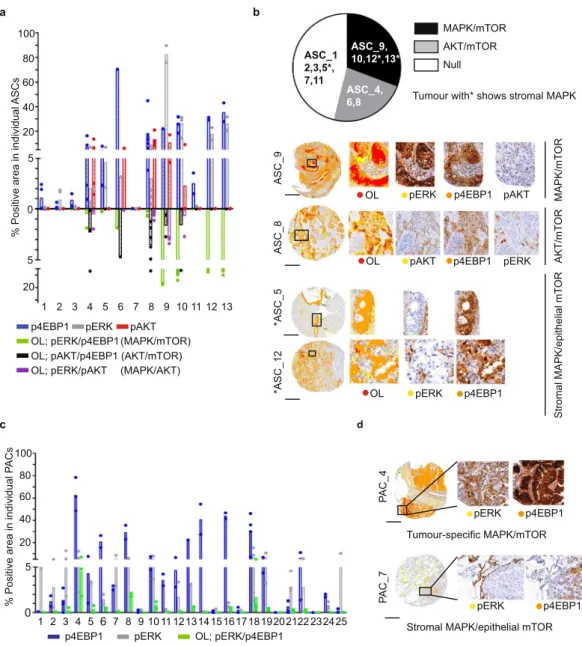
p4EBP1) co-activation signatures translates to human samples. First, the individual levels and OL expression of pERK, p4EBP1, and pAKT were measured on a spot-by-spot manner for each ASC (Fig. 4a). Differently from murine tumour analyses, classifications were made according to the dominant phenotypes, as intra-tumour stro- mal infiltrates and overall decreased areas of staining obviated use of a 15% OL cut-off value. We found that human ASCs similarly stratified into the three subclasses identified by murine tumour phenotyping, namely:
(i) ‘MAPK/mTOR’ signature tumours (ASC_9, 10, 12, 13; 4/13); (ii) ‘AKT/mTOR’ signature tumours (ASC_4, 6, 8; 3/13); and (iii) ‘Null’ signature tumours (ASC_1, 2, 3, 5, 7, 11; 6/13) (Fig. 4b). Variations were measured in the duplicate spots sampled from the same donor blocks, indicating intra-tumour signalling heterogeneity. We similarly performed spatial analysis on TMA sections representing 25 clinical PAC samples (Fig. 4c), and con- firmed that both ‘MAPK/mTOR’ signature (PAC_4,8,18) and ‘Null’ signature tumours were detected in clinical PACs. Importantly, of the samples for which the KRAS mutation status is known, no correlation between KRAS are found in one tumour. (f) Scatterplot showing areas (%) of p4EBP1 (marking mTOR activation), pAKT (marking AKT activation), pERK (marking MAPK activation) and pp38 (marking p38 activation) in individual adenosquamous carcinomas (ASCs), papillary adenocarcinomas (PACs), or invasive adenocarcinomas (IACs).
Statistical analysis: one-way ANOVA multiple comparison (Kruskal-Wallis test, nonparametric test) with uncorrected Dunn’s test. (g) Representative images illustrating ASC, PAC, and IAC histological features (H&E staining), as well as the stainings of p4EBP1, pAKT, pERK, and pp38 in a histopathology-specific manner. Scale bars, 500 µm for KL upper panel (entire) images and KL lower panel H&E image and KP H&E image; 100 µm for the others.
a 100
1 2 3 4 5 6 7 8 9 10 11 12 13 80
60 40 20
AKT/mTOR signature c
% Positive area in individualASCs
p4EBP1 pERK pAKT
OL; pERK/p4EBP1 OL; pAKT/p4EBP1
No. ASC
pp38 pERK
pERK pp38 OL
KL-PAC
KP-PAC OL
pERK pp38
1 2 3 4 5 No.GEMM
OL; pERK/pAKT
e 5
0
5 20
40 14 15 16 17 18 19
6 7 8 9
ASC_15ASC_16
MAPK/mTOR signature
d
ASC_5 Null
signature
0 20 40 60 80 100
% Positive area in individual PACs
1 2 3 4 5 6 7 8 9 10 GEMM
KL-PACs KP-PACs
OL; pp38/pERK
b
MAPK/mTOR signature ASC AKT/mTOR signature ASC Null signature ASC
(p38/MAPK)
OL; pERK/p4EBP1 pAKT OL; pAKT/p4EBP1 p4EBP1
(mTOR) pERK
(MAPK) (MAPK/mTOR) (AKT) (AKT/mTOR)
ASC16,17 ASC7,15
Figure 3. Application of Spa-RQ in phenotyping oncogenic signalling network signatures. (a) Bar plot showing the % area of p4EBP1, pERK, pAKT, as well as pERK/p4EBP1 (marking MAPK and mTOR co-activation), pAKT/p4EBP1 (marking AKT and mTOR co-activation) and pERK/pAKT (marking MAPK and AKT co- activation) overlap in individual ASCs from 9 KL mice. Animals no.1–5 were used in the analysis in Fig. 2e–g.
Animals no. 6–9 are included only in the analysis in Fig. 3. The tumour samples were processed for pAKT, pERK, and p4EBP1 spatial analysis. The staining orders were mentioned in detail in Methods section. The dashed black line indicates a 15% OL level. (b) Pie chart showing the distribution of analysed ASCs in the following three signature subclasses: 1. ‘MAPK/mTOR’ (OL; pERK/p4EBP1 > 15%), 2. ‘AKT/mTOR’ (OL;
pAKT/p4EBP1 > 15%) and 3. ‘Null’ signature. (c) Examples of ASC tumours showing either a ‘MAPK/mTOR’,
‘AKT/mTOR’ or ‘Null’ signature. (d) Bar plot showing the pp38 and pERK quantification as well as OL of pERK/pp38 (marking MAPK and p38 co-activation) by Spa-RQ in individual PACs grouped per animal. (e) Representative landscape images illustrating the spatial distribution of pERK and pp38 in one KL-PAC and one KP-PAC, generated by Spa-RQ.
mutation and spatial signalling signature was detected (Supplementary Fig. S4a,b). The spatial signalling pathway co-activation signatures of murine tumours were also identified in the clinical samples.
Based on the quantitative data as well as the landscape masks provided by Spa-RQ analysis, we observed a phenotype of stromal MAPK signature in conjunction with tumour-specific mTOR signalling, in both ‘MAPK/
mTOR’ (ASC_12, 13) and ‘Null’ (ASC_5) signature ASCs (Fig. 4a,b). Furthermore, a heterotypic tumour-stromal distribution of MAPK and mTOR pathways was also observed in ‘Null’ signature PAC tumours (Fig. 4c,d). This indicates increased signalling heterogeneity in clinical tumours, associated with the heterotypic stromal infiltra- tion characteristic of clinical tumours.
a
p4EBP1 pERK OL; pERK/p4EBP1 1 2 3 4 5 6 7 8 9 10111213
100 80
% Positive area in individualASCs
141516171819202122232425 1 2 3 4 5 6 7 8 9 10 11 12 13
ASC_1 2,3,5*, 7,11
ASC_9, 10,12*,13*
ASC_4, 6,8 b
MAPK/mTOR AKT/mTOR Null
pERK p4EBP1
*ASC_12
60
0
ASC_9ASC_8
pAKT p4EBP1
% Positive area in individual PACs
c d
PAC_4
pERK p4EBP1
pERK p4EBP1
PAC_7
Tumour-specific MAPK/mTOR
Stromal MAPK/epithelial mTOR 40
20 5
20
p4EBP1 pERK pAKT OL; pERK/p4EBP1
OL; pAKT/p4EBP1 (AKT/mTOR) OL; pERK/pAKT
100 80 60
0 40 20 5 5
pERK p4EBP1
*ASC_5
OL pERK AKT/mTOR
pAKT MAPK/mTORStromal MAPK/epithelial mTOR
Tumour with* shows stromal MAPK
OL
OL (MAPK/mTOR)
(MAPK/AKT)
Figure 4. Spa-RQ reveals spatial oncogenic phenotypes in NSCLC TMA samples. (a) Scatterplot depicting the areas (%) of p4EBP1, pERK, pAKT, as well as pERK/p4EBP1, pAKT/p4EBP1 and pERK/pAKT overlap in 13 individual clinical ASCs. Each dot represents a TMA spot. Human NSCLC TMA blocks contains 2–3 replicate cores, representing two spatially distinct tissue regions, and 2–6 TMA spots per ASC tumour were analysed.
Bars indicate the average values among the spots within one ASC. (b) Pie chart illustrating the classification of ASCs according to mTOR/MAPK/AKT spatial phenotypes. Representative images illustrating the classes shown in the pie chart, with exception of the ‘Null’ signature. Tumours labelled with an asterisk* show stromal MAPK and tumour-specific mTOR signalling. On landscape mask, OL areas are marked with red colour, yellow and orange each present tumour area stained with an individual marker. Scale bar, 500 µm. (c) Scatterplot showing the expression of p4EBP1 and pERK, as well as their OL in 25 clinical PAC samples. Each dot represents a TMA spot, and 2–4 spots representing spatially distinct tissue regions per PAC sample were included in the analyses.
Bars indicating the average value of spots for individual PAC. (d) Representative images of PAC TMA samples showing a tumour-specific ‘MAPK/mTOR’ signature or stromal MAPK/epithelial tumour mTOR signature.
Scale bar, 500 µm.
Finally, we also explored the spatial activation of p38MAPK signalling in clinical samples, and asked if p38 phosphorylation was detected in conjunction with high pERK expression, as was the case in murine PACs. Of the eight pp38positive ASCs, four contained a ‘MAPK/mTOR’ signature, and only one of these (ASC_9, pERKh-
igh) showed spatial co-activation of MAPK and p38MAPK signalling. In addition, three pp38positive ASCs con- taining an ‘AKT/mTOR’ signature (ASC_4, 6, 8) showed pp38 staining in pAKT positive areas (Supplementary Fig. S3c). In clinical PACs, the co-activation of MAPK and p38MAPK was observed in only one out of ten pp38positive tumours (PAC_4, ‘MAPK/mTOR’ signature) (Supplementary Fig. S3d). Thus, the spatial p38MAPK and MAPK co-activation phenotype of clinical samples was more heterogeneous than in murine samples. In conclusion, implementation of Spa-RQ can classify both murine and clinical NSCLCs based on distinct signal- ling co-activation signatures, and reveals that histopathology-selective PI3K/AKT activity in ASC tumours is conserved between species. However, the more pronounced molecular and heterotypic stromal heterogeneity of human NSCLCs adds complexity to straightforward phenotype-based disease stratification.
Discussion
We introduce a software package named Spa-RQ to visualise and quantify the spatial features of markers detected by standard IHC on serial tissue sections. This package is easy to operate and visualises the spatial data as an attractive landscape. Spa-RQ consists of the Spa-R program for image registration and the Spa-Q program for spatial image analysis in multiple ROIs on IHC images. Image registration is a much anticipated method develop- ment field, and sophisticated algorithms are required for lower resolution medical images or for motion correc- tion22,23. However, the histological images in our study are applied to serial sections of tissues with near-identical architecture, and stained with standardised protocols. A similarity transformation with mutual information registration method therefore have satisfied all our tests and is used in Spa-R. This image pre-processing step enables spatial analysis, e.g. using Spa-Q or ImageJ/Fiji, at the tissue level. Both of these apply simple signal intensity-based quantification methods, necessitating an inter-observer study to set thresholds. Implementation of Spa-RQ for the phenotypic profiling on any set of DAB-stained slides can help discover native tissue pheno- types, and generate hypotheses for further investigation. Spa-RQ is open-source software and can be further modified based on the user’s needs, for example: to quantify spatial co-expression of more than two markers; or to add segmentation modules for spatial analysis at single-cell resolution.
As proof-of-concept demonstrations of Spa-RQ, we first combined use of Spa-R and ImageJ/Fiji to analyse the signalling activities in NSCLC lesions of different histopathologies. This corroborated our previous iden- tification15 of histopathology-selective signalling signatures, reflecting the diverse roles of signalling networks in oncogenic transformation. Specifically, we found that Kras mutant murine ASCs, PACs, and IACs were clas- sified as AKTpositive/MAPKlow-medium, AKTnegative/MAPKmedium-high, and AKTnegative/MAPKlow-medium, respectively, and that the PAC and IAC signatures were independent of the KL and KP driver mutations. Similar to the murine sample data, clinical PACs also showed absence of AKT signalling, suggesting that signalling mecha- nisms driving histopathology-selective lesion progression may in part be conserved across species. Functional studies with lung cancer cell lines have similarly demonstrated that MAPK versus PI3K/mTOR dependency can stratify KRAS-driven cancers24, and an interesting outstanding question remains how this may relate to histopathology-selective pathway dependencies.
In the second proof-of-concept application, we applied Spa-RQ as a spatial analysis tool to demonstrate how oncogenic signalling pathway co-activation can be examined in individual tumours. The MAPK and PI3K/AKT pathways have multiple downstream effectors, including mTOR pathway activation, which have major roles in tumourigenesis, disease prognosis, and therapeutic response25,26. ASC tumours showed heterogeneity in MAPK, AKT, and mTOR pathway activities, and were stratified into three mutually exclusive subclasses, namely ‘MAPK/
mTOR’, ‘AKT/mTOR’, and ‘Null’. Minimal co-activation of the MAPK and AKT pathways was observed, which is consistent with the known negative feedback regulation of MAPK activity by AKT27. Similarly, NSCLC PACs were divided into ‘MAPK/mTOR’ and ‘Null’ tumours. Importantly, the same tumour subclasses were observed in human samples, indicating cross-species conservation. In some clinical samples, clear stromal MAPK activity could be detected, in accordance with the increased stromal component in human disease compared to murine tumours. The detection of signalling heterogeneity in tumours carrying identical driver mutations matches a previous report demonstrating PI3K/MAPK heterogeneity in PIK3CA mutant breast cancer, a rare example of a study applying multiplexed techniques to investigate phosphoprotein networks28. An interesting question for future mechanistic exploration is whether such spatial phenotyping of in situ signalling heterogeneities can fur- ther refine the predictive stratification of tumours linked to drug response.
Contrary to the histopathology-selective MAPK and AKT activation patterns, p38MAPK activation was found to be associated with p53 loss-of-function in murine NSCLC. This is potentially explained by increased ATM/ATR-mediated phosphorylation of p38 in p53 null cells, known to promote cell survival following DNA damage29. Corroborating this, a more recent study showed that activation of p38MAPK has an active role in DNA repair by phosphorylation of CtIP25, together suggesting that the increased p38MAPK signalling relates to compromised DNA integrity of p53 null tumours. Interestingly, we found that p38 phosphorylation was particu- larly pronounced in murine tumour regions with high MAPK activity, implying context-dependent co-activation of p38MAPK and MAPK pathways following DNA damage or other stress mechanisms. However, in clinical samples, p38MAPK activation was not clearly associated with increased MAPK activity, consistent with a more intricate molecular evolutionary diversity of clinical samples, compromising simple correlations.
To conclude, Spa-RQ is a simple and robust image analysis tool that, when combined with a serial section staining strategy, facilitates the identification of spatial tissue phenotypes. Application of the software in the anal- ysis of oncogenic signalling can help to dissect inter- and intra-tumour phenotypic heterogeneity. Once linked to drug response studies, such spatial phenotyping approaches may have the potential to expose biomarkers of drug sensitivity.
Methods
Human and murine tumour tissues.
Breeding of KL and KP mice, and lung tumour initiation, were performed as described21. Animal handling and studies were performed according to the guidelines from Finnish National Board of Animal Experimentation, and they were approved by the Experimental Animal Committee of the University of Helsinki and the State Provincial Office of Southern Finland (ESAVI/857/04.10.07/2013).Formalin fixed paraffin embedded (FFPE) samples of human NSCLC ASC and PAC lesions were collected from the Helsinki Biobank’s pathology sample archive (Helsinki Biobank project number HBP2016002). A TMA was constructed from the FFPE samples. Surgically resected tumour specimens were received from NSCLC patients, with informed consent, at the Hospital District of Helsinki and Uusimaa (HUS), as approved by the ethical board of the Joint Authority for the HUS, Finland (Dnro: 85/13/03/00/15). Experimental procedures on human tumour tissues were performed in accordance with the guidelines and regulations in the acquired ethical permission.
Detailed information and raw data from the murine and human NSCLC sample analyses is provided in the Supplementary Table S1.
tissue processing, sectioning and staining order.
Murine lung tumours were processed as described15. FFPE tissue blocks containing whole murine lung or clinical NSCLC TMA samples were cut as 4 µm thick sec- tions. Two sequential sections were placed on one glass slide (SUPERFROST®
PLUS, Thermo scientific, Ref J1800AMNZ), and labelled to mark the sectioning order. Adjacent tissue sections were each stained with one antibody from a defined series of sequential antibodies. For murine samples in Figs. 2e,g and 3a GEMM No. 1–5, stainings and tissue sections were as follows: 1-p63, 2-NKX2.1, 5-HE, 6-p4EBP1, 9-pAKT, 10-pERK, 11-pp38 and 14-HE. Thus, p4EBP1- and pAKT-stained sections were 12 µm apart, and p4EBP1- and pERK-stained sec- tions were 16 µm apart; H&E-stained sections were 4–16 µm apart from various DAB-stained sections; pAKT-, pERK-, and pp38-stained sections were consecutive. For the additional GEMM tumour samples included in Fig. 3a GEMM No.6–9, pAKT, p4EBP1 and pERK were stained on consecutive tissue sections. For the TMA analyses, the staining order was: 1-pERK, 2-pp38, 3-pAKT and 4-p4EBP1.immunohistochemistry (iHc) and image acquisition.
Standard IHC was performed as described15. To achieve consistency in hematoxylin and DAB signals, IHC was simultaneously performed on all samples in the following groups: 1. murine samples used in Figs. 2 and 3 (No. 1–5 in Fig. 3a); 2. samples from animals 6–9;3. TMA panels of clinical samples.
The following antibodies were used for IHC: rabbit anti-TTF1 (NKX2.1) (Abcam 133638; 1:2000), rabbit anti-p63 (Abcam ab124762; 1:10000), rabbit anti-E-cadherin (Cell Signalling Technology CST 3195; 1:400), rabbit anti-phospho-AKT for murine samples (Cell Signalling Technology CST4058; 1:400), rabbit anti-phospho-AKT for clinical samples (Cell Signalling Technology CST4060; 1:300), rabbit anti-p44/22 (Erk1/2) (Cell Signalling Technology CST4370; 1:1000 for murine samples; 1:500 for TMA samples), rabbit anti-p4EBP1 (CST2855, Cell Signalling Technology; 1:1000), rabbit anti-pp38 (Cell Signalling Technology CST4511; 1:200). For all the antibodies, antigen retrieval was done using 10 mM sodium citrate pH 6.0. All antibodies except p4EBP1 were incubated 1.5 h at room temperature; p4EBP1 antibody was incubated overnight at 4 °C. BrightVision poly-horseradish peroxidase goat anti-rabbit IgG (Immunologic, Duiven, The Netherlands) was incubated at room temperature for half an hour and Bright-DAB Substrate Kit (Immunologic, Duiven, The Netherlands) were used for detection.
Stained murine lung sections were scanned with a Cytation
™
5 Cell Imaging Multi-Mode Reader using a 10x objective, and stored as TIFF images. Whole slide scans of stained clinical TMA sections were acquired by a Pannoramic 250 3DHISTECH digital slide scanner using a 20x objective. TIFF images of individual TMA spots were exported using the Pannoramic Viewer (3DHISTECH Ltd) at a magnification of 1:2. Histopathology classi- fication was performed as done previously15,21, in conjunction with an expert pathologist.Software development.
Spa-RQ was written in MATLAB®
(The MathWorks, Inc. USA). It is freely distrib- uted at https://bitbucket.org/MagoBitbucket/spa-rq-tools as an open-source tool, where users can read the gen- eral description and license; they can also go to ‘Source’ to view or use the source code, or ‘Downloads’ to access Mac or PC versions of Spa-RQ, where a User Manual is included. For the registration algorithm, the MATLAB®
function imregtform was used (https://se.mathworks.com/help/images/ref/imregtform.html). Spa-R iteratively applies a similarity transformation method for image registration. This uses a multimodal image input to com- pute an initialization for the registration metric as well as an optimizer configuration. This metric is defined by the maximization of the mutual information between the reference image and the image(s) to be aligned. The optimisation runs to a maximum number of iterations, or until it converges. While default parameters are used in Spa-R (e.g. InitialRadius = 0.0018, PyramidLevels = 3, Epsilon = 1.5e-06, and GrowthFactor = 1.05), we created Spa-R_optimizer to allows users to manually adjust all five parameters (https://bitbucket.org/MagoBitbucket/
spa-rq-tools). Spa-Q performs colour decomposition with two vectors, one for Hematoxylin staining and the other for DAB. Colour decomposition matrix [0.650 0.704 0.286] is used for Hematoxylin, and [0.072 0.954 0.283] for DAB. This matrix was obtained via colour deconvolution analysis using the ImageJ/Fiji plugin30. ROI-specific image analysis with ImageJ/Fiji. ImageJ/Fiji (https://fiji.sc) was used to generate annota- tions: First, regions-of-interest (ROIs), in this case individual lesions on murine lung lobes, were each outlined manually with the polygon tool on H&E images. Secondly, polygons were added to the ROI manager (ImageJ/
Fiji- > Analyse- > Tools > ROI manager), and named according to their histopathology classification. Third, the ROI manager for each sample was saved as a Zip file in the sample image folder. Finally, to apply the ROI library on DAB images in the image set of one tissue block, both the registered images and the ROI manager were opened
in ImageJ/Fiji, and ROIs overlaid on images by selecting the “show all” function in the ROI manager. If necessary, polygons were adjusted on new images, and adjusted ROI managers saved.
For image analyses using ImageJ/Fiji, the ROI managers were first applied to each image, followed by colour deconvolution to obtain pure DAB masks (ImageJ/Fiji- > Color- > Color Deconvolution- > Vector: H DAB). The threshold for each staining was set as the average threshold values of analyses performed by three independent immunohistochemical experts, on multiple ROIs. Identical thresholds for each individual staining were applied to all samples (Supplementary Table S1). Identical thresholds for each individual staining were applied to all sam- ples (Supplementary Table S1). To measure the tissue area, the original images were converted to 8-bit grayscale images (ImageJ/Fiji- > Image- > 8-bit), and binary thresholds were then applied. The % positivity of each staining in each tumour (regions-of-interest) were quantified as percentages of DAB-stained areas relative to the whole tumour area. All raw results and parameters were collected in Excel sheets and can be found in Supplementary Table S1.
Spatial quantification with Spa-RQ. A step-by-step installation and user manual for Spa-RQ is included in the Spa-RQ-Windows-v1.0.zip and Spa-RQ-MACOS-v1.0.zip (https://bitbucket.org/MagoBitbucket/
spa-rq-tools/downloads). The threshold for each staining was set as the average threshold values of analyses performed by three independent experts on multiple ROIs. For the analysis of murine samples, thresholding parameters were set manually to match those used in ImageJ/Fiji (Supplementary Table S1). Spa-RQ generates an Excel sheet that provides DAB and binary thresholds, and raw results data. A landscape of staining overlap, and the segmented images, are automatically saved in the output folder.
Statistical analysis.
Data visualisation and statistical analyses were performed with GraphPad Prism7 (GraphPad Software, Inc. San Diego, USA). For statistical comparisons, a one-way ANOVA multiple comparison (Kruskal-Wallis test, nonparametric test) with uncorrected Dunn’s test was used. P values < 0.05 were considered significant. Data are presented as individual dots with the mean indicated by bars, or as mean ± SD.Data availability
The datasets analysed during the current study are available as Supplementary Table S1.
Spa-RQ-V1.0 is freely distributed at https://bitbucket.org/MagoBitbucket/spa-rq-tools as an open-source tool. It is written in MATLAB
®
R2016a with an academic license. The source code, standalone versions, User Manual, and additional notes are available at the official repository. Further developing the source code requires MATLAB®
license. However, Windows and Macintosh standalone compiled versions— that do not require license— are also available online.Received: 20 February 2019; Accepted: 6 November 2019;
Published: xx xx xxxx
References
1. Stylianopoulos, T., Munn, L. L. & Jain, R. K. Reengineering the Physical Microenvironment of Tumors to Improve Drug Delivery and Efficacy: From Mathematical Modeling to Bench to Bedside. Trends Cancer 4, 292–319, https://doi.org/10.1016/j.
trecan.2018.02.005 (2018).
2. Butcher, D. T., Alliston, T. & Weaver, V. M. A tense situation: forcing tumour progression. Nat Rev Cancer 9, 108–122, https://doi.
org/10.1038/nrc2544 (2009).
3. Dagogo-Jack, I. & Shaw, A. T. Tumour heterogeneity and resistance to cancer therapies. Nat Rev Clin Oncol 15, 81–94, https://doi.
org/10.1038/nrclinonc.2017.166 (2018).
4. McGranahan, N. & Swanton, C. Clonal Heterogeneity and Tumor Evolution: Past, Present, and the Future. Cell 168, 613–628, https://doi.org/10.1016/j.cell.2017.01.018 (2017).
5. Junttila, M. R. & de Sauvage, F. J. Influence of tumour micro-environment heterogeneity on therapeutic response. Nature 501, 346–354, https://doi.org/10.1038/nature12626 (2013).
6. Spagnolo, D. M. et al. Platform for Quantitative Evaluation of Spatial Intratumoral Heterogeneity in Multiplexed Fluorescence Images. Cancer Res 77, e71–e74, https://doi.org/10.1158/0008-5472.CAN-17-0676 (2017).
7. Tsujikawa, T. et al. Quantitative Multiplex Immunohistochemistry Reveals Myeloid-Inflamed Tumor-Immune Complexity Associated with Poor Prognosis. Cell Rep 19, 203–217, https://doi.org/10.1016/j.celrep.2017.03.037 (2017).
8. Blom, S. et al. Systems pathology by multiplexed immunohistochemistry and whole-slide digital image analysis. Sci Rep 7, 15580, https://doi.org/10.1038/s41598-017-15798-4 (2017).
9. Jamal-Hanjani, M. et al. Tracking the Evolution of Non-Small-Cell Lung Cancer. N Engl J Med 376, 2109–2121, https://doi.
org/10.1056/NEJMoa1616288 (2017).
10. Negrao, M. V., Quek, K., Zhang, J. & Sepesi, B. TRACERx: Tracking tumor evolution to impact the course of lung cancer. J Thorac Cardiovasc Surg 155, 1199–1202, https://doi.org/10.1016/j.jtcvs.2017.10.134 (2018).
11. Chan, B. A. & Hughes, B. G. Targeted therapy for non-small cell lung cancer: current standards and the promise of the future. Transl Lung Cancer Res 4, 36–54, https://doi.org/10.3978/j.issn.2218-6751.2014.05.01 (2015).
12. Sanchez-Vega, F. et al. Oncogenic Signaling Pathways in The Cancer Genome Atlas. Cell 173, 321–337 e310, https://doi.
org/10.1016/j.cell.2018.03.035 (2018).
13. Grimes, M. et al. Integration of protein phosphorylation, acetylation, and methylation data sets to outline lung cancer signaling networks. Sci Signal 11, https://doi.org/10.1126/scisignal.aaq1087 (2018).
14. Herbst, R. S., Morgensztern, D. & Boshoff, C. The biology and management of non-small cell lung cancer. Nature 553, 446–454, https://doi.org/10.1038/nature25183 (2018).
15. Narhi, K. et al. Spatial aspects of oncogenic signalling determine the response to combination therapy in slice explants from Kras- driven lung tumours. J Pathol, https://doi.org/10.1002/path.5059 (2018).
16. Trahearn, N., Epstein, D., Cree, I. & Snead, D. & Rajpoot, N. Hyper-Stain Inspector: A Framework for Robust Registration and Localised Co-Expression Analysis of Multiple Whole-Slide Images of Serial Histology Sections. Sci Rep 7, 5641, https://doi.
org/10.1038/s41598-017-05511-w (2017).
17. Kartasalo, K. et al. Comparative analysis of tissue reconstruction algorithms for 3D histology. Bioinformatics 34, 3013–3021, https://
doi.org/10.1093/bioinformatics/bty210 (2018).
18. Trahearn, N. et al. Simultaneous automatic scoring and co-registration of hormone receptors in tumor areas in whole slide images of breast cancer tissue slides. Cytometry A 91, 585–594, https://doi.org/10.1002/cyto.a.23035 (2017).
19. Schindelin, J. et al. Fiji: an open-source platform for biological-image analysis. Nat Methods 9, 676–682, https://doi.org/10.1038/
nmeth.2019 (2012).
20. Sutherland, K. D. et al. Multiple cells-of-origin of mutant K-Ras-induced mouse lung adenocarcinoma. Proc Natl Acad Sci USA 111, 4952–4957, https://doi.org/10.1073/pnas.1319963111 (2014).
21. Nagaraj, A. S. et al. Cell of Origin Links Histotype Spectrum to Immune Microenvironment Diversity in Non-small-Cell Lung Cancer Driven by Mutant Kras and Loss of Lkb1. Cell Rep 18, 673–684, https://doi.org/10.1016/j.celrep.2016.12.059 (2017).
22. Liu, J., Tian, J. & Dai, Y. Multi-modal medical image registration based on adaptive combination of intensity and gradient field mutual information. Conf Proc IEEE Eng Med Biol Soc 1, 1429–1432, https://doi.org/10.1109/IEMBS.2006.260489 (2006).
23. Xu, C. et al. Direct delineation of myocardial infarction without contrast agents using a joint motion feature learning architecture.
Med Image Anal 50, 82–94, https://doi.org/10.1016/j.media.2018.09.001 (2018).
24. Yuan, T. L. et al. Differential Effector Engagement by Oncogenic KRAS. Cell Rep 22, 1889–1902, https://doi.org/10.1016/j.
celrep.2018.01.051 (2018).
25. Shaw, R. J., Cantley, L. C. & Ras, P. I. (3)K and mTOR signalling controls tumour cell growth. Nature 441, 424–430, https://doi.
org/10.1038/nature04869 (2006).
26. Fruman, D. A. & Rommel, C. PI3K and cancer: lessons, challenges and opportunities. Nat Rev Drug Discov 13, 140–156, https://doi.
org/10.1038/nrd4204 (2014).
27. Carracedo, A. & Pandolfi, P. P. The PTEN-PI3K pathway: of feedbacks and cross-talks. Oncogene 27, 5527–5541, https://doi.
org/10.1038/onc.2008.247 (2008).
28. Jacob, T., Gray, J. W., Troxell, M. & Vu, T. Q. Multiplexed imaging reveals heterogeneity of PI3K/MAPK network signaling in breast lesions of known PIK3CA genotype. Breast Cancer Res Treat 159, 575–583, https://doi.org/10.1007/s10549-016-3962-1 (2016).
29. Reinhardt, H. C., Aslanian, A. S., Lees, J. A. & Yaffe, M. B. p53-deficient cells rely on ATM- and ATR-mediated checkpoint signaling through the p38MAPK/MK2 pathway for survival after DNA damage. Cancer Cell 11, 175–189, https://doi.org/10.1016/j.
ccr.2006.11.024 (2007).
30. Ruifrok, A. C. & Johnston, D. A. Quantification of histochemical staining by color deconvolution. Anal Quant Cytol Histol 23, 291–299 (2001).
Acknowledgements
We thank the Laboratory Animal Centre for husbandry support, and Kaisa Salmenkivi and Mikko Mäyranpää for pathology consultation. We thank the Digital and Molecular Pathology Unit supported by Helsinki University and Biocenter Finland. The samples/data used for the research were obtained from the Helsinki Biobank. We thank all study participants for their generous participation in Helsinki Biobank. Research was supported by the University of Helsinki Doctoral Programme in Biomedicine (J.B.); Innovative Medicines Initiative Joint Undertaking Grant Agreement No. 115188, the resources of which are composed of a financial contribution from the European Union’s Seventh Framework Programme (FP7/2007-2013) and EFPIA companies’ in-kind contribution (M.W., J.L., and E.W.V.); the LENDULET-BIOMAG Grant (2018-342) and the European Regional Development Funds (GINOP-2.3.2-15-2016-00006, GINOP-2.3.2-15-2016-00026, GINOP-2.3.2-15-2016-00037) (P.H.); and the Academy of Finland grant 307111 (E.W.V.).
Author contributions
E.W.V. and J.B. conceived of the study and its experimental design. J.B. performed the experiments and image analyses. M.W. designed and created the Spa-RQ tool package. F.K. worked with M.W. as a technical consultant for Spa-RQ software release. F.K. and J.B. wrote the Spa-RQ user manual. A.S.N. provided murine tumour blocks and advised on the experiments. A.H. performed slide scanning and provided IHC support. V.S. performed KRAS mutation analysis on clinical samples. S.K. supervised KRAS mutation analysis. J.B. and E.W.V. conducted data interpretation and wrote the manuscript. J.L., P.H. and E.W.V. supervised the study.
competing interests
The authors declare no competing interests.
Additional information
Supplementary information is available for this paper at https://doi.org/10.1038/s41598-019-54038-9.
Correspondence and requests for materials should be addressed to E.W.V.
Reprints and permissions information is available at www.nature.com/reprints.
Publisher’s note Springer Nature remains neutral with regard to jurisdictional claims in published maps and institutional affiliations.
Open Access This article is licensed under a Creative Commons Attribution 4.0 International License, which permits use, sharing, adaptation, distribution and reproduction in any medium or format, as long as you give appropriate credit to the original author(s) and the source, provide a link to the Cre- ative Commons license, and indicate if changes were made. The images or other third party material in this article are included in the article’s Creative Commons license, unless indicated otherwise in a credit line to the material. If material is not included in the article’s Creative Commons license and your intended use is not per- mitted by statutory regulation or exceeds the permitted use, you will need to obtain permission directly from the copyright holder. To view a copy of this license, visit http://creativecommons.org/licenses/by/4.0/.
© The Author(s) 2019