István Tózsa – Anita Zátori (eds.)
Department of Economic Geography and Futures Studies, Corvinus University of Budapest
1
Metropolitan Tourism Experience Development
Selected studies
from the
Tourism Network Workshop
of the
Regional Studies Association,
held in Budapest, Hungary, 2015
Edited by István Tózsa and Anita Zátori Read by Catherine R. Feuerverger
Cover by László Jeney ISBN: 978-963-503-597-7
Published by
the Department of Economic Geography and Futures Study
2015
2
3
Introduction
On January 28-30, 2015 Corvinus University of Budapest hosted the latest workshop of the Regional Studies Association’s Tourism Research Network.
The event had been held previously in Izmir, Aalborg, Warsaw, Östersund, Antalya, Leeds and Vila-seca Catalonia.
The aim of the RSA research network is to examine tourism diversity from the perspective of regional development in order to identify current challenges and opportunities in a systematic manner, and hence provide the basis for a more well-informed integration of tourism in regional development strategies and move beyond political short-termism and buzzword fascination. In the frame of the network a series of workshops have been organised from various topics of destination management till rural tourism.
In the age of budget airlines and increased mobility, the importance for metropolitan areas of positioning themselves in an increasingly competitive environment where the boundaries between international tourism and local leisure are becoming blurred, has increased. Metropolitan areas are highly preferred targets for tourists owing to their diversified and concentrated attractions particularly cultural heritages and up-to-date events as well as to their business environment. They are the focal points of tourism in a lot of regions and countries. Beside the questions of local management and sustainability, the regional implications (not only for the neighbouring regions) are of crucial importance from the aspect of development opportunities and strategies.
Another aspect of metropolitan tourism is connected to the local population, and the great variety of institutions and businesses linked to tourism system. The Budapest workshop aimed to discuss and exchange ideas, experiences, and research results about metropolitan tourism development and management. The core areas and their regions, as well as the relations and connections with regions outside of metropolitan areas as objects for destination development and management, were relevant for the workshop.
Ádám Ruszinkó, the deputy state secretary responsible for Hungarian tourism honoured the workshop to give an opening welcome speech. The keynote speeches explored various topics of metropolitan tourism, including network- based planning of sustainable metropolitan tourism by Bálint Kádár, regional development and policy issues of metropolitan tourism by Attila Korompai, and ethnic tourism and product development in metropolitan frames by Melanie Kay Smith. Thirty paper presentations covering different aspects of tourism and regional development enriched the two and a half day long programme. The paper presentations’ subjects covered a wide range of topics, from the philosophy of metropolitan culture through mega sport events to the newest trends of metropolitan tourism, such as sharing economy. The workshop was
4
structured in nine chaired sessions. Session ‘Emerging consumer trends of urban tourism’ discussed topics such as responsible tourism product development in Italy by Melissa Moralli and Chiara Rabbiosi, shared, co-created and customized services’ effect on tourist experience by Anita Zátori, and staged authenticity of a touristic space by Andrea Hubner.
Another session entitled ‘Tourism development in metropolitan areas’ included presentations about tourism product development and marketing of Sofia from business perception by Vasil Marinov, Elka Dogramadjieva, Mariana Assenova, Elena Petkova and Baiko Baikov, designing a transregional destination in Hungary - the Danube Limes in Hungary: a concept to integrate metropolitan, urban and rural areas by Tamás Balogh and Árpád Karsai, and metropolitan wellbeing and technology – opportunities in the Balkan region by Attila Horváth.
‘The impact of tourism in urban spaces’ session discussed topics such as urban culture by Matti Itkonen, urban resilience and tourism development in East Germany by Younkyoung Sung, touristification and the tourist trap: case study of Prague by Veronika Dumbrovská.
‘Festivals and gastronomy’ are important elements of urban and metropolitan tourism. In the session food markets: cases of Barcelona and Madrid by Montserrat Crespi Vallbona and Marta Domínguez Pérez, the case of Arguvan Türkü Festival by Gülşah Akkuş and Ülkü Akkuş, and urban gastronomic festivals as success factors by Darko Dimitrovski were analysed.
The second day workshop started with NGO and business case studies by Hungarian Tourism Ltd., while László Puczkó spoke about re-launching of the Liget project (the current museum mega project of Budapest).
The session ‘Destination image, branding and shared economy’ consisted of paper presentations of social media and of image creation for destinations, the case of Barcelona by Lluís Garay Tamajón and Gemma Cànoves Valiente, the role of the share economy for the future of metropolitan tourism by Natalie Stors and Andreas Kagermeier, and re-branding of the countryside Lenita Nieminen and Arja Lemmetyinen.
Another session put only Budapest into focus. Potentials of landscape based metropolitan tourism were analysed by Ágnes Sallay, Zs. Mikházi, S. Jombach, K. Filepné Kovács and I. Valánszki, the image of Budapest as the best river cruise port city by Melinda Jászberényi and Katalin Ásványi, and spa and hotel on the periphery of a metropolis: a case study of Aquaworld Resort Budapest by Attila Csaba Kondor, Tünde Szabó and Szabolcs Juhász.
The session ‘Sport and leisure tourism development in metropolitan areas’
looked at sport mega events in metropolitan areas by Marek W. Kozak, new
5
aboriginal partners in resort development: whistler and Winter Olympic Games legacies by Alison M. Gill, and tourism leisure shopping the case of the Rimini area by Chiara Rabbiosi.
The ‘Regional economy, development and wellbeing’ session focused on the differences in wellbeing attitudes between the residents of urban and rural regions in Balkan countries by Kornélia Kiss, Ivett Sziva, Melanie K. Smith, László Puczkó and Gábor Michalkó., development of regional economy by Ari Karppinen, Mervi Luonila and Arja Lemmetyinen, and the role of regional policy in the development of spas in Észak-Alföld region by Ferenc Mező and Zoltán Dorogi.
The topic of ‘Safety and technological development in tourism’ included safety audit process of tourism in European local authorities – EFUS project by Janez Mekinc, Rob Mawby and Mark Burton-Page, the impacts of the technological environment on the travel habits of Hungarian travellers by Judit Grotte, and regional distribution of Hungarian tourism by István Tózsa.
Lastly, the ‘Role of perception and interpretation in tourism’ session contained the place of modern interpretation in heritage attractions, through the case study of virtual museum of Herculaneum by Dorottya Bodnár, tourists’ perception of the metropolitan Cluj-Napoca, Romania by Lujza T. Cozma, and creative side of Budapest tourism offers by Csilla Petykó and Adrienn Nagy
The two and a half days long event ended at Friday noon with a brainstorming session, in frames of what three emerging workshop topics were discusses, led by Melanie K. Smith, Daniela Carl and Bálint Kádár. The aim of the evening programs e.g. river cruise sightseeing tour, gala dinner, besides recreation, was to form and strengthen the professional and social relations among the research network’s old and new members. Altogether almost fifty tourism experts, academics and practitioners attended the workshop. The Budapest event hosted attendants coming from 13 countries from Turkey to Canada. The following workshop of the RSA Tourism Network is due on 10-12th February, 2016 in Rimini, Italy, with a focus on heritage sites ‘Beyond the Great Beauty:
Rescaling Heritage and Tourism.’
the Editors
6
7
Contents
Introduction 003
Spatial structures and planning
Kádár B.: A network-based spatial planning method
for sustainable urban tourism 009
Tózsa I.: Regional Structure of Hungarian Tourism 032
Tourism development of metropolitan areas
Younkyoung, S.: Urban resilience and tourism development
in Eastern Germany 040
Marinov, V. et al.: Tourism product development and marketing
of Sofia metropolitan area: business perceptions and priorities 051 Kondor A. et al.: Specific features of the tourism in the urban
rural fringe; A case study of Aquaworld Resort Budapest 068
Emerging service types in metropolitan experience development Zátori A.: Shared, co-created, customized services and
their effect on tourist experience 079
Stors, N. – Kagermeier, A.: Share Economy in Metropolitan
Tourism. The role of authenticity-seeking 090
Petykó et al.: Elements of creative tourism supply in Budapest 104
Areas of metropolitan experience development
Kozak, M. W.: Sport mega events in metropolitan areas. Curse or bless-
ing for tourism development? Example of EURO 2012 in Poland 114 Crespi, M. – Pérez, M.: Food markets: new tourism icons.
Illustrative cases of Barcelona and Madrid 127
Destination image and tourist behavior of metropolitan areas Jászberényi M. – Ásványi K.: The Image of Budapest as
the Best River Cruise Port City 140
Cozma, L. T.: Tourists’ Perception of the Metropolitan
Cluj-Napoca, Romania 149
The role of interpretation in metropolitan experience development Hübner A.: Mapping and reading the city through literature;
the role of cult fictions in the interpretation of the city 165 Bodnár D.: Place of modern devices in museums, through the case
study of the Virtual Archaeological Museum of Herculaneum 178 Moralli, M.: Metropolitan development and responsible
tourism – the case of Italian Mygrantour 188
8 Urban culture and wellbeing
Itkonen, M.: The philosophical essence of urban culture 201 Akkuş, G. – Akkuş, Ü.: A SWOT analysis of Arguvan Türkü Festival 209 Kiss K. et al.: The differences in wellbeing attitudes between the
residents of urban and rural regions in Balkan countries 220
The role of ICT in tourism
Horváth A.: Wellbeing and Technology in the Balkan 237 Grotte J.: The impacts of the technological environment on the travel
habits of Hungarian travelers – the ‘Global Village’ 255
9
A network-based spatial planning method for sustainable urban tourism
Bálint, Kádár
assistant lecturer
BME Department of Urban Planning and Design kadarb@urb.bme.hu
Tourists and locals moving in the city's public spaces are hard to distinguish, while the understanding and management of tourist space usage is essential to prevent problems such as congestion and functional touristification. New methods are proposed to measure tourist space usage, and to create a comparable urban model for pedestrian tourist movements, helpful in the planning of a sustainable tourist system in tourist-historic cities. The analysis of tourist space usage measured with the quantification of geo-tagged photography made the distribution of tourists in urban space comparable for Vienna, Prague and Budapest, while space syntax network calculations on their abstracted models of tourist space system highlighted two major development types. Vienna’s balanced development both in terms of urban planning and of tourism management resulted in a semi-lattice network where tourists are distributed ideally, mixing with local functions. Prague’s structure is more close to a tree- like graph, resulting in problems of congestion and segregation. Budapest is a hybrid system, where Pest developed enormously in the last decade into a semi-lattice sub-system, proving how planning and urban design can have a large effect on tourist systems.
Introduction
Sustainable tourism in multifunctional tourist-historic cities
Tourists and locals mostly move undistinguishably in urban centres, having different motivations to be there, but all consuming the spaces, services and experiences a city has to offer. In a tourist-historic city (Ashworth &
Turnbridge, 1990) the majority of attractions are monuments scattered in a historical urban layouts having an evolved and protected morphology, used also by the local community with their own infrastructures, businesses and cultural functions. The economic benefits of visitors spending their discretional incomes at a destination are evident, but tourism can also have severe costs. European cities struggle to make their tourist offer attractive by improving the pedestrian access in the centres, by developing the retail offers and services and by refurbishing streets and historical buildings. But such interventions sometimes unintentionally lead to a process described as 'Museumification' or 'Disneyfication' (McNeill, 1999), when local urban life becomes crowded out by tourism (Maggi & Fredella, 2010; Popp, 2012; van der Borg, Costa, & Gotti, 1996). Such processes are unsustainable not only for the local society, but also for the overall tourism industry of the city. As more and more visitors come to
10
see the main attractions, those longer staying tourists who seek for the unique urban character and services of a city will also be crowded out, lowering the quality of the destination and the economic benefits in a vicious circle (Russo, 2002).
Such processes and their negative effects were described by scholars, both analysing the effects on locals' (Gilbert & Clark, 1997; Deichmann, 2002) and on visitors' (Riganti & Nijkamp, 2008; Simpson, 1999) attitudes. Some researchers tried to define a “tourist carrying capacity’ (TCC), calculating the limits of the resources in different destinations (Canestrelli & Costa, 1991;
O’Reilly, 1986). The TCC model is widely used (Coccossis, Mexa, Collovini, Parpairis, & Konstandoglou, 2001; Jurado et al., 2012; Maggi & Fredella, 2010;
Saenz-de-Miera & Rosselló, 2012), refined and combined with other methods, like the “tourism area life cycle’ model (Butler, 2011; Singh, 2011). Still, no works attempted to contribute to the TCC model with specific spatial aspects of tourism in cities. Only the overall arrival numbers and the most critical points of congestion are analysed, while the distribution of tourists in the urban spaces should reveal much more on the dynamics of local-tourist systems and conflicts.
Today many European city centres are developing a complex pedestrian public space network with many attraction points in it, but the ideal structure of such systems is still not clear, and the effectiveness of these networks is hard to measure or compare. A model describing these networks inside the limitations of the existing morphology could improve the efficacy of new developments and could help to determine why the same number of tourists causes overcrowding and conflicts with the locals in some cities while in others there are no visible problems.
Measuring visitors’ space usage in the tourist-historic city
The difficulties in developing a spatial model for urban tourism derive from the fact that tourists use urban environments in similar ways all other users do, therefore their quantification is extremely difficult (Law, 1994, pp. 154–159). It was already argued by Stansfield that urban tourism is not quantifiable, therefore ignored by researchers who could immerse themselves in the more measurable rural tourism (Stansfield, 1964). The lack of data being quantitative and accurate at the same time is also the reason why comparative, or ‘multiple city studies’
are rare in the field of urban tourism, and even the existing “...tend to be more narrowly focused and examine a specific aspect of a broader problem...’ (D. G.
Pearce, 2001). Beside the few examples collected by Pearce some studies comparing Hong Kong and Singapore (Henderson, 2002) and works by van der Borg comparing cultural tourism in some European cities are relevant (Russo &
van der Borg, 2002; van der Borg et al., 1996). These either compare arrival and hotel numbers; aspects of the demand side of tourism, or just have a focus on the
11
impact to residents’ attitudes, but do not compare geographical aspects. How the movements of tourists in cities can be measurable?
The classic method of questionnaires, time-space diaries filled out by tourists bought data on visitors' gaze in urban space: 11 movement styles were described analysing the movement patterns of tourists in Hong Kong (McKercher & Lau, 2008; McKercher, Wong, & Lau, 2006); Shoval & Raveh (2004) could categorize clusters of attractions in Jerusalem, visited by tourists with different characteristics; Hayllar & Griffin (2005) could define the most important themes in tourist experiences related to the physical environment and atmosphere of The Rocks district in Sydney. The use of Global Positioning Systems (GPS) or mobile phone cell-information in tracking tourists allowed a more precise measuring of tourists' movements, defining patterns in space and time (Shoval &
Isaacson, 2007, 2010). Pettersson & Zillinger (2011) combined GPS tracking and questionnaires to gather information on tourists' experiences in relationship of their movements at a sports event. Modsching, Kramer, Hagen, & Gretzel (2008) used GPS tracking data to trace the activity areas of tourists, drawing the most visited hubs and paths in the German city of Görlitz. Shoval (2008) used 3D bar diagram representations of tourist activities on the map showing the intensity of visitors' activity in the Old City of Akko. High resolution spatial and temporal data collected with GPS tracking and elaborated in GIS systems made possible to analyse and compare the spatio-temporal patterns of first time and repeat visitors to Hong Kong (Mckercher, Shoval, Ng, & Birenboim, 2012;
Shoval, McKercher, Ng, & Birenboim, 2011). A comparative study of Sydney and Melbourne recorded the track, speed and transport methods of visitors (Edwards & Griffin, 2013). These methods enabled the collection and analysis of precise data on the spatial behaviour of tourists. Still, a global method to measure tourist activity in cities is missing as the number of agents involved in such researches was limited, and methods varied from case to case.
In this paper an attempt is made to use large databases of geographically positioned tourist photography uploaded to image sharing websites (Kádár &
Gede, 2013; Kádár, 2014) to construct an abstract model of space usage. With enough data on spaces visited – in this case photographed by tourists – a spatial model of urban spaces used by these tourists could be constructed.
Modelling visitors’ space usage in the tourist-historic city
The basic model of urban tourism set up by Ashworth & Turnbridge (1990) was further developed, but still a coherent model to analyse and compare tourists’
space usage in tourist-historic cities is missing. While researchers like Pearce (1998, 1999, 2008) analysed the supply side of tourism in cities, recent works helped by GPS tracking of tourists focused on the demand side, the behaviour of tourists. Recent work by Grinberger, Shoval, & McKercher (2014) made steps to
12
conceptualise the behaviour of individual tourists, identifying three different types of strategies in the consumption of time and space in Hong Kong.
McArdle, Demšar, van der Spek, & McLoone (2014) compared walking speeds, accelerations and stops of pedestrians in Delft, identifying different trajectory clusters. These studies all seek a model of tourism geography based on the hypothesis that tourists prefer to walk between the places of interest in a city (Law, 1994, p. 128). Even if pedestrian exploration is limited by physical fitness, it is still the most used transport method between the destinations in a dense city centre (Lew & McKercher, 2006; Richter, 2010), and the presence of tourists on the streets of a city affects the perception of tourism the most. A comparable model of the tourist space systems of cities should therefore be based on an accurate description of the network of the public spaces and tourist places accessed by tourists on foot.
During a city visit patterns of tourists’ movements are influenced by their original mental maps based on the information they gathered on the destination before the trip, which will be consequently shaped by the same trip. Few studies analysed the cognitive mapping of visitors (P. L. Pearce & Stringer, 1991), but it can be stated that mental maps of tourists are pretty much the same Kevin Lynch (1960) originally have described. Lynch already argued that visitors, in contrast to residents, initially rely on landmarks to orient themselves. Cognitive maps of tourists will get richer by getting to know connecting paths and finally having an extensive knowledge of a district. Walmsley & Jenkins (1992) verified such process of environmental learning described by the anchor point theory, and they added that the initial spatial maps are replaced by sequential style maps, where the network of paths connecting nodes become the most important characteristics of mental maps. They also noted how later the original landmarks might turn out to be used as nodes, so these two categories can overlap.
Therefore urban tourists’ movements can be described with networks or graphs, as they move between nodes on edges.
Networks have the advantage to be comparable and measurable. Urban systems have been often described as networks (Dupuy, 2008). It was Alexander (1965) who first used graphs to describe the nature of urban spaces and functions in his paper: 'A City is Not a Tree'. In fact Alexander notes the disadvantages of the tree structure – where there is only one path from a point to another, a typical modernist urban arrangement – while he points out how classical multifunctional cities have semi-lattice structures – where there are multiple choices to get from one node to another. His work and the mathematical approach to urban structures has inspired many scholars, trying to describe the complex networks of cities (Salingaros, 2005).
Gospodini (2001) introduced the idea of modelling urban spaces used by tourists as graphs. Her study relied much on the principles of Alexander in defining how
13
a tree structure is less fortunate than a semi-lattice, stating that the latter is more attractive to tourists as it offers more choices of exploration, therefore more freedom, an essential value in leisure activities. Gospodini proposed to use the method of analysing syntactic space systems introduced by Hillier (1996) to model the tourist space system. This proposal have been considered by some scholars (Edwards & Griffin, 2013), but no real calculations have been made so far in lack of accurate quantitative data on all public spaces used by tourists.
Modelling the spatial system of real urban environments used by tourists with such method, therefore analysing the connectivity of attractions with space syntax will result in the numerical expression of the syntactic depth of the resulting graphs. It is assumed that the application of such a model to tourist- historic cities will show fragmented integration cores and give higher syntactic depth values in cities with reported cases of tourist congestion than in cities with no reported problems related to tourism.
Three Central-European capital cities
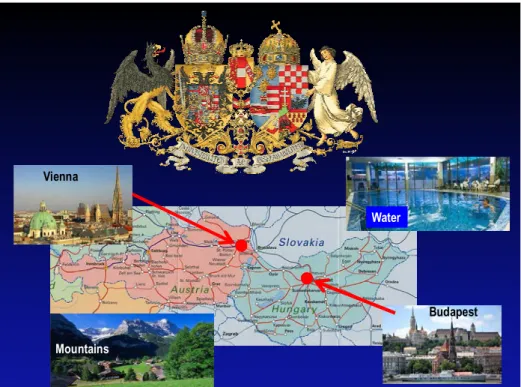
In this paper the tourist space systems of three Central European capital cities are described and compared. Vienna, Prague and Budapest have a similar offer of monuments, historical urban environments and cultural events. They draw tourists who seek historical urban environments, cultural events and evidences of a complex history of kings and emperors, a mixture of cultures and life on both sides of the Iron Curtain.
The number of visitors is also relevant for the comparison: in 2013 tourists spent 13.5 million bed nights in Vienna, 14.65 million in Prague, but only 7.8 million in Budapest (TourMIS, 2014). Budapest was well ahead in the 1980's, when 8-9 million tourists' bed nights were registered, almost double than in Vienna and almost ten times more than in Prague (Figure 2). The three cities have different experiences in their recent historical development and with the tourist use of their central spaces.
Vienna built its tourist infrastructure evenly and the number of visitors grew in steady pace: around 4 million bed nights had been registered yearly in the 1970's, 5 to 6 in the 1980's, around 7 million in the 1990's growing to over 10 million in the years 2003 to 2008. This recent growth in visitor numbers was anticipated and accompanied by some important developments in the tourist network of the city, among others the newly built Museum Quartier, and the totally refurbished Albertina. There are historical urban compositions with exclusive touristic use, like the sites that best portray the touristic brands of 'Capital of Habsburgs' and 'Capital of Music', but between these attractions all public spaces of the centre offer a mixture of services for tourists and locals alike. The tourist city and the business district meet in Vienna at the banks of the Danube Canal, which is also a developing leisure district with new bars and
14
artificial beaches, used by locals and tourists alike (Hatz, 2008). The centre of Vienna is considered to be a premium environment for living, where tourist uses do not affect the services of locals.
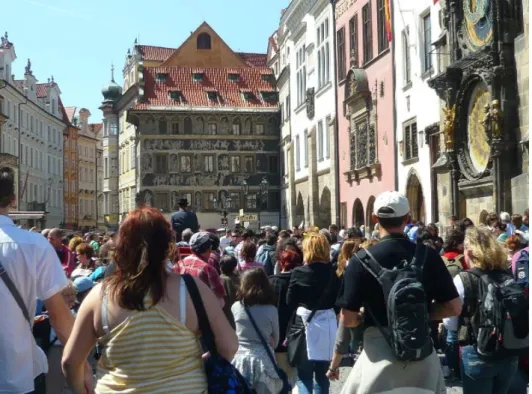
Figure 1 – Tourist overcrowding in Prague (photo by author)
Prague in contrast faced drastic changes in the use of its historic core. The city had only a moderate tourism industry before 1989, but it became the most visited destination of the Central and Eastern European region (not counting Berlin) in one decade after the fall of the Iron Curtain (TourMIS, 2014). The beauties of the 'City of a hundred spires' enchanted millions of tourists, and the new free economy served these visitors where they concentrated most, around the main sites of attraction. The restitution of buildings in the centre to the ancestors of the original owners (re-privatisation) helped this process, as tourism related services generated as much as 50 times higher revenues than the original function, as housing rents were regulated administratively (Sýkora, 1999). No professional or social will existed in this era of liberalisation to regulate the spatial or economic arrangement of the growing tourist industry (Maier, 1998).
This fast process led to socio-economical tensions in the centre described by many scholars (Cooper & Morpeth, 1998; Deichmann, 2002; Hoffman & Musil, 1999, 2009; Johnson, 1995; Simpson, 1999). The most obvious result was the fast drop in the numbers of local population of the centre (Ourednicek &
Temelová, 2009), most visible around the 'King's Way' (Figure 1), a highly overcrowded succession of streets connecting all main monuments (Simpson, 1999).
15
Budapest is interesting for the changes in its tourist space system. The centre of Pest saw a comprehensive revitalisation process in the last decade, which extended the network of public spaces with pedestrian priority. The tourists’
overcrowding of the main shopping street Váci utca, the only pedestrian street in the centre until the mid-1990s decreased in recent years and retail units with brands preferred by locals opened in the place of some souvenir shops (Rátz, Smith, & Michalkó, 2008). The extensive development of the centre of Pest in the past 10 years is bringing its results in the past few years, delivering arrival numbers growing faster than in the other two cities (Figure 2).
Figure 2 –Bed nights spent in the three cities between 1985 and 2013
The analysis of differences between the graph models of tourist activities in these historic urban cores could give answers to some questions. Why does the tourist use of central Prague create social problems and lead to the reduction of local inhabitants and the tourists' experiences when the same amount of tourists do not impede the use of Vienna's centre by locals? How did the development of new pedestrian streets lead to diminishing tourist congestion in the main shopping street of Budapest?
Methods
A measurable urban network of tourism
To compare the effectiveness of the networks of urban spaces used by tourists, an abstract space model is needed. By combining the Space Syntax method of spatial analysis (Hillier, 1996) with a spatial system corresponding to the mental maps (Lynch, 1960) of tourists defined by their actual urban movements, the method proposed by Gospodini (2001) was further developed to analyse the tourist space system of urban areas (Kádár, 2013). The method of evaluation is
16
also based on graph calculations, using the Agraph software in node mode (Manum, Rusten, & Benze, 2005), capable to calculate integration values from complex graph depth analysis with the method used by space syntax, but using constructed graphs of pedestrian tourist space usage.
The graph of tourist space usage consists of points of interests (nodes) and pedestrian street infrastructure connecting them (edges). This abstraction was selected since these two elements can be clearly separated and defined (measured) and as they also describe the complex movements and activities a tourist performs in an urban situation. The nodes are the tourist attractions, to make all graphs comparable; the first 40 most visited interconnected points of interest were selected from each of the cities. The points of interests are connected by the network of urban spaces (edges), defined by the urban morphology and by the present use of the street infrastructure. The result is a graph and the calculations of depth regarding its nodes. To compare the graphs of the different cities the integration value (i) calculated by Agraph was used, based on the mean depth (MD). The methods of calculation are the following (Manum et al., 2005):
i = 1 / RA
RA = 2 * (MD - 1) / (K - 2) MD = TD / (K – 1)
where RA is the relative asymmetry, K is the number of nodes and TD is the total depth for a node, which is the sum of the depths between a node and all other nodes. The depth is the number of nodes the minimum path – the shortest way – between the node and another node has. The integration value i describes the level of integration of one node into the system (Hillier, 1996. pp. 77-109).
Fewer connections are needed to go from one node to each of the others, the higher the integration of that node will be. The mean integration value together with minimum and maximum values shows the overall connectedness of the system.
The nodes – using tourist photography from image hosting web services In urban tourism the monuments, viewpoints and places of events are the primary objects of consumption (Ashworth & Turnbridge, 1990; Urry & Larsen, 2011; Urry, 1990). These points are marked on tourist maps, included in guided tours, and well known through post-card photographs. To visit these places is usually the primary motivation of a tourist who comes to the city the first time.
These are places where tourists photograph themselves, creating records of their visit, a final proof that they did consume the experience given by the city (Urry
& Larsen, 2011).
17
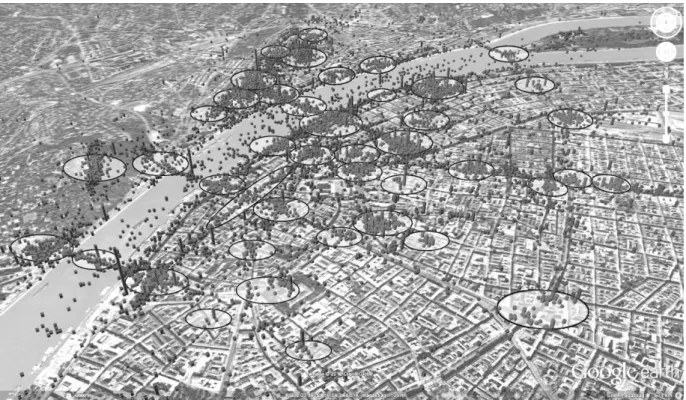
Figure 3 – Geo-visualization of tourist photographs in Budapest with the identification of places of interest – Kádár & Gede (2013)
While the role of tourist photography in the experience had been analysed by many scholars (Garrod, 2009; Jenkins, 2003; Larsen, 2006), the number of photographs of different sites have been rarely used to create statistical data concerning the interest of individual sites (Girardin, Fiore, Blat, Ratti, & Dal Fiore, 2008). With digital imaging and GPS enabled geo-referencing a relevant number of photographs with precise geographical data is uploaded and shared on social websites like Panoramio.com or Flickr.com. The motivation of tourists to record and share consumed personal experiences by their own photography meets well the possibilities offered by these online services. Some cameras (including the growing number of smart phones) have built-in GPS antennas, allowing the automation of geotagging, while the manual placement of singular images on a map is also possible on these sites. The website Flickr.com (http://www.flickr.com) is the most cited source of tourism related photography (Urry & Larsen, 2011). It hosted 6 billion images in August 2011, and this number is increasing by 3.5 million every day. The API of Flickr.com makes possible the analysis of all of these images (Gede, 2013; Popescu &
Grefenstette, 2009). More than 200 million of the images were geotagged in 2012. Cities have hundred thousands of geotagged images in their areas, Budapest had more than 300.000 in 2012. These numbers are statistically relevant, even if the users of Flickr.com are not necessary representative of all tourists visiting a destination. Studies show how the users of Flickr are younger than the average, but they are distributed in more age-groups than users of other social media (Lo, McKercher, Lo, Cheung, & Law, 2011; Nov & Ye, 2010).
18
Gede (2012, 2013) developed a method to precisely visualize and measure photographs of tourists, separated from the ones of locals. This method has been further refined (Kádár & Gede, 2013), and used to retrieve data for Vienna, Prague and Budapest for a comparative study on their tourist attractions (Kádár, 2014). The numeric results and visualizations of this study are used in this paper to retrieve data on these CE cities from the years 2000 to 2011.
From the generated maps the nodes of the graphs of tourist space systems were drawn. The nodes represented on the graph are not necessarily individual attractions, but continuous public spaces where tourists can visit and photograph attractions without moving further. Points were defined where at least one attraction was photographed; the total number of photos was higher than 50 and the pictures were taken in a range of maximum 100 meters (Figure 3).
The edges – pedestrian urban spaces
Tourists gaze through the streets, squares and passages between two attractions.
Visitors decide which route to take with the help of tourist maps and signs if there is no visual connection to the next site. An attractive pedestrian street with quality shops and visible street life is a visual magnet in itself as tourists know that these streets usually take them to another attraction and will decide to proceed gazing on them if the other options are less attractive (Zacharias, 2001).
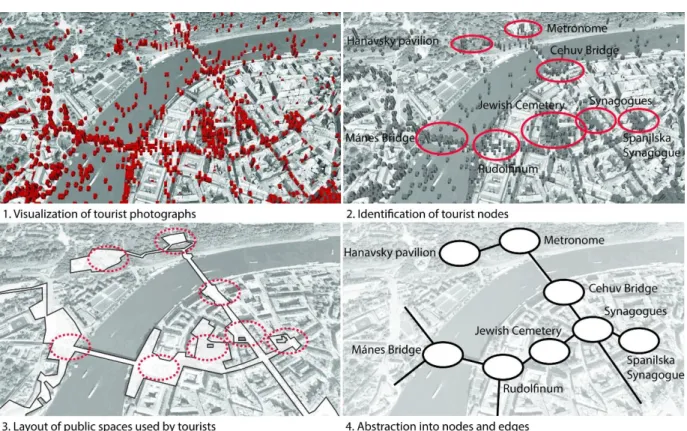
Figure 4 – Drawing the pedestrian tourist network – an example from Prague
19
In the presented graph model of the pedestrian space network of tourists the edges are defined by some simple rules coming from the behaviour of the majority of tourists, to make the different urban layouts comparable. Nodes within a distance of no more than 500 meters were connected where barrier-free pedestrian access is available and visible (Figure 4). The 500 meters rule is important to define the integral pedestrian network, as a walk longer than this distance without any further attractions is rare among tourists. Streets longer than this distance are marked on the model only if they themselves are a special experience, like a shopping street (Vienna - Naschmarkt, Budapest - Váci utca, or Prague - Wenceslas square), the crossing of a bridge with nice views (Budapest - Margaret bridge or Prague - Cechuv Bridge), or walking in a park (Vienna - Stadtpark and the Ring, or Budapest - Gellért Hill). In these cases the path itself can be a node in the graph, as it is an attraction itself. The mapping of the public spaces where tourists move were made with multiple field trips to these cities between 2009 and 2012, helped by the data of the quantification of geotagged photography and by literature.
Results
Comparing Vienna and Prague – a semi-lattice network and a tree-like structure
Vienna and Prague attract similar numbers of visitors, but these tourists move in the two cities in very different patterns. Budapest had half of the visitors of its rivals, therefore here a direct comparison is not topical, but the analysis of the changes in time can deliver new results, as the development of the urban spatial system was the largest in the case of the Hungarian capital. The graphs of pedestrian tourist space usage for these cities were created, and the integration values of the graphs were calculated using Agraph software. The lowest i values were measured for Prague, the highest i values for Vienna, and a value in- between for Budapest. The structure of the graph of Vienna is similar to a semi- lattice with few branches extending outwards the integrated core. The structure of the graph of Prague consists of few linear elements (axis) intersecting each other at only few nodes, resulting in many tree structured sub-graphs. Budapest has a hybrid structure more similar to the tree structure of Prague in the Buda side and to the semi-lattice form of Vienna in the Pest side (Figure 5Figure 6Figure 7).
The historical centre of Vienna is a compact urban form on the right bank of the Danube canal. The medieval town was built upon the ruins of the Roman military camp Vindobona. The geometrical street layout of the original Roman camp, the intensive developments of the baroque period and some minor interventions at the turn of the nineteenth and twentieth centuries made the street pattern of the centre of Vienna less irregular than the ones of a grown medieval
20
city. St. Stephen's Cathedral marks the geometrical centre of the city, today a series of pedestrian streets starting here connect the main attractions of the centre. These and the attractions of the Ring form the main tourist network. The medieval city walls were demolished and replaced by the urban composition of the Ring in the years 1860-80. This ring road organized all major institutions of both civic and monarchical origin, while it created a long awaited connecting element between the old town and the dense urban areas developing around it.
Vienna has important tourist sites outside the Ring, like the Museum Quartier, the Naschmarkt market and the Belvedere palace, all connected to the pedestrian network. Others, like the Prater or the Schönbrunn palace fall out of the area approachable on foot from the centre.
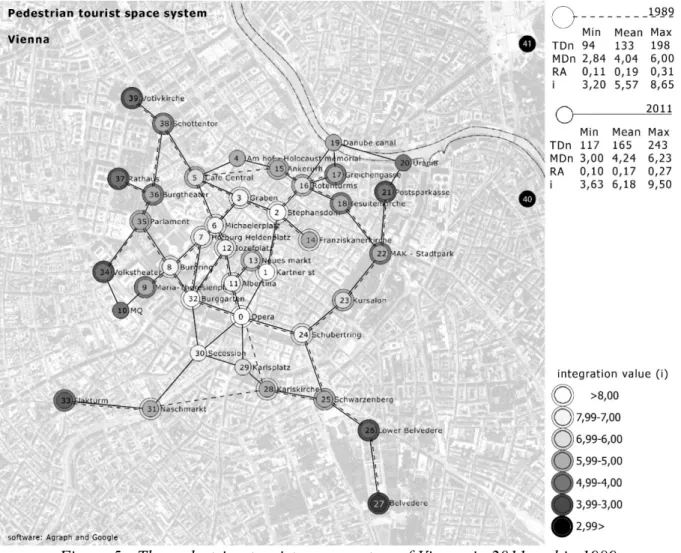
Figure 5 - The pedestrian tourist space system of Vienna in 2011 and in 1989.
Integration values elaborated with Agraph
The overall system is balanced, having well interconnected points. The centre didn't change much in the past decades, nor did the touristic offers. Exceptions are some new leisure facilities on the Danube Canal, and the establishment of the Museum Quartier. Vienna has a mean integration value of 6.16 for its pedestrian tourist system. The space syntax graph shows that the most integrated nodes in the network are around the Opera, which has an integration value of
21
9.62. Nodes around the centre all have values above 7.00, showing the area that is the potential centre for the tourist network of Vienna. Minimum values are all above 4, except for the southern end of the Belvedere (Figure 5).
The city of Prague is smaller in size and in population than its regional rivals, but the medieval centre consisting originally of four towns exceeds them in size.
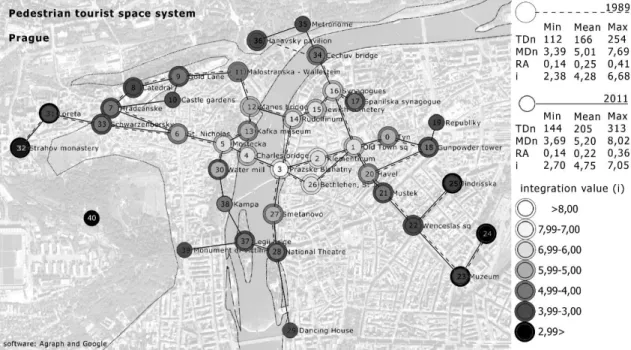
The city is divided into two by the Vltava River. The castle district on the hilltop – Hradčany – and Mala Strana – Lesser Quartier – are on the western side of the river where the street patterns and the points of access to the castle are much determined by the hilly topography. Staré Mĕsto – the Old Town – and Josefov – the Jewish Quarter – are limited by the eastern banks of the Vltava and by a semi-ring road, built in 1871 to replace the original baroque town walls. This ring is not comparable to the one in Vienna as it is not an important organizer of places of interest. There are three other main axes of tourist flow, all historical urban compositions. The Karlova or King's Way is the oldest route of medieval origin linking the Old Town from the Municipal House to the Lesser Town and the Hradčany Castle; nearly all important tourist sites of the western side are accessible from it. Another axis starts at the 750 meter long Wenceslas square crowned by the National Museum, and finishes in the Checuv Bridge and the hill with a monumental park on the other side of the river. Tourists move from Wenceslas square through Old Town square, and they continue on Parizská to the sites of the Jewish quarter in Josefov. The river is the third axial element that connects the main points of interest, most of which were placed on the riverbanks after conscious urban planning in the past centuries. Tourists look for reflected views of the city and visit the theatres, concert halls and museums on the embankments, while the main tourist site of the city is the Charles Bridge where the Karlova axis crosses the river.
Figure 6 - The pedestrian tourist space system of Prague in 2011 and in 1989.
Integration values elaborated with Agraph
22
This network remains much less integrated than the one of Vienna (Figure 6).
The most integrated points are on the Karlova, from the Charles Bridge to the Old Town square (6.50-7.05): in fact all tourists pass this section at least once.
The minimum value is below 3, while 30% of all nodes have integration values below 4 (the minimum in Vienna!). The mean integration value of 4.75 shows that this city has fewer options and new spaces for tourists to discover than in Vienna or Budapest, while visiting the same amount of attractions. The reasons for such a low values are first of all the special morphology of the city with the topographical limitations on the west side of the river, the river itself, the labyrinthine medieval street pattern of the Old Town with one main path marked, and the lack of a ring road on the eastern side of Prague to link the touristic axes described before.
Following the changes in the pedestrian network of Pest: developing from tree-like to a semi-lattice tourist system
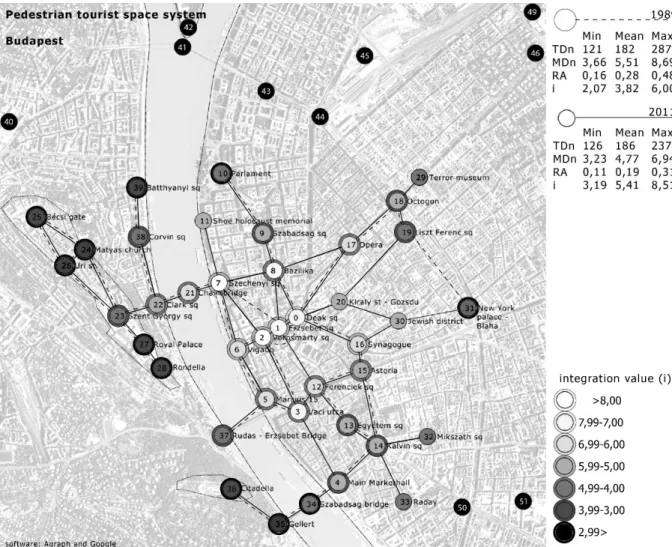
In the case of Budapest the most interesting aspect of the graphs of pedestrian space usage is the change in time. The tourist space systems of all three cities have been calculated for 2011, but also for 1989, to see the development processes. While mean integration values were 10% lower in 1989 than in 2011 for Vienna (5.57) and same for Prague (4.28), Budapest faced a development of more than 40% in this aspect (3.82 to 5.41). It is well visible from the graphs of Budapest that all of this development had happened on the Pest side of the city, mostly in the past 10 years (Rátz et al., 2008), where the “Heart of Budapest’
programme finally interconnected most pedestrianised streets in 2011. The Buda side remained mostly unchanged, and this is the part of the tourist system where the difficult topography allowed only tree-like branches of the overall network to be used by tourists (Figure 7).
As the development of Pest as a process is more interesting than the direct comparison with Vienna and Prague, therefore a sub-graph for only Pest have been created with all changes between 1989 and 2014 marked (Figure 8). Data form the quantification of geotagged photography retrieved until 2011 was completed with the new developments opened between 2012 and 2014. This sub-graph finishes on the Danube bridges, which are marked as points of interest. It is assumed that tourists conceive Buda and Pest as different districts in their mental maps, passing through bridges should also mean to end a visit at Pest, and start a new one in Buda. The 40 points most visited in Pest were selected for analysis, and the graph of 1989 had been compiled by subtracting all developments of the past 25 years, and adding the points of interest accessible back then, which are not any more visited by the majority of tourists or are not comfortably accessible without public transport any more. The graph of 1989 shows a tree-like structure only interconnected in some parts of the centre, with
23
a mean integration value of 4.17. The contemporary graph shows a semi-lattice like structure with i=6.37, better than Vienna as an overall system. It must be noted though, that this sub-system cannot be directly compared with a complete city-wide system of Vienna.
Figure 7 –The pedestrian tourist space system of Budapest in 2011 and in 1989.
Integration values elaborated with Agraph
Pest has morphology similar to that of central Vienna. The medieval city walls surrounded a compact city of similar size than in the Austrian capital, and the patterns of the closed urban blocks defining their growth in the second half of the nineteenth century were also similar. However, the master plan of 1870 followed different principles than the Viennese model. New radial avenues and ring roads were traced, with main institutions scattered in this system as decorative landmarks, mainly among the main Boulevards and Avenues. All of these main roads have car traffic on them today, but the wide pedestrian walkways ensure accessibility by foot, therefore these never ceased to be the main axes of pedestrian movement. However, the decline of services and shops on many of these streets and the extreme noise pollution made tourists and local shoppers alike to avoid many sections of these historic spaces.
24
The Great Boulevard marks the edge of the city centre used by tourists, hosting many important palaces and institutions. This second ring road has lost much of its retail potential since 1990s; therefore portions of it are presented as tourist paths only on the graph of 1989. Some popular sites on this second ring road like the Museum of Arts and Crafts, the Western Railway Station or the Margit Bridge do not appear as parts of the connected graph as no pedestrian friendly roads help to span the distances of more than 500 meters to the first attractions of the inner city.
Figure 8 - The tourist space system of Pest in 2011 and in 1989 with the paths used by tourists compared to the edges of the abstracted graph.
Integration values calculated by Agraph
The most compact and integrated part of the city is the centre of medieval origins, and some extensions of its network. The inner ring, the Small Boulevard starting in central Deák Square (P0) has always had a distinct tourist use connecting sites such as the Great Synagogue (P16). Inside its semicircle two routes leading from north to south form the spine of the pedestrian network. The first is the Danube promenade, partly developed for pedestrian use between the Chain bridge and the Erzsébet Bridge, the second is Váci utca – the first
25
pedestrian street in the 1980's (P3), extended in 1993 to the south (P25) until the Central Market hall (P4).
Many developments started in the early 2000s changed this initial system. New points of tourists’ interests were created: museums (House of Terror, 2002, P29), places of memory (Shoe Memorial of the Holocaust, 2005, P11), places and entire districts of entertainment (Szimpla Kert opened in 2001 in the hip Jewish district, P30), public spaces refurbished for pedestrian use (Király Street from 2004 – P20 – Mikszáth Square with bars – P32 – or Ráday Street with restaurants – P33). These nodes did extend the space system used by tourists but didn't make it more integrated, as most of the new attractions were outside the original system, extending it in size but not in interconnectivity.
The most important spatial improvements that made the pedestrian system of the centre more interconnected were developed in the past five years, linked to the municipal programme “The Heart of Budapest’. The base was an urban design competition held in 2006, aiming at an integrated, networked vision for the future use of the inner city. The main spine the programme became the newly refurbished “Main Street’ (built in 2010-11), leading from Szabadság Square (P9 connected to the Parliament, (P10, recently extended with a visitor centre, P39) to Kálvin Square (P14). This pedestrian priority axis relieves the tourist traffic of Váci utca, connecting most of the other routes of tourist use. Today the inner city of Pest has an exemplary pedestrian network, forming a true semi- lattice structure. Maximum integration values are between 9 and 10, growing from 6.49 at Deák Square in 1989.
Other developing area is the so-called Jewish District where popular ruin-pubs (like the most visited Szimpla kert) draw young tourists and locals alike. The re- opening of the Gozsdu passages (P27) and some pedestrian streets around them in 2009, and the newly refurbished Kazinczy Street (2011, P30) connected this district to Király Street (P20). However, the present accessibility of this once quiet residential district bought a fast and uncontrolled development of night- life, resulting in the new party district of Budapest. The hundreds of bars and clubs opened here generated growing conflicts with the basic residential functions of this area.
Conclusions
Network-based spatial planning as a tool to achieve sustainable tourism These three Central European cities have a similar number of attractions and similar cultural settings, but the patterns of tourist space usage and the effect of tourism on the social-economic system is quite different, just as their development models in the past 25 years. The unique morphology of each urban centre and the different patterns of arrangement of their main attractions define
26
the tourist space systems. The development of new attractions and new connections inside the morphological constrains of a historic city allow planning tools to alter the space system tourists use, and therefore to avoid congestion and segregation of tourists. The graph model of the system of public spaces used by tourists is a new tool to analyse tourism-related developments in cities.
The main difference between the integrated Viennese network and the tree-like tourist system of Prague comes from the different morphologies of the two cities. Still, the analysis in different historical moments of the tourist system of Budapest revealed how a tree-like structure can also develop – partly – into a well-connected network in the form of a semi-lattice. The topographical constrains are hard to overtake, so the Castle hills of Prague and Buda will hardly be as connected as the flat centre of Vienna or Pest, and a river dividing a city also poses limits. But new pedestrian friendly connections or new attractions can be placed according to careful planning even in the protected morphology of the historical city. The example of Vienna shows how tourism management and planning integrated into the urban panning practice of the city since 1955 secured a sustainable growth of tourism, integrated in space, and integrated into the daily life of locals as well (WienTourismus, 2003, 2005, 2009). On the other hand Prague followed an extremely liberal development in its tourism industry in the 1990s and 2000s, where planning was not considered to be needed for tourism. Hotels, restaurants and other tourist infrastructure concentrated beside the main tourist attractions, as the building stock of the centre was put on market after their restitution just when tourists started to discover the previously inaccessible city. The tourist system therefore did not extend off the beaten track, resulting in few axes used by all tourists flooding the city. The result is the decreasing use of Prague's centre by locals and diminishing touristic experiences in the overcrowded streets (Deichmann, 2002;
Simpson, 1999; Cooper & Morpeth, 1998; Johnson, 1995).
In the case of Budapest newly refurbished public spaces on the Pest side and new elements in the tourist offer did result in a more integrated tourist use of the centre of Budapest, a city which had similar morphological problems as Prague until these well planned developments occurred. One of the most evident changes is the appearance of retail aiming at locals in Váci utca, the main touristic route of Pest. Global fashion brands attracting a wide range of local customers in most European metropolises such as Zara, H&M and Promod (present in the central pedestrian streets of Vienna, but not of Prague) appeared in Váci utca only in the past few years when the refurbishment of many other pedestrian streets in the central area were under development (Rátz et al., 2008).
The returning local use of the once congested Váci utca shows how more interconnections between the major attractions will ease the pressure on the most overcrowded public spaces. The variety of choices Budapest has to offer, the living nature of the inner city – definitely not museumificated – and the
27
positive reviews on international travel forums in the past few years which went hand-in-hand with booming arrival numbers show that the Hungarian capital is developing in the right direction. The integrated tourist space system of Pest is an ideal one for the tourist consumption of the urban experience, but also ideal for the local consumption. Tourist congestion is not relevant in Pest, the only problematic case is the newly booming party district, which has conflicts related to functional segregation between locals and partying visitors, not to spatial congestion.
It is a question whether the segregated tourist use of the most visited historic cities can be reversed with network-based spatial planning, or it is already too late for Venice (Russo, 2002), Salzburg (Keul & Kühberger, 1997), Florence (Popp, 2012), Bruges (Neuts & Nijkamp, 2011), Prague (Simpson, 1999) or other cities facing touristification and museumification. Also it must be noted that factors less influenced by urban space can also lead to conflicts and unsustainability in tourism. However, network-based spatial planning for tourism can be a tool to avoid future congestion problems and the spatial segregation of tourists and locals in a developing destination. The example of Budapest shows how the network of public spaces and attractions of tourists’
interest can be developed in a sustainable way, making the system evolve and grow as arrival numbers increase.
Literature
Alexander, C. (1965). A City is not a tree. Architectural Forum, 122(1-2), No. 1, pp. 58–61 and No. 2, pp. 58–62.
Ashworth, G. J., & Turnbridge, J. E. (1990). The tourist-historic city. London and NY:
Belhaven Press.
Butler, R. (2011). Tourism Area Life Cycle. (C. Cooper, Ed.) (pp. 1–33). Oxford: Goodfellow Publishers.
Canestrelli, E., & Costa, P. (1991). Tourist carrying capacity. Annals of Tourism Research, 18(2), 295–311. doi:10.1016/0160-7383(91)90010-9
Coccossis, H., Mexa, A., Collovini, A., Parpairis, A., & Konstandoglou, M. Defining, measuring and evaluating carrying capacity in European tourism destinations (2001).
Athens: Environmental Planning Laboratory.
Cooper, C., & Morpeth, N. (1998). The Impact of Tourism on Residential Experience in Central-eastern Europe: The Development of a New Legitimation Crisis in the Czech Republic. Urban Studies, 35(12), 2253–2275.
Deichmann, J. I. (2002). International Tourism and the Sensitivities of Central Prague’ s Residents. Journal of Tourism Studies, 13(2), 41–52.
Dupuy, G. (2008). Urban Networks – Network Urbanism (Design Sci, p. 296). Amsterdam:
Techne Press. Retrieved from http://www.technepress.nl/publications.php?id=28 Edwards, D., & Griffin, T. (2013). Understanding tourists’ spatial behaviour: GPS tracking
as an aid to sustainable destination management. Journal of Sustainable Tourism, 21(4), 580–595. doi:10.1080/09669582.2013.776063
Garrod, B. (2009). Understanding the Relationship between Tourism Destination Imagery and Tourist Photography. Journal of Travel Research, 47(3), 346–358.
28
Gede, M. (2012). Visualization Methods of Spatial Distribution of Geotagged Photography.
In Data is Beautiful Conference (pp. 52–56). Budapest: Kitchen Budapest.
Gede, M. (2013). Fényképek térképei – geotaggelt fotók térbeli eloszlásának térképes vizsgálata. Geodézia És Kartográfia, 65(1-2), 17–19.
Girardin, F., Fiore, F. D., Blat, J., Ratti, C., & Dal Fiore, F. (2008). Understanding of Tourist Dynamics from Explicitly Disclosed Location Information. Journal of Location Based Services, 2(1).
Gospodini, A. (2001). Urban Design, Urban Space Morphology, Urban Tourism: An Emerging New Paradigm Concerning Their Relationship. European Planning Studies, 9(7), 925–934. doi:10.1080/0965431012007984
Grinberger, a. Y., Shoval, N., & McKercher, B. (2014). Typologies of tourists’ time–space consumption: a new approach using GPS data and GIS tools. Tourism Geographies, 16(1), 105–123. doi:10.1080/14616688.2013.869249
Hatz, G. (2008). Vienna. Cities, 25(5), 310–322. doi:10.1016/j.cities.2008.02.002
Hayllar, B., & Griffin, T. (2005). The precinct experience: a phenomenological approach.
Tourism Management, 26(4), 517–528.
Henderson, J. C. (2002). Heritage attractions and tourism development in Asia: a comparative study of Hong Kong and Singapore. International Journal of Tourism Research, 4, 337–344.
Hillier, B. (1996). Space is the machine. Cambridge: Cambridge University Press.
doi:10.1016/S0142-694X(97)89854-7
Hoffman, L. M., & Musil, J. (1999). Culture meets commerce: tourism in postcommunist Prague. In D. Judd & S. Fainstein (Eds.), The Tourist City (pp. 179–197). New Haven:
Yale University press.
Hoffman, L. M., & Musil, J. (2009). Prague, Tourism and the Post-industrial City (No. GCP- 09-05). Tourism. Great Cities Institute College of Urban Planning and Public Affairs University of Illinois at Chicago.
Jenkins, O. H. (2003). Photography and travel brochures: the circle of representation.
Tourism Geographies, 5(3), 305–328. doi:10.1080/1461668032000098024
Johnson, M. (1995). Czech and Slovak tourism Patterns - problems and prospects. Tourism Management, 16(1), 21–28.
Jurado, E. N., Tejada, M. T., García, F. A., González, J. C., Macías, R. C., Peña, J. D., … Becerra, F. S. (2012). Carrying capacity assessment for tourist destinations.
Methodology for the creation of synthetic indicators applied in a coastal area. Tourism Management, 30(1), 1–10. doi:10.1016/j.tourman.2011.12.017
Kádár, B. (2013). Differences in the spatial patterns of urban tourism in Vienna and Prague.
Urbani Izziv, 24(2), 96–111. doi:10.5379/urbani-izziv-en-2013-24-02-002 Kádár, B. (2014). Measuring tourist activities in cities using geotagged photography.
Tourism Geographies, 16(1), 88–104. doi:10.1080/14616688.2013.868029
Kádár, B., & Gede, M. (2013). Where Do Tourists Go? Visualizing and Analysing the Spatial Distribution of Geotagged Photography. Cartographica: The International Journal for Geographic Information and Geovisualization, 48(2), 78–88.
doi:10.3138/carto.48.2.1839
Keul, A., & Kühberger, A. (1997). Tracking the Salzburg Tourist. Annals of Tourism Research, 24(4), 1008–1012.
Larsen, J. (2006). Geographies of Tourist Photography Choreographies and Performances.
In J. Falkheimer & A. Jansson (Eds.), Geographies of Communication: The Spatial Turn in Media Studies (pp. 241–258). Göteborg: Nordicom.
Law, C. M. (1994). Urban Tourism - Attracting Visitors to Large Cities (p. 189). London:
Mansell.
29
Lew, A. A., & McKercher, B. (2006). Modeling Tourist Movements: A Local Destination Analysis. Annals of Tourism Research, 33(2), 403–423.
doi:10.1016/j.annals.2005.12.002
Lo, I. S., McKercher, B., Lo, A., Cheung, C., & Law, R. (2011). Tourism and online photography. Tourism Management, 32(4), 725–731.
doi:10.1016/j.tourman.2010.06.001
Lynch, K. (1960). The Image of the City (p. 194). Cambridge, Massachusetts: MIT Press.
Maggi, E., & Fredella, F. L. (2010). The carrying capacity of a tourist destination. The case of a coastal Italian city. In Proceedings ERSA Congress Sustainable Regional Growth and Development in the Creative Knowledge Economy (pp. 1–18).
Maier, K. (1998). Czech planning in transition: Assets and deficiencies. International Planning Studies, 3(3), 351–365. doi:10.1080/13563479808721719
Manum, B., Rusten, E., & Benze, P. (2005). AGRAPH, Software for Drawing and Calculating Space Syntax “Node-Graphs’ and Space Syntax “Axial-Maps.’ 5th International Space Syntax Symposium Delft 2005. Retrieved from http://www.ntnu.no/ab/spacesyntax/
McArdle, G., Demšar, U., van der Spek, S., & McLoone, S. (2014). Classifying pedestrian movement behaviour from GPS trajectories using visualization and clustering. Annals of GIS, 20(2), 85–98. doi:10.1080/19475683.2014.904560
McKercher, B., & Lau, G. (2008). Movement Patterns of Tourists within a Destination.
Tourism Geographies, 10(3), 355–374. Retrieved from
http://www.tandfonline.com/doi/abs/10.1080/14616680802236352
Mckercher, B., Shoval, N., Ng, E., & Birenboim, A. (2012). First and Repeat Visitor
Behaviour: GPS Tracking and GIS Analysis in Hong Kong. Tourism Geographies, 14(1), 147–161. doi:10.1080/14616688.2011.598542
McKercher, B., Wong, C., & Lau, G. (2006). How tourists consume a destination. Journal of Business Research, 59(5), 647–652. doi:10.1016/j.jbusres.2006.01.009
McNeill, D. (1999). Globalisation and the European city. Cities, 16(3), 143–147.
Modsching, M., Kramer, R., Hagen, K. Ten, & Gretzel, U. (2008). Using Location-based Tracking Data to Analyze the Movements of City Tourists. Information Technology &
Tourism, 10(1), 31–42. doi:http://dx.doi.org/10.3727/109830508785059011 Neuts, B., & Nijkamp, P. (2011). Crowding Perception in a Tourist City: A Question of
Preference (No. TI 2011-140/3). SSRN Electronic Journal. Amsterdam: Tinbergen Institute Discussion Paper. doi:10.2139/ssrn.1938174
Nov, O., & Ye, C. (2010). Why do People tag? Motivations for photo tagging.
Communications of the ACM, 53(7), 128–131.
O’Reilly, A. M. (1986). Tourism carrying capacity - Concept and issues. Tourism Management, 7(4), 254–258.
Ourednicek, M., & Temelová, J. (2009). Twenty years after socialism: the transformation of Pragues inner structure. Studia Universitatis Babes-Boyai, Sociologia, 54(1), 9–30.
Retrieved from http://studia.ubbcluj.ro/download/pdf/429.pdf#page=10
Pearce, D. G. (1998). TOURISM DEVELOPMENT IN PARIS Public Intervention. Annals of Tourism Research, 25(2), 457–476.
Pearce, D. G. (1999). Tourism in Paris, Studies at the Microscale. Annals of Tourism Research, 26(1), 77–97.
Pearce, D. G. (2001). An integrative framework for urban tourism research. Annals of Tourism Research, 28(4), 926–946.
Pearce, D. G. (2008). A needs-functions model of tourism distribution. Annals of Tourism Research, 35(1), 148–168. doi:10.1016/j.annals.2007.06.011
Pearce, P. L., & Stringer, P. F. (1991). Psychology and tourism. Annals of Tourism Research, 18(1), 136–154.