1
Assignment of vibrational circular dichroism cross-referenced electronic circular dichroism spectra of flexible foldamer building blocks: towards
assigning foldamers’ pure chiroptical properties
Viktor Farkas*,1 Adrienn Nagy,2 Dóra K. Menyhárd,1 and András Perczel*1,2
1MTA-ELTE Protein Modelling Research Group, 2Laboratory of Structural Chemistry and Biology, Institute of Chemistry, Eötvös Loránd University, Pázmány P. stny. 1/A, Budapest H-1117, Hungary
*e-mail: farkasv@caesar.elte.hu & perczel.andras@ttk.elte.hu Graphical abstract:
Abstract: The assignment of the most established ECD spectra of polypeptides and foldamers is either
“evidence based” or rely on the 3D-structures of longer oligomers of limited internal dynamics, derived from NMR (or X-ray) data. Critics warn that using NMR and ECD side by side have severe limitations for flexible molecules as the explicit knowledge of the conformational ensembles is a challenge. Herein we present the old-new method of comparing ab initio computed and measured VCD data to validate both structures and, conf(i), and their relative weights, c(i), making up the conformational ensemble.
Based on the array of {conf(i), c(i)} the pure ECD spectra, g(i)conf(i), can be ab initio calculated. The reconstructed spectrum Σc(i)*g(i)conf(i) can thus help to assign any experimental ECD counterpart. Here we present such a protocol successfully applied for flexible foldamer building blocks of sugar β-amino acid diamides. The epimeric pair of our model system was selected because these molecules are conformationally tunable by simple chemical modification (N-methylation) and thus, the robustness of our current approach could be probed. The initial H-bond (NH..O) eliminated by N-methylation reorients the amide plain influencing the chiroptical properties of the foldamer building block, a structural change successfully monitored by the VCD- and ECD-transition changes now assigned to pure conformers. The current method seems general and effective without requiring extensive CPU and spectroscopic resources.
2
List of abbreviations FUV-ECD: Far-UV Electronic Circular Dichroism, ACPC: 2- aminocyclopentanecarboxylic acid, ATFC: β-aminotetrahydrofurancarboxylic acid, Multidimensional Conformation Analysis, β-SAAD: β-sugar amino acid diamides, d(Å): distance, Ac-RibAFU(ip)-NHMe (1a): N-methyl-1,2-O-isopropylidene-3-acetamino-3-deoxy-α-D-ribofuranuronamid, Ac-XylAFU(ip)- NHMe (2a): N-methyl-1,2-O-isopropylidene-3-acetamino-3-deoxy-α-D-xylofuranuronamid, Ac- RibAFU(ip)-NMe2 (1b): N,N-dimethyl-1,2-O-isopropylidene-3-acetamino-3-deoxy-α-D- ribofuranuronamid, , Ac-XylAFU(ip)-NMe2 (2b): N,N-dimethyl-1,2-O-isopropylidene-3-acetamino-3- deoxy-α-D-xylofuranuronamid
3
1.
IntroductionBoth proteinogenic α- and non-natural but biocompatible β-, γ-, δ- and ε-amino acids are in use as Lego-like building blocks to modify and redesign proteins, chimera-peptides and foldamers [1,2]. To be able to tailor the structure and properties of these macromolecules a firm knowledge of the conformational properties of the building blocks themselves is required, thus the structural elucidation of such molecules is a hot topic of current structural chemistry and biology. Both NMR- and ECD- spectroscopic data combined with MD- and applied QM-calculations play a significant role (beside other techniques (IR, Raman, etc.)) in deciphering their inherent structural properties. While laborious NMR and/or X-ray techniques are needed to determine high resolution structural data, chiroptical spectroscopy, both ECD and VCD, is rapid in reporting global conformational features of the same macromolecules. For inherently dynamic systems NMR provides time average restrains only, while X- ray reports on the most stable conformer. Thus, VCD and ECD data complemented with ab initio structures are efficient and reliable complementary techniques, if used in conjunction. Here we present how VCD cross-validated conformers, obtained at an appropriate level of theory are especially useful to get and assign chiroptical properties including ECD spectra of pure conformers of dynamic systems.
Two dihedral angles per residue (φ, ψ) are sufficient to describe and characterize the major types of secondary structural motifs, such as -helices (αL, αD,), -sheets (βL)) etc. in polymers of - amino acid residues[3]. However, for β-residues, three backbone torsional angles (φ, Θ, ψ) are required to determine a similar level of structural information, labeled as zigzag [Z], helix [H], spiral [S], elongated [E] etc. motifs[4] (Scheme 1). However, the increase in complexity does not result in over all a greater structural variability. β-amino acids have less flexible backbones[5] as their sequentially adjacent amide-bonds are separated more in space (insertion of an extra sp3 C-atom), which liberty allows them to form more stable secondary structures.[6]
Scheme 1. Two backbone dihedral angles (φ, ψ) characterize secondary structures of α-, but three (φ, Θ, ψ) of those per residue make up structures built from β-residues.
4
ECD-spectroscopy is a widely used chiroptical technique in describing the conformational properties of polyamides in solution. Today the ECD-spectra of most secondary structural elements consisting of α-amino acids are assigned and characterized: class A (β-sheets), class B (II-β-turns), class C (α-helix, I(III)-β-turns), class U (unordered or highly dynamic conformation), etc. following the seminal theoretical study of Woody and others.[7,8] Thus, ECD spectral patterns are assigned to characteristic backbone torsional subspaces: φA±ζ, ψA±ζ, φB±ζ, ψB±ζ, etc.. For β-peptides however, a similar assignment library is not yet complete, in fact hardly started, although ECD-spectra of dozens of polypeptides were reported.[9,10] From the ‘90s with the appearance of foldamers, the field of non- proteogenic amino acid containing polypeptides has expanded. Contrary to α-, for β-peptides and foldamers the structure assignment of ECD-spectra is more of a challenge, as the latter field lacks the fruitful spectral arsenal of evolutionary optimized typical protein’s folds used to decipher ECD properties of α-amino acids in their oligomeric secondary structures. The generalized scheme of data acquisition and interpretation (summarized below (Scheme 2)) starts with the synthesis of suitable β- oligomers, followed by low- and high-resolution data acquisition. The obtained high resolution structural information (NMR and X-ray data) are directly assigned to the recorded chiroptical data (ECD, seldom VCD).
Scheme 2: Attempts to assign ECD-spectra of β-peptides and foldamers
This method can successfully be applied to characterize ECD-spectra of foldamers composed of β- amino acids of limited backbone dynamics e.g. 2-aminocyclopentanecarboxylic acid (ACPC for short).
5
Gellman et al. (trans-R,R),[11] Martinek at al. (cis-R,S)[12] as well as Davies et al. (trans-S,S)[13] used the hydrophobic β-amino acid ACPC to make foldamers. They have shown that if the configuration of ACPC is set cis, then the backbone fold of (ACPC)n is exclusively extended-like. On the other hand, the homo- oligomer built from trans_ACPC adopts a helical overall fold. For the structure assignment of their ECD- spectra, in line with Scheme 2, they have used either X-ray or NOE data.[11-13] Thus, the ECD-spectra measured in dilute solutions are directly attributed to structural information derived from a 5-10 times more concentrated solution state data or from solid state structural information, which raised numerous concerns.[2, 14-16] For example, Glättli et al. pointed out that in case of H-(β-HVal-β-HAla-β- HLeu)2 and its dimethylated form [H-(β-HVal(Me2)-β-HAla(Me2)-β-HLeu-(Me2))2] which present nearly identical ECD spectra, the NMR-based structural assignment of a 314-helix is unlikely to be correct, as the dimethylated variant cannot form such a conformer due to steric repulsion.[14, 17] In addition, both the Seebach and Gellman groups have published further examples illustrating that an NMR-ECD contradiction does exist for hybrid foldamers, for systems composed of α- & β- or α- & γ-amino acid residues.[2, 18] The problem with the concept of using NMR as the high resolution referencing method of ECD arises from the fact that for short and flexible oligomers the available J-coupling constant, NOE and/or secondary chemical shift information are just too few and sparse for reconstructing ensembles of multiple backbone conformers. Furthermore, due to the time-scale of NMR measurements, the acquired data reflect on a time average 3D-structure, as the deconvolution of NMR spectra is not yet straightforward. In addition, X-ray gives a single (or few), rather than multiple conformers as would have been expected for an inherently flexible oligopeptide. On the other hand, ECD spectroscopy that is sensitive to even such small structural variations of the amide planes that are undetectable by NMR is ideal for complementing or replacing these methodologies.[15, 16]
6 Aims:
1) Instead of using an X-ray determined single, or an NMR based condensed molecular structure to attempt the assignment of ECD spectra to structure, our goal was to derive an alternative strategy. We propose here to complete ECD assignment via cross-validated VCD information in combination with MM and ab initio structure ensemble data and spectra. We will demonstrate that by using low-resolution, absolute configuration controlled chiroptical methods, structural information of high significance can be gained even in the case of flexible nano-systems.
2) We present here an example how this old-new assignment strategy can be applied by using cyclic β-amino acid derivatives of tunable backbone conformationally properties. Our pair of amino-furanuronicacid diamides (Ac-AFU(ip)-NH2) (namely the C3 epimeric pair of Ac- RibAFU(ip)-NHMe (1a) and Ac-XylAFU(ip)-NHMe (2a)) and their N-methylated Ac-RibAFU(ip)- NMe2 (1b) and Ac-XylAFU(ip)-NMe2 (2b) variants is a good example to show how a minute change (H↔CH3) may affect the overall conformation and how such backbone conformational shifts can be effectively recorded and deciphered by chiroptical methods.
Results and Discussion:
The characterization of polypeptide building blocks by ECD could be a promising approach as mentioned above however, requests spectral deconvolution and the assignment of the pure ECD curves.[18-20] The relative orientation of the chirally perturbed consecutive amide planes, in line with Niggli et al., fundamentally influence the shape of the ECD-spectra.[16] However, in case of conformational ensembles, the determination of all backbone structures seems a key but demanding task (e.g. Ac-Aaa-NHMe) termed as Multidimensional Conformation Analysis (MDCA).[20-22] For α- amino acid diamides, nine typical backbone structures are expected to occur on their potential energy surface of E= f(φ, ψ), while for β-amino acid diamides, the similar E= f(φ, θ, ψ) hypersurface could have as many as 27 (=3*9) different backbone types. For cyclic amino acid such as ACPC the reduced conformational surface E= f(φ, θ~60°, ψ) comprises only 18 (=2*9) minima.[4, 23, 24] Our main objective is to present a robust approach to assign characteristic ECD-spectrum to secondary structures via the appropriate VCD-spectrum, straightforward to calculate by using DFT method. The experimental ECDexp(λ) assignment will complete the protocol outlined below.
#1: Both the ECDexp(λ) and the VCDexp(ṽ) of the oligomer (foldamer) is measured.
7
#2: The conformationally relevant structures (minimum energy structures) of the oligomer are obtained both by MDCA and Monte Carlo Multiple Minimum (MCMM) conformer search.
#3: The topologically different, low energy conformers are geometry optimized by using a suitable DFT (e.g. B3LYP/6-311+G(d,p)): both conformers and their relative weights (ci) are determined.
#4: For each of the conformers, their VCD spectrum (VCDicalc(ṽ)) is calculated (e.g. B3LYP/6- 311+G(d,p)).
#5: VCDexp(ṽ) is compared to the sum of the conformational weighted individual spectra:
VCDcalc(ṽ)= Σci*VCDicalc(ṽ).
#6: The semiquantitative similarity of VCDexp(ṽ) to Σci*VCDicalc(ṽ) validates both the conformational weights (ci) and the calculated conformers.
#7: the validated ensemble is used to calculate the ECDicalc(λ) spectrum (at a given level of theory e.g. B3LYP/6-311+G(d,p)) as Σci*ECDicalc(λ).
#8: The (semi) quantitative similarity between Σci*ECDicalc(λ) and ECDexp(λ) ensures the structure assignment of the measured ECD-spectrum.
Scheme 3: The new approach to assign ECD-spectral properties to backbone structures of flexible oligo- and polypeptides, foldamers, etc..
8
Unlike ECD-, limited to a few amide chromophore transitions (e.g. n→π*, π →π*), obtaining a VCD-spectrum requires no chromophore and usually contains a lot of vibrational bands to analyze as function of the molecular structure. Thus, if the absolute configuration of the molecule is known, then the VCD-technique is excellent to determine backbone torsion angles and thus, conformational properties of polyamide chain can be retrieved. Today the ab initio level VCD spectrum calculations are more advanced than those targeting ECD.[25] Thus, measuring and attempting to reproduce the VCD spectrum of a complex system is an excellent method to validate whether the correct conformational distribution has been obtained for a target system, in other words, to ensure that all relevant conformers were found and incorporated into the ensemble. These structures then can be used for the calculation and analysis of ECD spectra.[26]
Our interpreted example comprises a pair of furanuronicacid diamide (Ac-AFU(ip)-NH2: Ac- RibAFU(ip)-NHMe (1a) and Ac-XylAFU(ip)-NHMe (2a)) and their N-methylated variants Ac-RibAFU(ip)- NMe2 (1b) and Ac-XylAFU(ip)-NMe2 (2b). The AFU building blocks are water-soluble variants of ACPC, one of the most studied foldamer building blocks. Inserting an oxygen into the completely hydrophobic cyclopentyl sidechain of ACPC affords ATFC (β-amino-tetrahydrofurancarboxylic acid. The -CH2- → O- atom replacement eliminates the steric repulsion between -CH2- and the amide NH and forms a favorable electrostatic interaction (O…HN) in forms of an H-bond stabilizing selected backbone conformers. This H-bond in ATFC fixes and orients the C-terminus amide plane, measured by ψ and thus, effectively reduces the available conformational space of the cyclic β-amino acid residue. [24, 27-31]
(Such an H-bond was identified in a close derivative (α‑D‑xylofuranuronamide (Ph3P=N-XylAFU[ip]- NHMe)) by X-ray crystallography[32]). MCMM conformational search resulted in conformers on average, the energetic ordering and population distribution of which was determined by DFT calculations. The most significant conformers are discussed below, grouped according to their basic structural features.
9
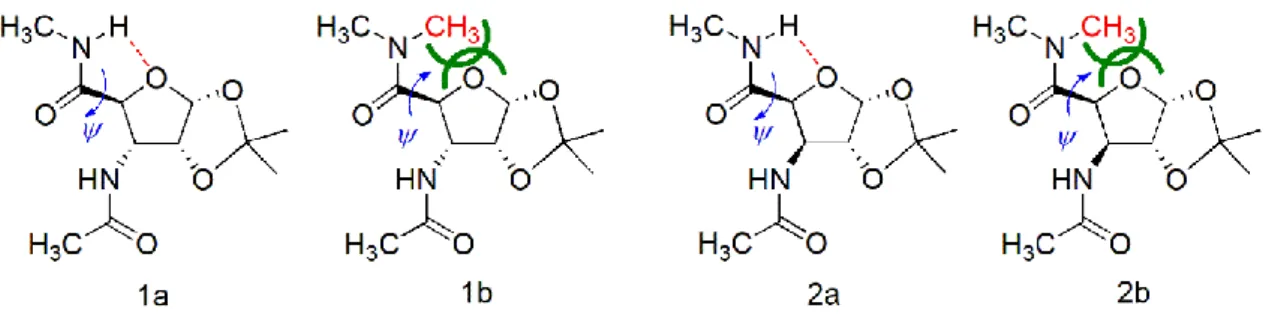
Figure 1. The four β-sugar amino acid diamides foldamer building units studied here as an example.
Both in 1a and 2a rotation of ψ is restricted by the favorable intramolecular H-bond fixing ψ at ≈+110°.
As soon as the H-bond is eliminated (1b and 2b) a steric repulsion (green lines) is introduced and thus backbone structure changes markedly: ψ≈-120°. The ψ change controlled spectral shift will be assigned successfully by our current method showing the efficacy and sensitivity of this approach.
I) H-bond stabilized conformers
In building block 1a and 2a (Figure 1.), the NH…O-type intraresidual H-bond is “active and operative”
and thus, poses a restriction on the free rotation about torsion angle ψ. The strength of such conformational restriction is proportional to the strength of the H-bond, which can be described by the donor-acceptor distance (dN…O(Å) and dH…O(Å)) and N-H…O angle (angleNH…O(°)). The closer the value of d(Å) is to ~2.4 Å and that of the angleNH…O(°) to ~120°, the stronger the H-bond and more severe the restriction is. 1a_conf1, 2a_conf1 and 2a_conf3 have short d(s) (<2.7 Å) and close to ideal angleNH…O
values (102.2° and 114.7°, Table 1, Figure 2.) and thus, conformer selection occurs both for the Rib- and the Xyl-configuration. In line with the above described assignment protocol these rotamers will be the most relevant backbone conformers both for 1a and 2a (Table 1), (step #2 & 3 of Scheme 3), as it lowers the relative conformational free energy of conf1 by more than 9 kJ/mol as compared with those of conf2 in case of both Ac-AFU-NHMe models.
10
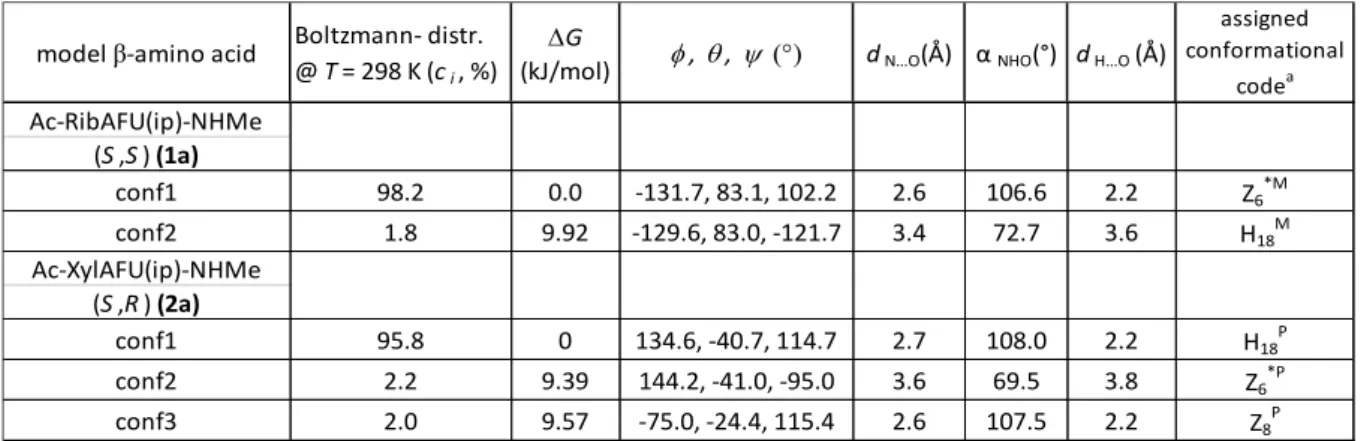
Table 1. Selected structural parameters of the two Ac-AFU-NHMe models, of Rib (1a) and Xyl (2a) configurations calculated at B3LYP/6-311+G(d,p) levels of theory.
model β-amino acid Boltzmann- distr.
@ T= 298 K (ci, %) DG
(kJ/mol) f, q, y dN…O(Å) α NHO(°) dH…O (Å)
assigned conformational
codea Ac-RibAFU(ip)-NHMe
(S,S) (1a)
conf1 98.2 0.0 -131.7, 83.1, 102.2 2.6 106.6 2.2 Z6*M
conf2 1.8 9.92 -129.6, 83.0, -121.7 3.4 72.7 3.6 H18M
Ac-XylAFU(ip)-NHMe (S,R) (2a)
conf1 95.8 0 134.6, -40.7, 114.7 2.7 108.0 2.2 H18P
conf2 2.2 9.39 144.2, -41.0, -95.0 3.6 69.5 3.8 Z6*P
conf3 2.0 9.57 -75.0, -24.4, 115.4 2.6 107.5 2.2 Z8P
a according to Beke et al.[4]
Based on the determined (f, , y) dihedral triplets, 1a adopts a zig-zag (Z6*M) while 2a a helical (H18P) backbone structure.
Figure 2. The two most abundant conformers of 1a and 2a: both have the intramolecular H-bond acting as a conformer selector.
VCD spectra of 1a and 2a were measured in MeCN-d3, and the most informative C=O stretching motion of the amide group is analyzed and discussed in details (step #1). For all relevant conformers, ci>1%
(Table 1), the associated VCD spectra (VCDicalc(ṽ)) were calculated at B3LYP/6-311+G(d,p) level of theory (step #4).
11
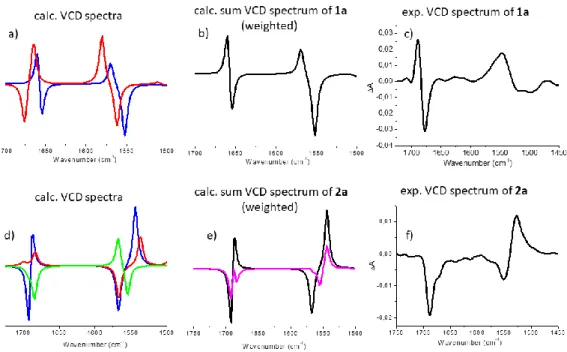
Figure 3.: a and d) The pure VCD spectra of the conformers, VCDicalc(ṽ), calculated both for 1a and 2a (blue: conf1, red: conf2 and green conf3). b and e) Conformational weights ci used for spectrum reconstruction: Σci*VCDicalc(ṽ), by summing up for 1a: 0.982 of 1a_conf1 plus 0.018 of 1a_conf2.
Similarly for 2a summation was completed as follows: 0.958 of 2a_conf1 + 0.022 of 2a_conf2 + 0.020 of 2a_conf3. In the case of the magenta spectrum (panel e) the summation was done by using 0.4 of 2a_conf1 + 0.6 of 2a_conf3. c and f) the experimental VCD spectra.
The VCDexp(ṽ) of 1a shows high resemblance to ΣVCDicalc(ṽ) and therefore, we conclude, that Ac-RibAFU(ip)-NHMe adopts predominantly a zigzag (Z6*M) backbone conformer in MeCN. The VCDexp(ṽ) of 2a has two negative amide I absorptions (1688 cm-1 and 1671 cm-1 (shoulder), respectively) (Figure 3/f). However, Σci*VCDicalc(ṽ), (Figure 3/e, black curve) shows poorer agreement with the experimental data, especially near 1685 cm-1. The calculated pure spectrum of 2a_conf3 has a negative band at 1684 cm-1 (green curve, Figure 3/d) associated with a backbone conformer which has an H- bond between the C-terminal amide NH and the ring O-atom. The latter conformer differs from 2a_conf1 in terms of its φ value (+134.6° compared to -75.0°, Table 1), thus 2a_conf1 and 2a_conf3 are somewhat similar. Therefore, if the contribution of 2a_conf3 would be higher than 2% (e.g. 60%) and that of 2a_conf1 would be reduced to 40%, than the agreement between VCDexp(ṽ) and ΣVCDicalc(ṽ) would be significantly better (Figure 4/e magenta). Correlation reached we may conclude that the structure of Ac-XylAFU(ip)-NHMe diamide in MeCN solution is a mixture of helical (H18P) and zig-zag (Z8P) conformers. [4, 24]
The foreseen intraresidual H-bond exists in all of the relevant conformers (Figure 4) forming a five-membered pseudo-ring, a motif also found in several structures deposited in the Cambridge
12
Structural Database. [33] This structure stabilizing interaction influences both the molecular scaffold and thus, the physicochemical properties (e.g. solubility, lipophilicity and permeability), important aspects of drug design and discovery.[34] Similar intramolecular H-bonds were described by Saludes et al. in a sialic acid foldamer, by Sharma et al. in the case of other SAAs and in a foldamer made from a phenylisoserine derivative. [27-29, 35]
a) b)
Figure 4.: Scaffold of two selected conformers of SAA 1a and 2a with selective NBOs highlighting the intraresidual H-bonds: a) 1a_conf1 (bond [BD, pale blue] of NH and lone pair [LP, pale blue] of Oring, b) and 2a_conf1 (bond [BD, pale blue] of NH and lone pair [LP, pale blue] of Oring), respectively.
II) Conformers shifted by steric repulsion
If H-bond is “turned off” and at the same time a considerable steric repulsion is introduced by the introduction of an additional methyl group (H→CH3) (Figure 1), than a significant conformational shift of ψ is seen both for 1b and 2b: Ac-RibAFU(ip)-NMe2 (1b) and Ac-XylAFU(ip)-NMe2 (2b). Therefore, both the conformer type and population and thus, the VCD- and the ECD-spectra of these models should be markedly different compared to 1a and 2a. Continuing the systematic conformational space search (step #2) and the subsequent structure optimization (step #3) the dominant backbone structures were once again elucidated (Table 2) for 1b and 2b.
13
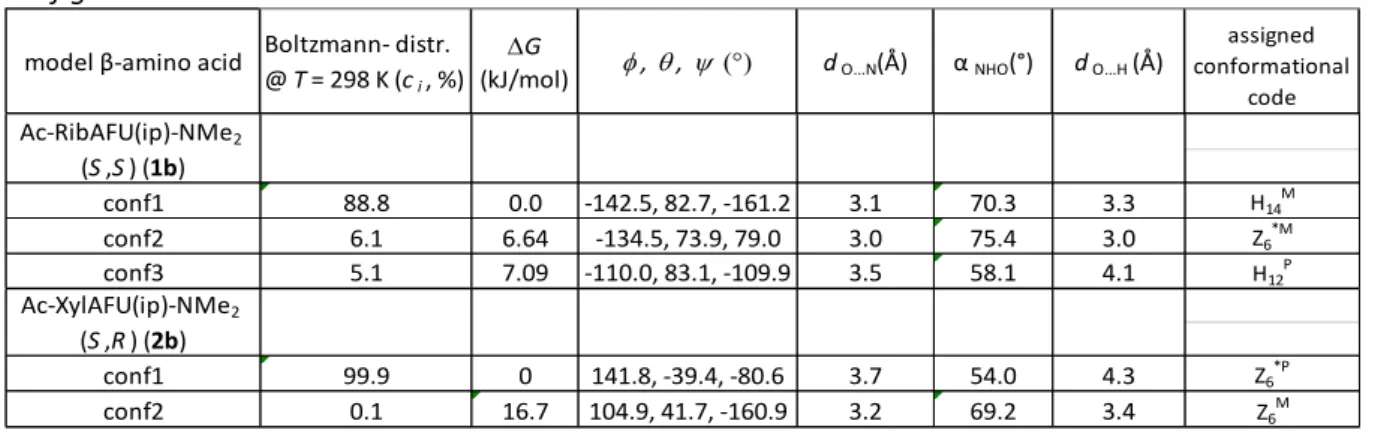
Table 2. Selected structural parameters of the two Ac-AFU-NMe2 building block, of Rib (1b) and Xyl (2b) configurations.
model β-amino acid Boltzmann- distr.
@ T= 298 K (ci, %) DG
(kJ/mol) f, q, y dO…N(Å) α NHO(°) dO…H (Å)
assigned conformational
code
conf1 88.8 0.0 -142.5, 82.7, -161.2 3.1 70.3 3.3 H14M
conf2 6.1 6.64 -134.5, 73.9, 79.0 3.0 75.4 3.0 Z6*M
conf3 5.1 7.09 -110.0, 83.1, -109.9 3.5 58.1 4.1 H12P
conf1 99.9 0 141.8, -39.4, -80.6 3.7 54.0 4.3 Z6*P
conf2 0.1 16.7 104.9, 41.7, -160.9 3.2 69.2 3.4 Z6M
Ac-RibAFU(ip)-NMe2
(S,S) (1b)
Ac-XylAFU(ip)-NMe2
(S,R) (2b)
We found that in both of these cases a strong conformer selection is operative: a single (ci>99%) or at least a dominant (ci>89%) backbone conformer is calculated for both of the stereoisomers. In conf1 structure of both 1b and 2b the N…Oring distance is remote. This steric hindrance reorients the C-terminus of the building blocks: namely ψ changes from +102.2° to -161.2°
(Δ= 96.6°) if configuration is “Ribo” (1b_conf1) and from +114.7° to -80.6° (Δ= 164.7°) if configuration is “Xylo” (2b_conf1) (Figure 5). As a conclusion, 1b has a helical (H14M), while 2b a zigzag (Z6*P) backbone structure. [4]
Figure 5. a) The superimposed major conformers (Table 2) of 1a on 1b and b) 2a on 2b. Green dashed lines indicate the H-bond (turned-on state) in the case of 1a and 2a, red arrow shows the conformational shift introduced by H-bond turned-off with steric repulsion turned-on (1b, 2b).
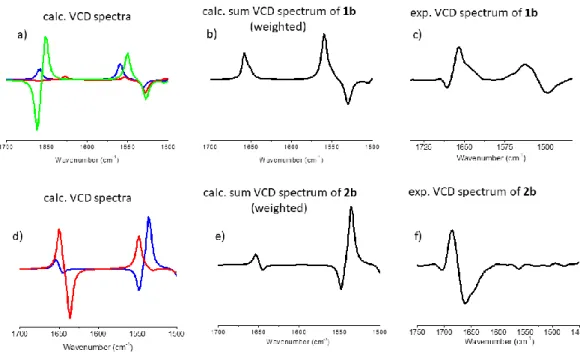
The experimental spectrum, VCDexp(ṽ), of the Xylo-building block (cis-stereoisomer, 2b) (Figure 6/f) has a so called “negative twist” at its amide I region, namely a negative (~1660 cm-1) band is followed by positive (~1685 cm-1) VCD-band. On the other hand, 1b (trans-stereoisomer / Ribo- configuration) has a positive band (~1660 cm-1) with a distinct shoulder (~1640 cm-1) (Figure 6/c). The VCD spectra calculated for the dominant conformers, VCDicalc(ṽ), of 1b and 2b (Table 2) show a
14
significant similarity to their experimental counterparts. However, if fine-tuned with the minor forms, then the Σci*VCDicalc(ṽ) shows an even better agreement with the experimental VCD spectra of both 1b and 2b. (Figure 6).
Figure 6: a and d) The pure VCD-spectra of conformers, VCDicalc(ṽ), calculated both for 1b and 2b (blue:
conf1, red: conf2 and green conf3). b and e) Conformational weights ci used for spectrum reconstruction: Σci*VCDicalc(ṽ), by summing up for 1b: 0.888 of 1b_conf1 + 0.061 of 1b_conf2 + 0.051 of 1b_conf3. Similarly for 2b summation was completed as follows: 0.999 of 2b_conf1 + 0.001 of 2b_conf2. c and f) experimental VCD spectra.
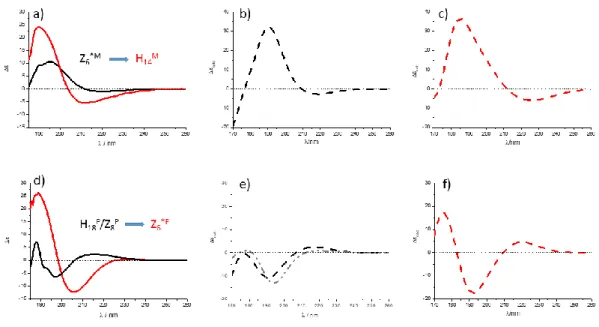
The last and perhaps the most important question that remains is whether this approach can also be used to assign ECD-spectra as well? In other words, is the ECD spectral change measured between 1a (Figure 7/a black) and 1b (Figure 7/a red) indeed associated with the backbone conformer change of Z6*M to H14M? Similarly, the question is whether the difference measured between 2a (black) and 2b arises from the H18P/Z8P to Z6*P backbone amide group reorientation? The subtle difference in the building block constitution (-H → -CH3) induces a net ECD-spectral change which manifest in terms of a distinct bathochromic shift for RibAFU(ip) derivatives (1a1b), while in case of XylAFU(ip) (2a2b) a large difference in shape and intensity (cis, [3R,4S]) is measured(Figure 7).
15
Figure 7. ECDexp(λ) of a) 1a (black) & 1b (red) and d) 2a (black) & 2b (red) recorded in MeOH. Building block conformer shifts due to N-methylation is expressed in terms of conformational codes. b, c, e and f) conformational weights ci used for spectrum reconstruction: Σci*ECDicalc(λ), by summing up for b) 1a:
0.982 of 1a_conf1 + 0.018 of 1a_conf2; c) 1b: 0.888 of 1b_conf1 + 0.061 of 1b_conf2 + 0.051 of 1b_conf3; e) 2a: 0.958 of 2a_conf1 + 0.022 of 2a_conf2 + 0.020 of 2a_conf3. In the case of the grey spectrum the summation was performed by using 0.4 of 2a_conf1 + 0.6 of 2a_conf3; f) 2b: 0.999 of 2b_conf1 + 0.001 of 2b_conf2. Note that the overall shapes of ECDexp(λ) of models in MeOH (commonly used solvent) and MeCN are similar, bend intensities are different only.
The spectral similarity between ECDexp(λ) and Σci*ECDicalc(λ) (Figure 7) is satisfactory especially, if we consider all the existing theoretical challenges of ECD-spectrum ab initio calculations. For ECD we need to compute the ground and excited states of each electronic transition to successfully determine their transition energy. The widely used method is the time-dependent density functional theory (TD- DFT) in combination with the use of higher level of basis set (e.g. 6-311+Gd,p), as the calculation of the excited state is more sensitive to basis set issues than those of the ground state.[36] The wise combination of two chiroptical methods (ECD-ORD, ECD-VCD) may solve this problem, as it seems that conformer types, relative weights and spectral properties (VCD and ECD) are calculated at an acceptable similarity.[37-40]
16
Figure 8. All possible backbone conformers of the current foldamer building block, 1a, 1b, 2a and 2b, and their pure ECD spectra, as calculated at B3LYP/6-311+G(d,p) level of theory: ECDicalc(λ). Red and black marks stand for the location of a conformer on the (φ, ψ) subspace of the conformational hypercube (φ, Θ, ψ).
17 Conclusion:
In conclusion, we found that it is possible describe the conformational state of flexible building blocks (e.g. for β-amino acid residues) in terms of major backbone conformers by selecting the key structures via MDCA & MCMM refined by ab initio conformer optimization (e.g. B3LYP/6-311+G(d,p)).
These conformers (conf1, conf2,..confn) and their relative weights (ci) were successfully cross validated by calculating for each of them the associated VCD-spectra, VCDicalc(ṽ), and comparing their weighted sum, Σci*VCDicalc(ṽ), to their experimental counterpart: VCDexp(ṽ). We found, that the attractive H-bond replaced by steric hindrance shifts the second amide plane, ψ torsion, successfully monitored both by VCD and ECD spectral changes. The above conformational shift expressed in terms of conformer type changes (Z6*M → H14M and H18P/Z8P → Z6*P) can be assigned to the ECD spectrum variation observed. In this way we have assigned the pure ECD spectra, at least semi-quantitatively to all the different backbone conformers. The associated pure ECD spectrum was determined for 8 different backbone structures, namely for 4 zig-zag (Z8P, Z6M, Z6*M, Z6*P) and 4 helical (H14M , H18P, H18M, H12P) (Figure 8).
One of the most basic concepts of foldamer chemistry is that by simply controlling the stereochemistry of the building blocks, oligomers of designed, well defined and stable secondary structure can be built.[41] However, ECD properties of the building blocks are neither that strict, nor that simple, as any change in the amide plane orientation during secondary structure build up might shift or reshape the spectrum. Our results demonstrate that such changes are to be expected when monomers start building oligomers and - for example - intramolecular H-bonds are exchanged for more ideally oriented inter-monomer interactions - similarly to the effect of N-methylation in our example - and might lead to the evolution of unexpected secondary structural changes. Thus the question of
“how sensitive ECD spectroscopy is to backbone changes of polyamides” holds and can be answered.
The present models show that it’s impossible to predict the spectrum based solely on the absolute configuration of the monomeric unit. However, different amide plane orientations coupled to spectral changes, either of modest (Z6*M → H14M) or large scale (H18P/Z8P → Z6*P) (Figure 7a and d) can nicely be tracked by ECD spectroscopy. Using the currently introduced method it is possible to complete secondary structure assignment of foldamers, chimera etc. composed of either common (α-) and/or non-proteinogenic amino acid residues of a given length.
Acknowledgements These research projects were supported by the European Union and the State of Hungary and co-financed by the European Regional Development Fund (VEKOP-2.3.2-16-2017-00014).
This paper was supported by the János Bolyai Research Scholarship of the Hungarian Academy of Sciences (V. Farkas) and by the grant of the Hungarian Scientific Research Fund (OTKA K116305).
18 Methods
Computational details
Conformational mapping was performed with Monte Carlo Multiple Minimum (MCMM) search with the OPLSA force field as implemented in the Schrödinger software. The obtained structures were then optimized with the DFT method B3LYP/6-311G**+(Gaussian 09 software).
Calculation of ECD spectra were completed by using the time-dependent TD-DFT method at B3LYP/6- 311G**+ level of theory, combined with the IEF-PCM solvent model for methanol. To simulate VCD spectra, harmonic vibrational frequencies and rotational strengths were calculated at the B3LYP/6- 311G**+ level of theory, combined with IEF-PCM solvent model for acetonitrile as well.
In the case of simulation of ECD and VCD spectra, results were obtained by summing the calculated spectra of individual conformers multiplied by their calculated populations at room temperature based on the Boltzmann distribution (Table1 and 2).
Spectroscopic measurements
The ECD spectra were recorded on Jasco J-810 spectro-polarimeter at room temperature in a 0.02 cm quartz cell. The sample concentration was 1 mg/ml, methanol (MeOH, Uvasol, Merck, Darmstadt, Germany) was used as solvent. All spectra were recorded between 185–260 nm. The resulting spectra were background corrected and smoothed by using the Means-Movement algorithm. The ECD values are given in Δε (dm3 mol-1 cm-1).
All VCD spectra were recorded in acetonitrinle-d3 (MeCN-d3) with a Bruker PMA 37 VCD/PM-IRRAS module connected to an Equinox 55 FT-IR spectrometer at a resolution of 4 cm–1. The ZnSe photoelastic modulator of the instrument was set to 1600 cm–1, and an optical filter with a transmission range of 1960–1250 cm–1 was used in order to increase the sensitivity in the amide spectral region. The instrument was calibrated for VCD intensity with a CdS multiple-wave plate. A CaF2 cell of 0.2 mm path length was used. In order to improve the S/N-ratio, spectra were averaged for 5 h (corresponding to ca. 17500 accumulated interferograms). Baseline correction was achieved by subtracting the spectrum of the solvent obtained under the same conditions.
Synthesis of 1a, 1b, 2a and 2b
1,2:5,6-di-O-isopropylidene-α-D-allofuranose
19
To a stirred solution of oxalyl chloride (15 ml, 171.51 mmol) in dry CH2Cl2 (210 ml) at -80 °C was added methyl sulfoxide (24.51 ml, 345.75 mmol) dissolved in dry CH2Cl2 (60 mL) dropwise. The reaction mixture was stirred for additional 15 min, and 1,2:5,6-di-O-isopropylidene-α-D-glucofuranose (15 g, 57.6 mmol) dissolved in dry CH2Cl2 (450 mL) was also added dropwise. The mixture was allowed to react for 90 min at -80 °C and then triethylamine (60.6 ml, 433.8 mmol) was added dropwise maintaining the temperature at -70 °C. Finally, the reaction was quenched by adding NaBH4 (4.35 g, 116.25 mmol) dissolved in a mixture of EtOH/H2O 4:1 (300 ml). The temperature of the reaction mixture should keep within -60 to -40 °C. The reaction mixture was extracted with CH2Cl2 (3 × 100 ml), dried over Na2SO4 and concentrated in vacuum. The crude product was crystallized from cyclohexane to give white solid (12 g; 80 %). Mp: 74-76 °C; mp [Sigma Aldrich] 73-76 °C.
Final steps to produce diamide models:
N,N-Dimethyl-1,2-O-isopropylidene-3-azido-3-deoxy-α-D-ribofuranuronamide
1,2-O-isopropylidene-3-azido-3-deoxy-α-D-ribofuranuronic acid (0.337 g, 1.47 mmol) was dissolved in dry THF (5.25 ml) and cooled at -15 °C. Triethylamine (270 µl) and isobutyl chloroformate (250 µl) were dropped to the solution and stirred. The temperature was kept between -10 - -15 °C. (Solution I.) Dimethylamine in THF (2M, 5.5 ml) included TEA (270 µl) (Solution II.) was cooled at 0 °C and added to the solution I. after 20 minutes. The reaction mixture was stirred for an hour between -10 - 15 °C and even an hour at 0 °C, then pH was checked (pH 7-8). The precipitate (TEA.HCl) was filtered, washed with cool THF. The solvent was removed, the residue was dissolved in EtOAc (20 ml) and extracted with cool distilled water (2x10 ml), HCl solution (2N, 2x10 ml), saturated solution of NaHCO3 (2x10 ml) and brine (2x10 ml). The organic phase was dried (MgSO4) and concentrated in vacuum. The crude product was isolated and purified by column chromatography (eluent: hexane - EtOAc 1:2) to give colorless oil (0.164 g, 44 %). Rf = 0.57 (EtOAc - hexane 2:1); ESI-MS (m/z): [M+H]: 257.3; calculated [M]:
256.3. 1H NMR (CDCl3, 250 MHz): δ 5.76 (d, 1H, H-1), 4.66 (t, 1H, H-2), 4.53 (d, 1H, H-4), 4.17 (dd, 1H, H-3), 3.07 (s, 3H, amide-CH3), 2.94 (s, 3H, amide-CH3), 1.52 (s, 3H, CH3), 1.30 (s, 3H, CH3) ppm.
N,N-Dimethyl-1,2-O-isopropylidene-3-azido-3-deoxy-α-D-xylofuranuronamide
From 1,2-O-isopropylidene-3-azido-3-deoxy-α-D-xylofuranuronic acid (0.4 g, 1.75 mmol) the reaction was analogue to the reaction of the ribo-derivative. The product was colorless oil (0.21 g, 48 %). Rf = 0.55 (EtOAc:hexane 2:1); ESI-MS (m/z): [M+H] 257.2; calculated [M]: 256.3. 1H NMR (CDCl3, 250 MHz):
δ 5.27 (d, 1H, H-1); 4.92 (d, 1H, H-4); 4.59 (d, 1H, H-2); 3.44 and 3.28 (s, 6H, amide-CH3); 3.2 (d, 1H, H- 3); 1.8 and 1.63 (s, 6H, isopropylidene CH3) ppm.
20
N,N-Dimethyl-1,2-O-isopropylidene-3-amino-3-deoxy-α-D-ribofuranuronamide
N,N-Dimethyl-1,2-O-isopropylidene-3-azido-3-deoxy-α-D-ribofuranuronamide (0.201 g, 0.79 mmol) was dissolved in methanol (22 ml). The starting material was reduced with H2 on 10 % Pd/C by H-Cube (parameters: 55 °C; 10 bar; 0.2 ml/min). After the reaction, the solution was concentrated in vacuo to give colorless oil as product (0.157 g, 87 %). Rf = 0.74 (chloroform - methanol 3:1). The free amino group was detected with ninhydrin test and transformed without further analysis.
N,N-Dimethyl-1,2-O-isopropylidene-3-amino-3-deoxy-α-D-xylofuranuronamide
From N,N-Dimethyl-1,2-O-isopropylidene-3-azido-3-deoxy-α-D-xylofuranuronamide (0.2 g, 0.79 mmol) the reaction was analogue to the reaction of the ribo-derivative. The product was colorless oil (0.15 g, 85 %). Rf = 0.72 (chloroform - methanol 3:1). The free amino group was detected with ninhydrin test and transformed without further analysis.
N,N-Dimethyl-1,2-O-isopropylidene-3-acetamido-3-deoxy-α-D-ribofuranuronamide
N,N-Dimethyl-1,2-O-isopropylidene-3-amino-3-deoxy-α-D-ribofuranuronamide (0.157 g, 0.68 mmol) was dissolved in cooled mixture of pyridine (0.80 ml) and acetic anhydride (0.48 ml). The reaction mixture was allow to stand at 0 °C for 2 days. The solution was dropped to water-ice mixture (50 ml) and concentrated in vacuum. The crude product was recrystallized from ethyl acetate – petroleum ether to give white solid (0.113 g, 61%). Rf: 0.45 (ethyl-acetate – methanol 4:1). ESI-MS (m/z): [M+H]:
273.3; calculated [M]: 272.3. 1H NMR (CDCl3, 700 MHz): δ 5.94 (d, 1H, H-1), 4.72 (broad m, 2H, H-2, H- 3), 4.58 (d, 1H, H-4), 3.10 (s, 3H, methylamide CH3), 2.97 (s, 3H, amide-CH3), 2.03 (s, 3H, acetamide CH3), 1.58 (s, 3H, isopropylidene CH3), 1.37 (s, 3H, isopropylidene CH3) ppm.
N,N-Dimethyl-1,2-O-isopropylidene-3-acetamido-3-deoxy-α-D-xylofuranuronamide
From N,N-Dimethyl-1,2-O-isopropylidene-3-amino-3-deoxy-α-D-xylofuranuronamide (0.15 g, 0.65 mmol) the reaction was analogue to the reaction of the ribo-derivative. The product was white solid (0.177 g, 55%). Rf: 0.43 (ethyl-acetate – methanol 4:1). ESI-MS (m/z): [M+H]: 273.3; calculated [M]:
272.3. 1H NMR (CDCl3, 250 MHz): δ 5.97 (d, 1H, H-1); 4.96 (d, 1H, H-4); 4.61 (d, 1H, H-2); 4.5 (m, 1H, H- 3); 3.62 (d, 1H, H3); 2.96 and 2.81 (s, 6H, amide-CH3); 1.81 (s, 3H, acetamide CH3); 1.4 (s, 3H, isopropylidene CH3); 1.18 (s, 3H, isopropylidene CH3) ppm.
21 References
[1] Foldamers: Structure, Properties, and Applications (eds.: S. Hecht, I. Huc) WILEY-VCH Verlag GmbH
& Co. KGaA, Weinheim, 2007
[2] B. F. Fisher, S. H. Gellman, J. Am. Chem. Soc. 2016, 138, 10766-10769
[3] A. Perczel, J.G. Ángyán, M. Kajtár, W. Viviani, J.-L. Rivail, J.-F. Marcoccia, I.G. Csizmadia, J. Am. Chem.
Soc. 1991, 113, 6256-6265
[4] T. Beke, Cs. Somlai, A. Perczel, J. Comput. Chem. 2006, 27, 20-38
[5] R.P. Cheng, S.H. Gellman, W.F. DeGrado, Chem. Rev. 2001, 101, 3219-3232 [6] D. S. Kemp, Helv. Chim. Acta 2002, 85, 4392-4423
[7] R. W. Woody in The Peptides, Volume 7 (ed.: V. J. Hruby) pp. 15-114, Academic Press, New York, 1985
[8] A. Perczel, M. Hollósi in Circular Dichroism and the Conformational Analysis of Biomolecules (ed.:
G. D. Fasman) pp. 285-380, Plenum Press, New York, 1996
[9] D. Seebach, J. V. Schreiber, S. Abele, X. Daura, W. F. van Gunsteren, Helv. Chim. Acta 2000, 83, 34- 57
[10] D. Seebach, T. Sifferlen, P.A. Mathieu, A.M. Häne, C.M. Krell, D.J. Bierbaum, S. Abele, Helv. Chim.
Acta 2000, 83, 2849-2864
[11] D. H. Appella, L. A. Christianson, D. A. Klein, D. R. Powell, X. Huang, J. J. Barchi Jr., S. H. Gellman, Nature, 1997, 387, 381-384
[12] T. A. Martinek, G. K. Tóth, E. Vass, M. Hollósi, F. Fülöp, Angew. Chem. Int. Ed. 2002, 41, 1718-1721 [13] E. Abraham, C. W. Bailey, T. D. W. Claridge, S. G. Davies, K. B. Ling, B. Odell, T. L. Rees, P. M.
Roberts, A. J. Russell, A. D. Smith, L. J. Smith, H. R. Storr, M. J. Sweet, A. L. Thompson J. E. Thomson, G.
E. Tranter, D. J. Watkin, Tetrahedron: Asymmetry 2010, 21, 1797-1815
[14] A. Glättli, X. Daura, D. Seebach, W. F. van Gunsteren, J. Am. Chem. Soc. 2002, 124, 12972-12978 [15] X. Daura, D. Bakowies, D. Seebach, J. Fleischhauer, W. F. van Gunsteren, P Krüger, Eur Biophys J 2003, 32, 661-670
[16] D. A. Niggli, M.-O. Ebert, Z. Lin, D. Seebach, W. F. van Gunsteren, Chem. Eur. J. 2012, 18, 586- 593 [17] D. Seebach, P.E. Ciceri, M. Overhand, B. Jaun, D. Rigo, L. Oberer, U. Hommel, R. Amstutz, H.
Widmer, Helv. Chim. Acta 1996, 79, 2043-2066
[18] D. Seebach, D. F. Hook, A. Glättli, Biopolymers 2006, 84, 23-37 [19] C. Baldauf, H.-J. Hofmann, Helv. Chim. Acta 2012, 95, 2348-2383
[20] A. Perczel, M. Hollósi, B.M. Foxman, G.D. Fasman, J. Am. Chem. Soc. 1991, 113, 9772–9784
22
[21] M.A. McAllister, A. Perczel, P. Császár, W. Viviani, J.L. Rivail, I.G. Csizmadia, J. Mol. Struct.:
THEOCHEM 1993, 113, 6256-6265
[22] A. Perczel, I. Jákli, B.M. Foxman, G.D. Fasman, Biopolymers 1996, 38, 723-732 [23] T. Beke, I.G. Csizmadia, A. Perczel, J. Comput. Chem. 2004, 25, 285–307
[24] D. K. Menyhárd, I. Hudáky, I. Jákli, Gy. Juhász, A. Perczel, J. Chem. Inf. Model. 2017, 57, 757-768 [25] Vibrational Optical Activity: Principles and Applications (ed.: Laurence A. Nafie) John Wiley & Sons, Ltd, UK, 2011
[26] Comprehensive Chiroptical Spectroscopy (eds.: N. Berova, P.L. Polavarapu, K. Nakanishi, R.W.
Woody) John Wiley & Sons, Inc., New Jersey, 2012
[27] G. V. M. Sharma, K. S. Reddy, S. J. Basha, K. R. Reddy, A. V. S. Sarma, Org. Biomol. Chem. 2011, 9, 8102-8111
[28] J. P. Saludes, J. B. Ames, J. Gervay-Hague J. Am. Chem. Soc. 2009, 131, 5495-5505
[29] I. A. Motorina, C. Huel, E. Quiniou, J. Mispelter, E. Adjadj, D. S. Grierson, J. Am. Chem. Soc. 2001, 123, 8-17
[30] A.G. Giri, G.F. Jogdand, P.R. Rajamohanan, S.K. Pandey, C.V. Ramana, Eur. J. Org. Chem. 2012, 13, 2656-2663
[31] S.K. Pandey, G.F. Jogdand, J.C.A. Oliveira, R.A. Mata, P.R. Rajamohanan, C.V. Ramana, Chem. Eur.
J. 2011, 17, 12946-12954
[32] B. Csordás, A. Nagy, V. Harmat, V. Zsoldos-Mády, I. Leveles, I. Pintér, V. Farkas, A. Perczel, Amino Acids 2016, 48, 2619-2633
[33] C. Bilton, F. H. Allen, G. P. Shields, J. A. K. Howard, Acta Cryst. 2000, B56, 849-856 [34] B. Kuhn, P. Mohr, M. Stahl, J. Med Chem. 2010, 53, 2601-2611
[35] G. V. M. Sharma, P. S. Reddy, D. Chatterjee, A. C. Kunwar, J. Org. Chem. 2011, 76, 1562-1571 [36] D. Jacquemin, V. Wathelet, E.A. Perpete, C. Adamo, J. Chem. Theory Comput. 2009, 5, 2420-2435 [37] P.L. Polavarapu Chirality, 2012, 24, 909-920
[38] S. Ding, A. Kolbanovskiy, A. Durandin, C. Crean, V. Shafirovich, S. Broyde, N.E. Geacintov, Chirality 2009, 21, E231-E241
[39] V.P. Nicu, A. Mándi, T. Kurtán, P.L. Polavarapu Chirality, 2014, 26, 525-531 [40] T. Taniguchi Bull. Chem. Soc. Jpn. 2017, 90, 1005-1016
[41] T. A. Martinek, I. M. Mándity, L. Fülöp, G. K. Tóth, E. Vass, M. Hollósi, E. Forró, F. Fülöp, J. Am.
Chem. Soc. 2006, 128, 13539-13544
23 Supporting Information
1H NMR spectra
N-Methyl-1,2-O-isopropylidene-3-acetamido-3-deoxy-α-D-ribofuranuronamid (1a):
N-Methyl-1,2-O-isopropylidene-3-acetamido-3-deoxy-α-D-xylofuranuronamid (2a):
![Figure 4.: Scaffold of two selected conformers of SAA 1a and 2a with selective NBOs highlighting the intraresidual H-bonds: a) 1a_conf1 (bond [BD, pale blue] of NH and lone pair [LP, pale blue] of O ring , b) and 2a_conf1 (bond [BD, pale blue] of NH and](https://thumb-eu.123doks.com/thumbv2/9dokorg/1075449.72107/12.892.134.760.287.558/figure-scaffold-selected-conformers-selective-nbos-highlighting-intraresidual.webp)