Abstract
Honey is one of the most commonly adulterated product in the food market. The different types of adulterations affect the market negatively, therefore an effective honey evaluation method is required. The electronic tongue could be a new alternative tool for inspection. In this study 78 authentic Hungarian honey samples were analysed with electronic tongue.
The main analytical and physical parameters of honey samples were also determined, with classical analytical methods. Multivariate regression models (PLSR, MLR, SVM) were built to predict the main physicochemical properties of honey based on the results of electronic tongue. Results showed that the merged data of electronic tongue and electrical conductivity provided the best models for the prediction of main physicochemical properties of honey.
Keywords
honey, taste perception, chemometric, antioxidant capacity, polyphenol content
1. Introduction
Honey is a multipurpose natural product with high nutritional value. It has a relatively high price, making it one of the most commonly adulterated products on the food market. Examples of honey adulteration include blending of honeys with sugar syrup, pollen filtration, heating. Food adulteration affects both customers and the beekeepers negatively. Current methods of honey inspection are
primarily based on rather expensive analysis instrumentation (e.g. NMR, LC-IRMS) and skilled operators [1]. Even these methods have their own limitations in terms of detection limit and detection of some types of adulterants. However, there is no efficient rapid technique available to determine the quality of honey, thus evaluation of new methods is strongly required and fully justified. Among the possible alternatives, different physical and analytical parameters, such as antioxidant capacity, polyphenols, ash content, electrical conductivity (EC), etc. have been largely investigated. [2].
Although these simple and fast methods are usually not satisfactory for the clear differentiation of different honeys and their blends, their combination with sensory analyses may offer promising pathways in authentication. The electronic tongue (ET) is a robust sensor based electronic device used to build fingerprints for food products based on their chemical patterns. It has several advantages such as, short analysis time and minimal sample preparation.
There are various studies with promising results on honey investigation with ET, consequently it could be a new honey investigation tool. Major et al. (2011) [3] showed that ET combined with artificial neural networks (ANN) is a reliable tool for geographical discrimination of honey samples. In another study, voltametric and potentiometric ETs were compared to classify honey samples based on floral and geographical origin [4]. They utilized Principal Component Analysis (PCA) and Discriminant Analysis (DA) methods for this purpose and achieved 100% correct classification. According to Dias et al. (2015) [5], floral origin classification
HUNGARIAN AGRICULTURAL ENGINEERING N° 32/2017 38-43
Published online: http://hae-journals.org/
HU ISSN 0864-7410 (Print) / HU ISSN 2415-9751(Online) DOI: 10.17676/HAE.2017.32.38
PREDICTION OF MAIN ANALYTICAL AND PHYSICAL PARAMETERS OF HONEY WITH ELECTRONIC TONGUE
Author(s):
F. A. Koncz1– Zs. Bodor2– T. Kaszab1– I. Kertész1– J. L. Z. Zaukuu1– Cs. Benedek2– Z. Gillay1– Z. Kovacs1 Affiliation:
1Department of Physics and Control, Szent István University, Somlói út 14-16., Budapest, H-1118, Hungary
2Department of Dietetics and Nutrition, Faculty of Health Sciences, Semmelweis University, Vas u. 17., H-1088 Budapest, Hungary
Email address:
konczfanni54@gmail.com, kaszab.timea@etk.szie.hu, kertesz.istvan@etk.szie.hu, zaukuu.john-
lewis.zinia@hallgato.uni-szie.hu, benedek.csilla@se-etk.hu, gillay.zoltan@etk.szie.hu, kovacs.zoltan3@etk.szie.hu PERIODICAL OF THE COMITTEE OF
AGRICULTURAL AND BIOSYSTEM ENGINEERING OF
THE HUNGARIAN ACADEMY OF SCIENCES and
SZENT ISTVÁN UNIVERSITY Faculty of Mechanical Engineering Received: 2017.10.19. - Accepted: 2017.12.15.
using the ET yielded 92% and 100% correct classification for monofloral and polyfloral honeys, respectively. This was in combination with multiple linear regression (MLR), and the successful assessment of ratio of the main pollens in the samples (R2=0.92) [5]. Thus, the ET proved to be more reliable than the Pollen analysis (melissopalynology), a common but very tedious method of honey origin determination. To clearly define honey quality however, there is a need to match these floral origin classifications with the main characteristics of the honey, especially in Hungary, where honeys have never been analyzed with the ET. From preliminary studies, ET measurements analyzed with different multivariate statistical methods (PCA and LDA) showed the applicability of ET for geographical and floral origin identification, giving the rise to use electronic tongue for determination of main analytical and physical parameters of honey samples. The objective of this work therefore, was to build models based on the results of ET for rapid prediction of main analytical and physical parameters of honey samples.
2. Materials and methods Research design and sampling
Honey samples (78) were analyzed from different floral and geographical origins, focusing mainly on authentic Hungarian products. Most of the samples were collected directly from beekeepers and aseptically stored during the analysis, to ensure quality preservation. Commercial honeys, and samples collected from other countries were also analyzed, to compare them with Hungarian honeys.
Standard methods were used to determine relevant parameters of the honey samples as described below.
Determination of the physico-chemical properties Ash Content. Honey (3-7 g) was measured in a porcelain jar and two drops of olive oil were given to each jar. The samples were first pre-combusted on flame, then kept in an electric furnace at 600°C for four hours. After that the samples were put in a desiccator and the ash content was calculated [6].
Total polyphenol content and antioxidant capacities.
Honey (1 g) was measured into a beaker, dissolved in water, then integrally transferred to a 10 ml volumetric flask. The flask was made up to volume with distilled water. This stock solution was used for each antioxidant method.
Total Polyphenol Content (TPC).
The Total Polyphenol Content was determined by the Folin-Ciocalteu colorimetric method, which is based on the oxidation of phenolic compounds in honey.
Briefly, 1ml of the honey stock solution was put in a test tube, then 7,.5 ml distilled water was added, followed by 0,.5 ml of the Folin–Ciocalteu reagent and - after 3 minutes - 1 ml Na2CO3solution was also added. After 30 minutes of incubation at room temperature the solution was measured at 750 nm with a Helios ɑ-spectrophotometer. Gallic acid was used as standard [7].
CUPRAC (Cupric Ion Reducing Antioxidant Capacity) assay.
The procedure based on reduction of Cu2+ ions was developed by Apak et al. (2007) [8]. For the measurements, 200 µl honey stock solution was mixed with 1 ml of CuCl2, 1 ml of NH4-acetate puffer solution (pH=7.4), and 0.9 ml distilled water.
After 30 minutes of incubation, the samples were measured at 450 nm spectrophotometrically.
ABTS assay
The method is based on the spectrophotometrical monitoring at 734 nm of the scavenging of the ABTS·+ (2,2′-azino-bis (3-ethylbenzothiazoline-6- sulfonic acid) radical cation by the antioxidant compounds of the sample. 0.1 ml of the sample solution was put in a test tube and 3.9 ml ABTS reagent was given. Then it was incubated for 12 minutes in dark before the measurement. Trolox was used as standard [9].
Ferric Reducing Antioxidant Power (FRAP).
Honey stock solutions (500 µl) were mixed with previously prepared 7.5 ml FRAP reagent solution, according to literature. After an hour incubation at 37°C the solution was measured photometrically at 593 nm, using ascorbic acid as standard [10].
Measurement with electronic tongue
An αAstree electronic tongue (ET) (AlphaM.O.S., 2003) was used to determine the taste pattern of the honey samples after calibration and conditioning (according to the manufacturers direction). The instrument is able to recognize and analyze the compounds in liquid samples and includes an Ag/AgCl reference electrode, with seven potentiometric sensors developed for food analysis. For ET measurements 10 grams of honey sample was measured and diluted in a
100 ml volumetric flask with distilled water. The tests were done at room temperature.
Statistical analysis
Multivariate statistical methods were applied to evaluate the result of the ET measurements. Principle component analysis (PCA) [11] was used to describe multidimensional patterns of the ET dataset and to discover outliers. Quantitative models were built using partial least squares regression (PLSR) [12], multiple linear regression (MLR) [13] and support vector machine regression (SVM) [14] for the prediction of the physicochemical properties using the data of electronic tongue, pH and EC. The quantitative models were validated using one sample- out cross-validation and the models were evaluated by comparing the determination coefficients (R2) and root mean square errors (RMSE) of calibration and cross-validation. The statistical analysis was performed with Matlab (v. Matlab 2016a 64-bit).
Graphs made for the comparison of the different models were prepared using Microsoft Excel (Microsoft Corporation, USA).
3. Results and discussion
Results of the regression models built based on the results of electronic tongue
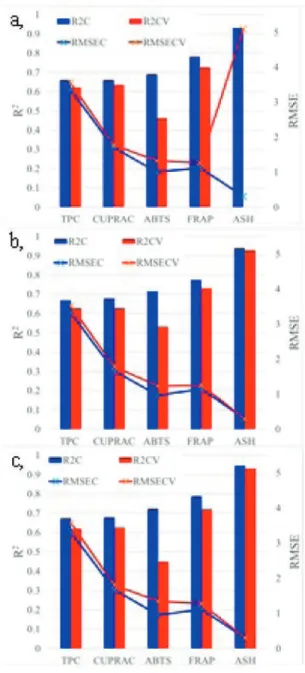
Results of the regression models built for the prediction of the tested physicochemical properties of the honey samples using the data of ET is summarized in Figure 1. Models calculated with the SVM method showed the worst results (Figure 1. a,). In spite of using SVM there was no model achieved for the prediction of ash content, PLSR and MLR however, showed the best accuracy for ash content determination followed by FRAP and ABTS (Figure 1. b, and c,). All the three methods showed the lowest R2 for TPC and CUPRAC.
Common problems such as drifts, non-idealities or interferences are often present in measurements with sensor based instruments such as electronic tongue especially in case of long term experiments [15]. In this study, mathematical drift correction was applied which resulted in slight improvements of the prediction models. Further improvement of the models were observed when fused data of EC, pH and ET were used.
Results of the regression models built based on the fused data of electronic tongue electrical
conductivity and pH
Generally, models built based on the fused data of ET and EC resulted in significantly more accurate models (Figure 2) compared to those built based on the ET
results alone (Figure 1). The organic acids and mineral salts in honey are ionizable in solution with a property to conduct electric [16], affecting the electrical properties of the samples. The addition of the results of pH did not provide significantly better models probably because ET often shows high correlation with pH. Most noticeable improvement was found for the prediction of the ash content. This may be due to the linear relationship between ash and EC. Better accuracy was observed for all the tested physico- chemical properties of the honey with all the three antioxidant methods, except for ABTS (Figure 2).
There was no reliable model for the ash content with SVM. Irrespective of the high determination coefficient observed during the model building, the testing of the model failed using the one-sample-out cross-validation (Figure 2. a,).
Figure 1. Performance summaries of a, SVM, b, PLSR, c, MLR calibration models and leave-one-
sample-out cross-validation fitted on the different physicochemical parameters of the honey samples using the data of electronic tongue (calibration: blue
and cross-validation: red). R2=determination coefficient; RMSE=root mean square error;
C=calibration; CV=one-sample-out cross-validation.
RMSE values of CUPRAC and FRAP are divided by 10, ABTS is divided by 100, ASH is multiplied by 10
for better visualization.
Figure 2. Performance summaries of a, SVM, b PLSR, c, MLR calibration models and leave-one- sample-out cross-validation fitted on the different physicochemical parameters of the honey samples using the fused data of electronic tongue (after drift
correction) and EC (calibration: blue and cross- validation: red). R2=determination coefficient;
RMSE=root mean square error; C=calibration;
CV=one-sample-out cross-validation. RMSE values
of CUPRAC and FRAP are divided by 10, ABTS is divided by 100, ASH is multiplied by 10 for better
visualization.
Although more accurate models could be built for the prediction of the tested parameters using the combined data of electronic tongue after drift correction and data of EC, the prediction of some parameters still did not achieve satisfactory accuracy.
Furthermore, results of the regression models showed a different trend of the fitting of the predicted data points in the higher range compared to the lower one.
Therefore, separate models were built for honey samples with high ash content (Table 1) and those having low ash content (Table 2).
Performance summary of the best models found for the prediction of the tested physico-chemical parameters of the honey samples with higher ash content is provided in Table 1. Better accuracy was reached when only the data of honey samples with higher ash content was used for modelling, compared to results found for all the samples (Figure 2).
Table 1. Performance summaries calibration models and leave-one-sample-out cross-validation of the best
models fitted on the different physicochemical parameters of the honey samples containing high ash
content (0.321%-0.918%)) using the fused data of electronic tongue (after drift correction) and EC.
R2=determination coefficient; RMSE=root mean square error; C=calibration; CV=one-sample-out
cross-validation.
Results of the models built based on the data of honey samples with lower ash content is summarized in Table 2 showing weaker results than those in Table 1, especially for ABTS. These results suggest that when honey samples with lower ash content is analyzed with ET we may reach the sensitivity level of the sensors involved in the experiment for the diluted honey samples
Table 2. Performance summaries calibration and CV models of the best models fitted on the different physicochemical parameters of the honey samples
containing low ash content (0.036-0.169%) using the fused data of electronic tongue (after drift correction) and EC. R2=determination coefficient; RMSE=root mean square error; C=calibration; CV=one-sample-
out cross-validation
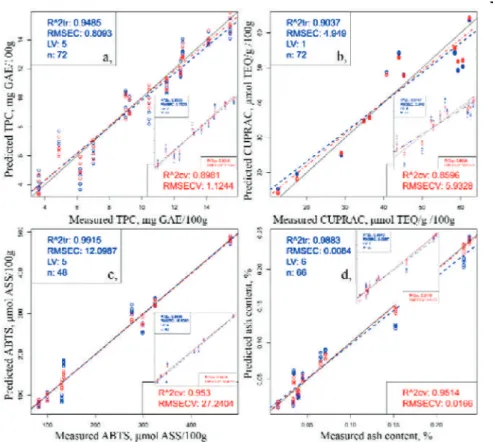
The application of drift correction together with the data of EC resulted in significantly better accuracy models as showed above, therefore, the ability of ET has been tested in an ideal situation, i.e. data of one measurement day was used to build models. Figure 3 shows some selected results when data of one-day experiment is used for modelling. The results showed that, if there is no long-term experiment (i.e. reduced drift), fairly good results can be achieved. Full sized figures show the results of the models built using the fused data of ET and EC while the miniaturized figures show the results of the models built using only data of ET. In this case models built based on only the results of ET provided similar accuracy as the ones built based on the combined data of ET and EC.
Figure 3. Selected PLSR models (based on data of only one-day measurement) on a, total polyphenol content b, Cupric Reducing Antioxidant Capacity c, ABTS d, ash content of the honey samples. Full sized
figure shows the results of fused data of electronic tongue and EC. Miniaturized figure shows results of electronic tongue. Calibration (blue line and points), one-sample-out cross-validation (red line and points.
4. Conclusion
The objective of this work was to build models based on the results of electronic tongue for rapid prediction of main analytical and physical parameters of honey samples. The physicochemical properties of honey samples were determined with classical analytical methods.
Regression models were built to predict the tested analytical properties (total polyphenol content,
antioxidant capacity measured by different assays, ash content) of the honey samples, using the data of electronic tongue and SVM, PLSR, and MLR methods and leave-one-sample-out cross-validation.
The models built based on the raw measurement results of electronic tongue showed weak prediction performance especially for ash content. Drift correction of the electronic tongue measurement results provided some increase in the accuracy of the models. However, significant improvement of the
prediction models were achieved when fusion of the data of electrical conductivity and electronic tongue was applied, especially for ash content determination.
The most reliable solution was found by dividing the samples into two subgroups based on their high or low ash content, when models were more accurate for higher ash levels. Our results showed that application of electronic tongue as a fast, convenient method, with practically no environmental burden, might be a promising tool for predicting main analytical parameters of honey like total polyphenol content, antioxidant capacity and ash content. However, the improvement of long term stability of the electronic tongue results is indispensable for the field applications of this technique.
Acknowledgements
This paper was supported by the János Bolyai Research Scholarship of the Hungarian Academy of Sciences (Zoltan Kovacs). This paper was supported by the ÚNKP-17-2 (Fanni Adrienn Koncz and Zsanett Bodor) and ÚNKP-17-4 (Zoltan Kovacs) New National Excellence Program of the Ministry of Human Capacities.
References
[1] Spiteri M., Jamin E., Thomas F., Rebours A., Lees M., Rogers K. M., Rutledge D. N.: 2015. Fast and global authenticity screening of honey using 1H- NMR profiling. Food Chemistry, Vol. 189, pp. 60-66.
http://dx.doi.org/10.1016/j.foodchem.2014.11.099 [2] Karabagias I. K., Badeka A. V., Kontakos S., Karabournioti S., Kontominas M. G.: 2014.
Botanical discrimination of Greek unifloral honeys with physico-chemical and chemometric analyses.
Food Chemistry, Vol. 165, pp. 181–190.
http://dx.doi.org/10.1016/j.foodchem.2014.05.033 [3] Major N., Markovic K., Krpan M., Saric G., Hruskar M., Vahcic N.: 2011. Rapid honey characterization and botanical classification by an electronic tongue. Talanta, Vol. 85, No. 1, pp. 569- 574. http://dx.doi.org/10.1016/j.talanta.2011.04.025 [4] Zhenbo J. W., Jun W. 2014. Tracing floral and geographical origins of honeys by potentiometric and voltammetric electronic tounge. Computers and Electronics in Agriculture, Vol. 108, No. C, pp. 112- 122. http://dx.doi.org/10.1016/j.compag.2014.07.014 [5] Dias L. G., Veloso A. C. A., Sousa M.E.B.C., Estevinho L., Machado A.A.S.C., Peres A. M.:
2015. A novel approach for honey pollen profile assessment using an. Analytica Chimica Acta, Vol.
900, pp. 36-45.
http://dx.doi.org/10.1016/j.aca.2015.10.014
[6] Bogdanov S., Martin P., Lullmann C.: 2002.
Harmonised methods of the international honey commission. Swiss Bee Research Centre, FAM, Liebefeld.
[7] Singleton V. L., Rossi J. A.: 1965. Colorimetry of total phenolics with phosphomolybdic- phosphotungstic acid reagents. American Jorunal of Enology and Viticulture, Vol. 16, pp. 144-158.
[8] Apak R., Güçlü K., Demirata B., Ozyürek M., Celik S. E., Bektaşoğlu B., Ozyurt D.: 2007.
Comparative evaluation of various total antioxidant capacity assays applied to phenolic compounds with the CUPRAC assay. Molecules, Vol. 12, No. 7, pp.
1496-1547.
[9] Re R., Pellegrini N., Proteggente A., Pannala A., Yang M., Rice-Evans C.: 1999. Antioxidant activity applying an improved ABTS radical cation decolourization assay. Free Radical Biology and Medicine, Vol. 26, No. 9-10, pp. 1231–1237.
http://dx.doi.org/10.1016/S0891-5849(98)00315-3 [10] Benzie, I. F., Strain, J. J.: 1996. The ferric reducing ability of plasma (FRAP) as a measure of
"antioxidant power": the FRAP assay. Anal Biochem, Vol. 239, No. 1, pp. 70-76.
http://dx.doi.org/10.1006/abio.1996.0292
[11] Cowe I. A., McNicol J. W.: 1985. The use of principal components in the analysis of near-infrared spectra. Applied Spectroscopy, Vol. 39, No. 2, pp.
257–266.
[12] Naes T., Isaksson T., Fearn T., Davies T.:2002.
A user friendly guide to multivariate calibration and classification. Chichester, UK: NIR Publications Official methods of analysis Proximate Analysis and Calculations Ash Determination (Ash) - item 51.
Association of Analytical Communities, Gaithersburg, MD, 17th edition, 2006. Reference data: Method 942.05; MIN; ASH
[13] Chatterjee S., A. S. Hadi.: 1986. Influential Observations, High Leverage Points, and Outliers in Linear Regression. Statistical Science, Vol. 1, No. 3, pp. 379–393.
[14] Vapnik V.: 1995. The Nature of Statistical Learning Theory. Springer, New York, pp. 314.
[15] De Marco R., Mackey D.J., Zirino A.: 1997.
Response of the jalpaite membrane copper(II) ion- selective electrode in marine waters. Electroanalysis, Vol. 9, No. 4, pp. 330–334.
http://dx.doi.org/10.1002/elan.1140090414
[16] Kropf U., Jamnik M., Bertoncelj J., Golob T.:
2007. Linear Regression Model of the Ash Mass Fraction and Electrical Conductivity for Slovenian Honey. Food Technology and Biotechnology, Vol. 46, No. 3, 335-340.