Application of RSM Method for the Examination of Diamond Tools
Richárd Horváth
1, Ágota Drégelyi-Kiss
1, Gyula Mátyási
21 Bánki Donát Faculty of Mechanical and Safety Engineering, Óbuda University, Népszínház u. 8, H-1081 Budapest, Hungary, E-mail: horvath.richard@bgk.uni- obuda.hu, dregelyi.agota@bgk.uni-obuda.hu
2 Budapest University of Technology and Economics, Egry József u. 1, H-1111 Budapest, Hungary, matyasi@manuf.bme.hu
Abstract: The aluminium alloys are used by the automotive, aerospace industries increasingly because of their numerous advantageous mechanical and chemical properties.
The cutting of such aluminium alloys is performed with almost exclusively diamond tools.
The most often used work piece materials are the so-called Al-Si and Al-Mg-Si alloys, of which the most widespread are reinforced aluminium-silicon alloys. In the practice of technology planning, the average value of surface roughness and surface height of machined work pieces are as important criteria as geometrical sizes (e.g.: length, diameter tolerance). The authors in this article examine the cutting performance of diamond tools having different edge materials with the help of design of experiment. The correlation between the examined surface roughness and the cutting performance was evaluated;
additionally the optimal cutting parameters were determined.
Keywords: fine turning; design of experiment; response surface method; aluminium alloy;
surface roughness measurement; optimal cutting parameter
1 Introduction
Surface roughness measurements are essential in the characterization of the features of a machined surface. To examine the effects of cutting parameters on surface roughness thoroughly, a huge number of experiments are needed, depending on the number of input parameters. By utilizing the method of design of experiments (DoE), the number of experiments can be reduced in such a way that the effects of parameters could be assessed appropriately. If the linear effects (correspondences) of cutting parameters are considered, then fractional factorial design is sufficient, but to examine the quadratic terms, RSM method has to be applied [1].
DoEs are often applied in cutting research. Aouchi et al. [2] and Noordin et al. [3]
examined hard turning with a CBN and hard metal tool and evaluated surface roughness with the help of DoE. Asiltürk et al. [4] examined stainless steel turning with coated hard metal tools. Dry, wet, and MQL turning was examined with the help of DoE by Young Kug Hwang [5]. Harničárová et al. studied the topography of laser-cut surfaces [6]. Lazarevic et al. examined the surface roughness of engineering polymers by using Taguchi method [7]. In this study, cutting parameters and surface roughness parameters were correlated to determine the relationship between them in case of aluminium fine turning. Our goal was to establish a mathematical model that can be easily used in technology planning to estimate the expected values of surface roughness. In this paper, using a statistical approach, the dependence of the Ra and Rz parameters on cutting parameters will be analysed, and additionally, the optimal cutting parameters will predicted.
2 Materials and Methods
2.1 Workpiece and Tool Materials
Turning experiments were performed in dry conditions using CNC lathe type NCT EUROTURN 12B, with 7 kW spindle power and 6000 1/min rotation speed. The workpiece material was AS17, frequently used in automotive, aerospace and defence industries. The chemical composition (in wt.%) is: 74.35% Al; 20.03% Si, 4.57% Cu; and 1.06% Fe. The hardness of the workpiece was 114 HB2.5/62.5/30. The examined part was a cylinder with a diameter of 110 mm. The experimental runs were made every 10 mm.
The standard designation of the tools selected was DCGW 11T304 FN with ISO geometry (MDC, PCD, CVD-D) and they were manufactured by TiroTool (PCD, CVD-D) and WNT (MDC). The holder of the tool was codified as SDJCR 1616H 11. The average surface roughness values (Ra) and roughness heights (Rz) were measured by a Mitutoyo SJ-301 surface roughness tester. Parameters related to surface roughness measurements were: l=4 mm, λc=0.8, N=5. The measurements were repeated three times at three reference lines equally positioned at 120° and the results presented were the average of the measured values.
2.2 Design of Experiments
Response surface methodology (RSM) is a procedure which is able to determine a relationship between independent input process parameters (e.g. cutting parameters) and output data (process response, Y, in our case Ra, Rz). In current study the phenomenological relationship between the input, called the cutting parameters (cutting speed (vc, m/min), feed rate (f, mm), depth of cut (a, mm), and the output, machinability parameters (Y=Ra, Rz) was given in the form
Y= Ω(vc, f, a) (1) where Ω is the so-called response function. For the estimation of ouput parameter Y, we used the following equation including the linear and quadratic terms of input parameters, and their interactions:
a f b a v b f v b a b
f b v b a b f b v b b Y
c c
c c
23 13
12 2 33
2 22 2 11 3 2 1 0
(2)
In the above formula, b0, bi and bij are the calculated coefficients, vc, f and a are the input parameters, and ε is the experimental error. In the course of design of experiments the response surface method was chosen, namely a central composite design (CCD). The CCD was performed by taking into account three controllable factors, like cutting speed (vc), feed rate (f) and depth of cut (a). Each factor had 5 different levels. The number of experimental runs was 16, in which two trials were examined in the centre of the design (15(C) and 16(C) points). The design layout is given in Table 1.
Table 1
Design of experiments with the levels of factors central composite design
Runs vc f a
1 -1 -1 -1
2 -1 -1 1
3 -1 1 -1
4 -1 1 1
5 1 -1 -1
6 1 -1 1
7 1 1 -1
8 1 1 1
9 -1.28719 0 0
10 1.28719 0 0
11 0 -1.28719 0
12 0 1.28719 0
13 0 0 -1.28719
14 0 0 1.28719
15 (C) 0 0 0
16 (C) 0 0 0
It is advisable to set the studied cutting parameters in order to represent the values used by industries currently, and so that they should meet the requirement of high speed cutting (HSC) applications, as well. Based on these considerations the selected setting values of the cutting parameters are summarized in Table 2.
Table 2
The setting values of the cutting parameters Factor level vc, m/min f, mm a, mm
-1.28719 500 0.05 0.2
-1 667 0.058 0.267
0 1250 0.085 0.5
1 1833 0.112 0.733
1.28719 2000 0.12 0.8
3 Results and Discussion
The results of the series of experiments (Ra and Rz individual values) for different tools are demonstrated in Fig. 1 and Fig. 2. As can be seen, that the scatter Ra and Rz among work pieces machined by different tools is smaller that the difference between each tools. It is clear that there are such experimental runs (e.g.: 4, 8, 11), when the different surface roughness values of work pieces machined by different tools are clearly separated from each other.
Analysis of variance (ANOVA) was applied to determine the effects of input parameters on the cutting process. First of all the behaviour of individual tools was examined one by one, and the validity of the mathematical model (represented by Eq. 2) was analysed by the response surface method (RSM).
16 15 14 13 12 11 10 9 8 7 6 5 4 3 2 1 2.5
2.0
1.5
1.0
0.5
0.0
Experimental runs
Ra, µm
CVD-D MDC PCD material Tool
Figure 1
The values of average surface roughness (Ra) obtained by the examined tools
16 15 14 13 12 11 10 9 8 7 6 5 4 3 2 1 10
9 8 7 6 5 4 3 2 1 0
Experimental runs
Rz, µm
CVD-D MDC PCD material Tool
Figure 2
The values of roughness heights (Rz) obtained by the examined tools
As a result it was found that several factors and interactions are significant and some parameters could be neglected. The results of significance test are summarized in Table 3.
Table 3
Table of significant coefficients (x - significant, o – no significant) vc f a vc2
f2 a2 vc·f vc·a f·a
RaMDC x x x o x o o o x
RzMDC x x x o x o o o x
RaPCD x x x x x o x o o
RzPCD x x x x x o o o o
RaCVD x x x o x x x o x
RzCVD x x x o o x x o x
As can be seen, during the whole examination performed within the specified range of input parameters, the vc·a interaction is never significant. In order to pool the various influences of non-significant factors, reduced mathematical models were developed.
The reduced models corresponding to the different tools and surface roughness parameters (together with the R2 values characterizing the goodness of fit) are represented by the following equations:
a f f
a
f v
RaMDC c
698 . 25 86
. 426 688
. 1
599 . 66 10
644 . 6 943 . 2
2 5
(3)
R2 = 92.71%
f v f
v a
f v
Ra
c c
c PCD
005 . 0 926 . 327 10
946 . 4 113 . 0
716 . 53 10
449 . 7 182 . 2
2 2
7 4
(4) R2 = 73.7%
a f f
v a
f
a f
v Ra
c c CVD
385 . 12 0035
. 0 862 . 1 206 . 102
166 . 1 023 . 5 10
298 . 2 012 . 0
2 2
4
(5) R2 = 89.84%
a f f
a
f v
RzMDC c
35 . 69 18
. 1339 74
. 3
3 . 181 10
293 . 2 85 . 8
2 5
(6)
R2 = 91.02%
2 2
6 3
02 . 1633 10
537 . 1 88 . 0
08 . 253 10
935 . 3 87 . 10
f v
a
f v
Rz
c c PCD
(7) R2 = 63.43%
a f f
v a
a f
v Rz
c c CVD
106 . 65 0177
. 0 414 . 9
1536 . 6 229 . 49 0013 . 0 105 . 2
2
(8) R2 = 88.66%
With the above equations (from Eq. 3 to Eq. 8) the surface roughness values (Ra and Rz) obtained by individual tools can be easily predicted from the cutting parameters to be set (within the range of the input parameters examined).
To calculate the surface roughness produced by tools having different edge materials a united (combined) statistical model was developed, by which simpler, well-working equations can be obtained. (See Eq. 9, and Eq. 10). In these equations as a novel variable, the type of edge materials (TM) was also inserted.
The values TM to be substituted are either 1, 2 or 3 depending on the type of edge materials selected, namely: 1 – PCD, 2 – CVD-D and 3 – MDC. As a result of computations, the following formulas are obtained:
a f a
TM f
TM f
v
a f
v TM
Ra
c
c
092 . 13 191
. 0 05
. 5 93 . 285 10
723 . 1
174 . 1 363 . 51 10
32 . 4 476 . 0 739 . 2
2 2
7
4 (9)
R2 = 81.43%
a f f
TM f
a
f v
TM
Rz c
391 . 45 252
. 28 12
. 1032 088
. 2
566 . 199 10
838 . 2 241 . 2 622 . 12
2
5 (10)
R2 = 78.37%
Equations 9 and 10 are demonstrated in Fig. 4 and Fig. 5. For the 3 different edge materials (denoted by 1,2, and 3), these diagrams show the change of surface roughness (Ra and Rz) as a function of cutting speed (vc) and feed (f) with constant depth of cut (a = 0,5 mm). From the figures it can be concluded that the surface roughness values obtained by the tool denoted by 1 (PCD) are found in a thinner range (it is less sensitive to changes of cutting parameters), than that of the other two tools examined.
Figure 4
The expected average surface roughness (Ra) plotted against cutting speed (vc) and feed (f) rate
Figure 5
The expected surface height (Rz) plotted against cutting speed (vc) and feed rate (f)
4 Estimating Optimal Cutting Parameters
To calculate optimal cutting parameters it is important to choose an proper target function (objective function). The optimal point (i.e. a maximal or a minimum value) can be obtained at different sets of independent factors, however, the requirements (restrictions) occasionally contradict one another. In this case the aim is to minimize the machined surface roughness parameters (Ra, Rz) and to maximize the productivity factor (Pf). To fulfil the requirements mentioned the 3 target functions were formulated as follows:
Min
Ra (11)
Min
Rz (12)
Max f v
Pf c (13)
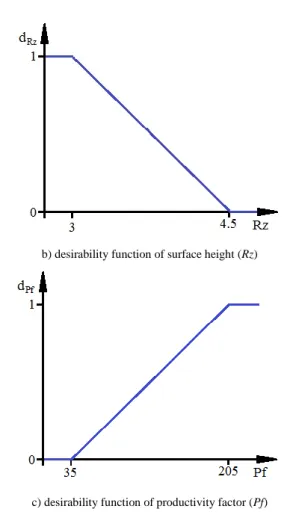
In our case we used the desirability function proposed by Harrington [8], for the combination of features expressed in different measures and to be considered with different weights. As it is known, the equations representing the desirability functions take values from the interval (0, 1). In our investigation, the selected desirability functions denoted by dRa, dRz and dPf are shown in Fig. 6. The limits of surface roughness were determined, to be the same as the minimum values (Ra, Rz) expected during grinding. In order to fulfil the requirements represented by Eqs. (11, 12 and 13), a composite desirability function was constructed.
The composite desirability function (D) which is designated to look for the optimal point, is obtained by computing the geometrical average of the 3 individual desirability functions:
3 dRa dRz dPf
D (14)
The value of the composite desirability function is 1 (i.e. D=1) if the values of selected desirability functions (dRa, dRz and dPf) are 1 as well.
a) desirability function of average surface (Ra)
b) desirability function of surface height (Rz)
c) desirability function of productivity factor (Pf)
Figure 6 Desirability functions
The results obtained by optimization with 0.83527 composite desirability value (D) are: TM = 3; vc = 2000 m/min; f = 0.0677 mm; a = 0.2 mm. In this case the optimum Ra value is 0.4001 μm with dRa=0.99965; the optimum Rz value is 2.9957 with dRz=1.000 and the productivity factor value is 135.3535 which has dPf
= 0.58296.
Conclusions
The effects of cutting parameters (vc, f, a) were examined in case of fine turning of a cylindrical work pieces of AS17 alloy with a MDC, PCD, CVD-D tools. To calculate the average surface roughness (Ra) and the surface height (Rz) for different edge materials, statistical methods and empirical equations based on the use of design of experiments were applied. The performed investigation shows which factors (cutting parameters) have significant influences on average surface
roughness (Ra) and surface height (Rz). Based on experimental data, combined models were established by which the surface roughness obtained with different edge materials can be efficiently predicted (the edge materials as a changing input factor were included in the model equations). By using an appropriately defined combined objective function, this phenomenological model enables to estimate the optimal cutting parameters.
Acknowledgement
The project was realised through the assistance of the European Union, with the co-financing of the European Social Fund, TÁMOP-4.2.1.B-11/2/KMR-2011- 0001 Research on Critical Infrastructure Protection.
References
[1] Á. Drégelyi-Kiss, R. Horváth, B. Mikó.: Design of Experiments (DOE) in Investigation of Cutting Technologies, Development in Machining Technology/Scientific-Research Reports 3 (2013) (book chapter, in press) [2] H. Aouici, M. A. Yallese, K. Chaoui, T. Mabrouki, J. F. Rigal: Analysis of
Surface Roughness and Cutting Force Components in Hard Turning with CBN Tool, Prediction Model and Cutting Conditions Optimization, Measurement 45 (2012) 344-353
[3] M. Y. Noordin, D. Kurniawan, Y. C. Tang, K. Muniswaran: Feasibility of Mild Hard Turning of Stainless Steel Using Coated Carbide Tool, The International Journal of Advanced Manufacturing Technology 60 (2012) 853-863
[4] I. Asiltürk, S. Neseli: Multi Response Optimisation of CNC Turning Parameters via Taguchi Method-based Response Surface Analysis, Measurement 45 (2012) 785-794
[5] Y. K. Hwang, C. M. Lee: Surface Roughness and Cutting Force Prediction in MQL and Wet Turning Process of AISI 1045 Using Design of Experiments, Journal of Mechanical Science and Technology 24 (2010) 1669-1677
[6] M. Harničárová, J. Valíček, M. Kušnerová, R. Grznárik, J. Petrů, L.
Čepová: A New Method for the Prediction of Laser Cut Surface Topography, Measurement Science Review 12 (2012) 195-204
[7] D. Lazarević, M. Madić, P. Janković, A. Lazarević: Surface Roughness Minimization of Polyamide Pa-6 Turning by Taguchi Method, Journal of Production Engineering 15 (2011) 29-32
[8] E. C. jr. Harrington: The Desirability Function, Industrial Quality Control 21 (1965) 494-498