APPLICATION OF PHOSPHORIMETRY
4.1. DETECTION AND DETERMINATION OF IMPURITIES IN POLYCYCLIC AROMATIC HYDROCARBONS
Polycyclic aromatic hydrocarbons play an important role in many fields of research, e.g., in molecular spectroscopy, in semiconductor physics, and in cancer research. In all cases highly purified compounds are needed and knowledge of the impurities is of the greatest importance for planning experiments and discussing results. Similarly, in several technical processes in the chemical industry, the aromatics used as starting materials must be of very high purity.
The majority of the polycyclic aromatics that are commercially available come from coal tar. Since the tar is a very complicated mixture of very similar compounds, the substances isolated still often contain several impurities that are very difficult to remove. The same is true of many of the polycyclic aromatics obtained by synthesis. Thus it is important to have available efficient methods of analysis for the detection and estimation of the impurities in these hydrocarbons. It has been shown that spectrophosphorimetry is a very suitable method of investi
gation for this purpose. It is, in many cases, more effective than UV and fluorescence spectroscopy, and chromatography, and supplements these methods in many other instances.
An example of the application of spectrophosphorimetry that has been studied with exceptional thoroughness is the investigation of anthracene and its impurities. It has long been known that the principal impurities in the anthracene derived from coal tar are phenanthrene and carbazole.
Moreover the presence of sulfur suggests further impurities the nature 158
4.1. Impurities in Polycyclic Aromatic Hydrocarbons 159 of which, it is surprising to find, has not yet been completely settled.
The accuracy and sensitivity of the classical chemical methods for the determination of phenanthrene and carbazole in highly purified anthra
cene—oxidation and treatment with nitrous acid or Kjeldahl analysis—
are not sufficient for many purposes. In addition these methods are tedious to carry out.
An elegant gas chromatographic method for the determination of impurities in anthracene described by Sauerland1 does not achieve the sensitivity of the luminescence spectroscopic methods.
Since the UV spectrum of anthracene overlaps the spectra of phen
anthrene and carbazole throughout the whole range of wavelengths, determination of these compounds is difficult if they are present only in small quantities. The limit of detection of phenanthrene in anthracene is of the order of magnitude of 0.1 % in a process described by Schmidt2 that makes use of statistical methods.
Fluorescence spectroscopy is more sensitive. However, the fluorescence spectra of phenanthrene and carbazole overlap each other extensively, so that fluorimetric determination of the compounds in the presence of each other is difficult.
Carbazole and phenanthrene show intense phosphorescence in the blue and green regions of the spectrum, and anthracene itself phos
phoresces very weakly in the red, at 680 m/x. Since the spectra of carbazole and phenanthrene overlap each other only slightly, the prerequisites for the phosphorimetric determination of these principal impurities are ideal. A detailed description of the method of analysis has been given by Zander.3
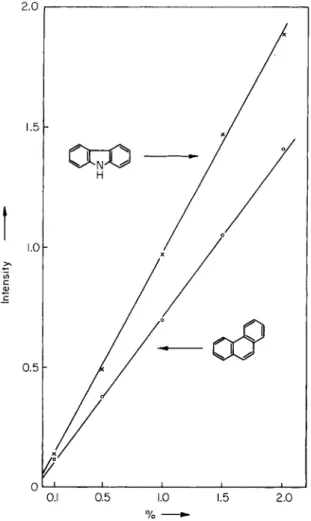
The 0,0 band at 408 m/x is suitable for use as the key band for deter
mining carbazole, but for phenanthrene the band at 500 m/x is used since it is only slightly overlapped by the phosphorescence spectrum of carbazole (in this connection, see Fig. 26). Test analyses showed that, with the concentrations at which these impurities are usually present in anthracene, consideration of the carbazole phosphorescence at 500 m/x is not necessary.
The excitation wavelength for the determination of carbazole and phenanthrene is 290 m/x, at which their extinction coefficients are greater
1 H. D. Sauerland, Brennstoff-Chem. 45, 55 (1964).
2 H. Schmidt, Erdoel Kohle 19, 275 (1966).
3 M. Zander, Angew. Chem. Intern. Ed. Engl. 4 , 930 (1965).
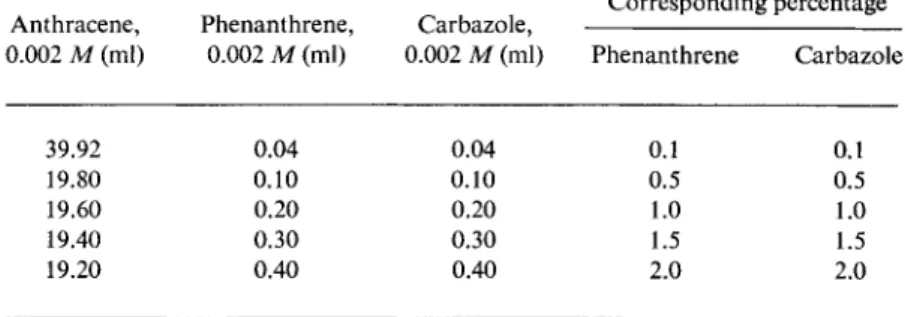
TABLE 27 Calibration Mixtures for Spectrophosphorimetric Determination of Phenanthrene and Carbazole in Anthracene"
Anthracene, Phenanthrene, Carbazole, Corresponding percentage 0.002 M (ml) 0.002 M (ml) 0.002 M (ml) Phenanthrene Carbazole
39.92 0.04 0.04 0.1 0.1
19.80 0.10 0.10 0.5 0.5
19.60 0.20 0.20 1.0 1.0
19.40 0.30 0.30 1.5 1.5
19.20 0.40 0.40 2.0 2.0
* M. Zander, Chem.-Ingr.-Tech. 37, 1010 (1965).
For the analysis there were first prepared, from 0.002 M standard solutions of anthracene, phenanthrene, and carbazole in EPA, the calibration mixtures specified in Table 27. Then, on excitation of the phosphorescence with 290 m/x, the intensities of the key bands were measured. Proceeding as described earlier, these intensity values were plotted against the concentration (as a matter of convenience, im
mediately in percentage of the component) to form calibration curves.
Figure 30 shows the curves for phenanthrene and carbazole in anthracene over the range 0.1-2 %. Then, in a similar way, using a 0.002 M solution of the test material in EPA, the phosphorescence intensities of the key bands were again measured and the corresponding percentage contents of phenanthrene and carbazole were deduced from the calibration curves.
than that of anthracene by a factor of about 40. On the other hand, in the samples being investigated, the anthracene has a concentration about 100 times as great, so that the extinctions of the three components are comparable. Consequently a substantial part of the stimulating radiation is absorbed by the anthracene (an inner filter effect; see Section 3.4).
It is therefore necessary that the solutions used to set up the calibration curves contain anthracene as well as carbazole and phenanthrene, and indeed in concentrations corresponding approximately to the actual proportions.
4.1. Impurities in Polycyclic Aromatic Hydrocarbons 161 In highly refined anthracene from coal tar, the impurities are less than 0.1 %. Carbazole and phenanthrene in anthracene can still be determined down to about 0.005 % in the manner described above. For this it is necessary to set up calibration curves for the range 0.1-0.005%. The mixtures required are conveniently prepared from a 0.002 M solution
2 . 0
01—1 1 1 1 1—
O.I 0.5 1.0 1.5 2 . 0
% •
Fig. 30. Phosphorescence calibration curves for the determination of carbazole and phenanthrene in anthracene. [According to M. Zander, Angew. Chem. Intern.
Ed. Engl. 4 , 930(1965).]
of anthracene and 0.00002 M solutions of carbazole and phenanthrene.
Obviously the carbazole and phenanthrene content of the anthracene used for the calibration curves must be below the limits of detection.
The method described was worked out for an Aminco-Keirs spectro- phosphorimeter (with mercury-xenon lamp and RCA photomuitiplier
1P28). The combination of slit widths quoted earlier for quantitative analyses (see Section 3.3.1) was used. The procedure can, of course, be carried out with other apparatus of comparable sensitivity.
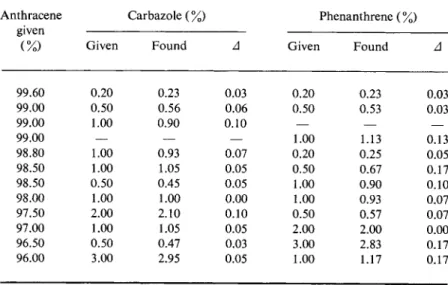
TABLE 28 Testing the Spectrophosphorimetric Determination of Carbazole and Phenanthrene in Anthracene*
Anthracene Carbazole (%) Phenanthrene ( %) given
(%) Given Found Δ Given Found Δ
99.60 0.20 0.23 0.03 0.20 0.23 0.03
99.00 0.50 0.56 0.06 0.50 0.53 0.03
99.00 1.00 0.90 0.10 — — —
99.00 — — — 1.00 1.13 0.13
98.80 1.00 0.93 0.07 0.20 0.25 0.05
98.50 1.00 1.05 0.05 0.50 0.67 0.17
98.50 0.50 0.45 0.05 1.00 0.90 0.10
98.00 1.00 1.00 0.00 1.00 0.93 0.07
97.50 2.00 2.10 0.10 0.50 0.57 0.07
97.00 1.00 1.05 0.05 2.00 2.00 0.00
96.50 0.50 0.47 0.03 3.00 2.83 0.17
96.00 3.00 2.95 0.05 1.00 1.17 0.17
a M. Zander, Angew. Chem. Intern. Ed. Engl. 4, 930 (1965).
Table 28 gives the results of a series of test analyses. The mixtures investigated were prepared from the purest anthracene, carbazole, and phenanthrene. The anthracene content of the mixtures was chosen between 99.6 and 96%. To establish the reproducibility of the method, several samples of industrial anthracene, as they were obtained from coal tar distillation, were investigated, altogether 6 times, for phen
anthrene and carbazole. The values found, the average values, and the deviations are presented in Table 29.
4.1. Impurities in Polycyclic Aromatic Hydrocarbons 163
Carbazole ( %) Phenanthrene ( %)
Found Δ Found Δ
Test 1
0.59 0.59 0.56 0.59 0.63 0.59
Mean 0.59
0 . 0 0 0 . 0 0 0.03 0.00 0.04 0.00
0.90 0.90 0.86 0.83 0.90 0.86 Ô 8 8
0.02 0.02 0.02 0.05 0.02 0.02
Test 2
0.55 0.49 0.54 0.54 0.52 0.56
Mean 0.53
0.02 0.04 0.01 0.01 0 . 0 1 0.03
0.70 0.72 0.72 0.67 0.70 0.67 Ô 7 Ô
0 . 0 0 0.02 0.02 0.03 0 . 0 0 0.03
Test 3
0.52 0.52 0.49 0.54 0.56 0 . 5 4
Mean 0.53
0.01 0.01 0 . 0 4 0.01 0.03 0.01
0.63 0.64 0.64 0.63 0.67 0.63
"Ô64
0.01 0 . 0 0 0.00 0 . 0 1 0.03 0.01
a M. Zander, Angew. Chem. Intern. Ed. Engl. 4, 930 (1965).
The mean relative error of the method depends, as would be expected, on the magnitude of the concentrations to be determined.
For 0 . 1 % of carbazole or phenanthrene, it amounts to ca. 1 0 % ; for TABLE 29 Testing the Spectrophosphorimetric Determination of Carbazole and
Phenanthrene in Anthracene*
0.005%, however, ca. 50%. Nevertheless this accuracy is almost always sufficient.
It has already been mentioned that anthracene derived from coal tar, beside carbazole and phenanthrene, contains sulfurous impurities.
The S content of a representative tar anthracene (anthracene content
>98 %) is 0.06 %. It is usually assumed that the S-containing impurity is diphenylene sulfide (C). From the S content a percentage of diphenylene sulfide of 0.35 % is calculated. In fact phosphorescence investigations of several tar anthracene samples showed that the diphenylene sulfide content is certainly less than 0.15%. From this it must be concluded that the major part of the sulfur is present in some other form.4 For several reasons, 5,6-benzothionaphthene (CI) has been suggested and K r u b e r5 has detected this compound in coal tar.
Frequently, in a polycyclic aromatic hydrocarbon, not only the amount but also the nature of the impurity is unknown. Spectrophos
phorimetry may also be put to useful service in the identification of the impurities. The technique described earlier is used (selective excitation, identification by spectra and lifetimes, heavy atom effects, etc.). The procedure may be described in detail with pyrene and fluorene as examples.
The spectrophosphorimetric investigation of pyrene (CII) from coal tar (pyrene content ca. 95%) has been described by Zander.3 In the UV
C CI
CII c m
4 M. Zander, unpublished data (1965).
5 O. Kruber and L. Rappen, FIAT Rev. Ger. Sci. 36, 292 (1946).
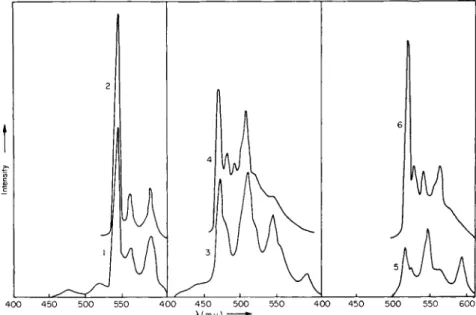
4.1. Impurities in Polycyclic Aromatic Hydrocarbons 165 spectrum an extra band at 288 m/x is observed in addition to the pyrene bands; this could arise from fluoranthene (CIII). The measurement of the phosphorescence by irradiation in a strong absorption band of fluoranthene (360 m/x) gave the phosphorescence spectrum of this compound almost without interference. In Fig. 31 the phosphorescence
Fig. 31. Phosphorescence spectra of technical pyrene on excitation with various wavelengths. [According to M. Zander, Angew. Chem. Intern. Ed. Engl. 4,930 (1965).]
spectrum of the pyrene impurity (curve 1) is reproduced beside that of pure fluoranthene (curve 2). For confirmation, the mean phosphorescent lifetimes of the substance accompanying the pyrene and that of pure fluoranthene were both measured for the band at 545 m/x. They agree within experimental error (0.8 and 0.9 second, respectively). Measure
ment of technical pyrene by irradiation with 290 m/x gave spectrum 3, which belongs to a further impurity. Comparison with the phosphor
escence spectra of several components of tar that boil in the same range as pyrene made it seem very probable that the impurity involved here was 1,2-benzodiphenylene oxide (CIV) (phosphorescence spectrum 4 of Fig. 31). As a further check, here too, the phosphorescent lifetimes of
the pyrene satellite and of pure 1,2-benzodiphenylene oxide were estimated ; within the limits of accuracy of the measurement they agreed (3.9 and 4.0 seconds, respectively). Finally, by exciting the technical pyrene with 340 m/x, a third impurity (curve 5) could be obtained.
Since this spectrum overlaps that of fluoranthene on the long-wave side, only the first two bands can be used in the identification. Hence it is probable that this impurity is 2,3-benzodiphenylene oxide (brasan) (CV).
The spectrum of the pure substance is reproduced in Fig. 31 (curve 6) for comparison. To summarize, it is evident that phosphorescence spectroscopic investigation of technical pyrene (CII) permits the definite identification of two impurities, fluoranthene ( O i l ) and 1,2-benzo
diphenylene oxide (CIV), and makes probable that of a third, brasan (CV). In contrast, UV spectroscopy furnishes only a weak hint of one of them (fluoranthene).
P a r k e r6 spectrophosphorimetrically investigated the impurities in commercially obtainable fluorene and in a substance purified by zone melting. On excitation with 313 m/x, a wavelength that is not absorbed by the fluorene itself, two groups of bands were obtained and clearly arose from two impurities. The group having the shorter wavelength could unequivocally be assigned to carbazole, as the result of com
parison with an authentic spectrum. Quantitative spectrophosphori
metric investigation gave 30 ppm as its concentration in the unpurified sample. After zone melting it was less than 2 ppm. The second spectrum could not be assigned beyond doubt, but it seemed very probable that an alkyl derivative of naphthalene was involved. Kanda and colleagues7 had previously established that commercial fluorene displayed addi
tional phosphorescence bands that were missing from synthetic fluorene.
They had attributed these to diphenylene oxide (CVI). It is quite plaus
ible, considering the boiling point range of the coal tar fraction from
6 C. A. Parker, Proc. SAC Conf., Nottingham, 1965 p. 208.
7 Y. Kanda, R. Shimada, K. Hanada, and S. Kajigaeshi, Spectrochim. Acta 17, 1268 (1961).
CIV CV
4.1. Impurities in Polycyclic Aromatic Hydrocarbons 167 which it is obtained, that fluorene contains carbazole or diphenylene oxide as an impurity.
CVI
In many cases it could be shown that the phosphorescence spectrum of aromatic hydrocarbons revealed the presence of impurities that were quite unrecognizable by UV and not definitely recognizable by fluor
escence. Traces of impurities can be detected in 3,4-benzpyrene (CVII);
CVII
P a r k e r6 identified chrysene (CVIII) and demonstrated the presence of another impurity, the identity of which could not be established. The behavior of both impurities was followed up by phosphorescence spectroscopy after zone melting of the 3,4-benzpyrene.
In l,2:5,6-dibenzanthracene (CIX) obtained from coal tar, picene (CX) could be detected in small quantities. Purification of the dibenz- anthracene by means of its addition product with maleic anhydride yielded a product free from picene.8
In 1,2-benzanthracene (CXI) from coal tar chrysene (CVIII) is detectable, and in acenaphthylene (CXII), acenaphthene (CXIII).4
CXII CXIII In all cases the detection of phosphorescent impurities is very sensitive.
Occasionally the detection sensitivity is greatly increased by use of a solvent that shows an external heavy atom effect (see Section 3.2). This was indicated, for example, in the detection of fluoranthene in pyrene.9 Because the external heavy atom effect is quite specific to the substance (see Section 3.2) it frequently permits a decision to be made with respect to whether the impurity bands result from one or several compounds.
Many polycyclic aromatic hydrocarbons, e.g., the higher annellated acenes such as tetracene and pentacene, are very easily photooxidized.
Thus small quantities of quinones are often formed in such purification processes as chromatography on alumina and recrystallization and are very difficult to recognize by ordinary analytical methods. However, most of these quinones phosphoresce very intensely and so can be detected very sensitively in higher annellated hydrocarbons. Among other examples, this has been illustrated1 0 by the tetracene-5,12-quinone (CXIV), that is present in small amount in tetracene purified by con
ventional methods.
Ο
9 M. Zander, Ζ. Anal. Chem. 226, 251 (1967).
0 E. Clar and M. Zander, Chem. Ber. 89, 749 (1956); / . Chem. Phys. 43, 3422 (1965).
4.2. The Analysis of Coal Tar Fractions 169 4.2. T H E ANALYSIS OF COAL T A R FRACTIONS1
At the present time the tar processing industry is much concerned with using its raw material as thoroughly and productively as possible. This demands, among other things, a considerable knowledge of the qualita
tive and quantitative composition of the fractions resulting from the tar distillation. Even scientists engaged in fundamental research may well be interested in the analytical composition of the tar fractions; for example, those biochemists and medical scientists who are working in the field of cancer research.
Because of the extraordinarily complicated nature of coal tar, even fractions of very narrow range still include a large number of compounds.
It is therefore useful to have available the greatest possible number of dif
ferent physical and chemical techniques that are mutually complementary in range of application. Gas and paper chromatography and UV and flu-
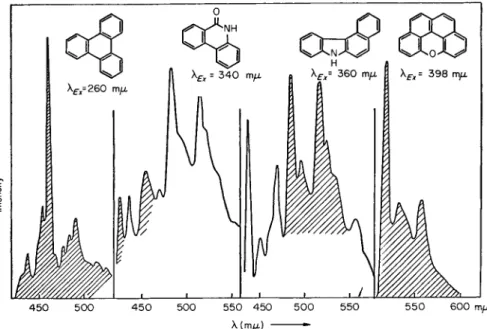
450 5 0 0 4 5 0 500 550 450 5 0 0 550 5 5 0 6 0 0 π\μ λ (m/x)
Fig. 32. Phosphorescence spectra of a coal tar fraction boiling at ca. 4 6 0 ° C and 760 torr on excitation with 2 6 0 , 3 4 0 , 360, and 398 rmx. [According to M. Zander, Erdoel Kohle 19, 278 (1966).]
1 M. Zander, Erdoel Kohle 19, 278 (1966).
orescence spectroscopy long ago found their way into the analysis of coal tars. It has been found that spectrophosphorimetry supplements these methods in quite a remarkable way, and that in many cases it is able to supply analytical information that is not accessible by the other methods.
For mixtures that are as complicated as even very narrowly cut coal tar fractions, the method of selective excitation of phosphorescence is particularly important. In Fig. 32 the phosphorescence spectra (in EPA at 77°K) of a coal tar fraction of boiling point ca. 460°C at 760 Torr are reproduced, excitation having been stimulated by different wavelengths.
Most of the individual spectra can be assigned to known substances.
The range in which each spectrum of the tar fraction agrees with that of the pure compound is indicated on the graphs by the shading. Here, as in other cases, the identification of the substances followed from their spectra and was confirmed by measuring their phosphorescent lifetimes (in this connection see Section 3.5.3).
It was shown earlier that some substances possess different phos
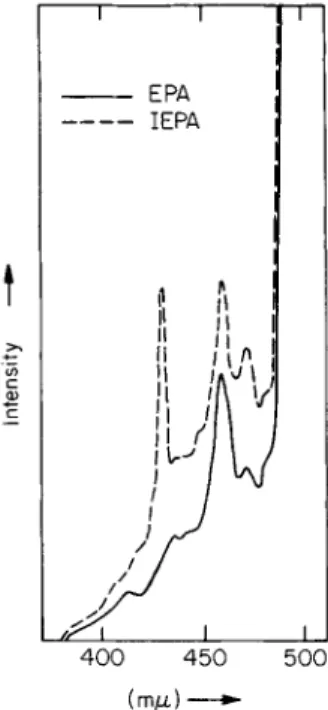
phorescence spectra in EPA and in a mixture of EPA and methyl iodide (ΙΕΡΑ, see Section 3.2). This effect occasionally proves useful for the identification of individual compounds in tar fractions of very com
plicated composition. In Fig. 33 a section of the phosphorescence spectrum of such a fraction is reproduced. The EPA spectrum (the continuous curve) suggested—particularly because of the band at 463 m/x—the presence of triphenylene. This was confirmed by measuring the sample in ΙΕΡΑ (the broken curve). A considerable strengthening of the 0,0 band of the triphenylene at 430 m/x is observed. This effect is characteristic of triphenylene (compare the spectra of the pure hydro
carbon in EPA and ΙΕΡΑ given in Fig. 23).2
In considering the qualitative spectrophosphorimetric analysis of coal tar fractions, it should not be overlooked that the great majority of the compounds present in the tar has not so far been identified. The total number has been assessed at about 10,000. Of these some 5 % have so far been recognized with certainty, and make up some 55 % of the total weight.3 In this situation it is understandable that many bands in the phosphorescence spectra of tar fractions cannot be assigned. It is quite conceivable that phosphorescence spectroscopy will occasionally lead to the discovery of new components in the tar.
2 M. Zander, Z. Anal. Chem. 226, 251 (1967).
3 H. G. Franck, Angew. Chem. 63, 260 (1951); Brennstoff-Chem. 45, 5 (1964).
4.2. The Analysis of Coal Tar Fractions 171 The quantitative spectrophosphorimetric determination of individual substances in tar fractions is carried out in the manner described else
where (see Section 3.4). Many of the compounds can be determined better by phosphorimetric methods than by UV or fluorescence spectro
scopy. In Table 30 there are listed the spectroscopic methods by which
I 1
EPA
I
ΙΕΡΑ
1 ·' 'Ί λ Ι
1 Ά
ν
ι 'Μ
)f
Λ ^ ι ι ι
4 0 0 4 5 0 5 0 0 (m/x) — •
Fig. 33. Phosphorescence spectrum of a coal tar fraction on excitation with 300 m/x in EPA (—) and ΙΕΡΑ (—). [According to M. Zander, Z. Anal. Chem. 226,251 (1967).]
some of the constituents are best estimated quantitatively. The table also includes suitable excitation wavelengths and key bands for their phos
phorimetric estimation.
The accuracy of the phosphorimetric evaluation of individual com
pounds in tar fractions may be revealed by the examination of test mixtures as well as by comparison with UV spectroscopic analyses. As an example there are given in Table 31 test analyses for the estimation of phenanthridone in tar fractions. The test mixtures were prepared by
TABLE 30 Spectroscopic Methods for the Determination of Individual Compounds in Coal Tar Fractions*
Excitation
wavelength for Key band for phosphorimetry phosphorimetry
Compound Method (m/x) (τημ)
Anthracene UV, fluorimetry
Phenanthrene Phosphorimetry 290 500
Carbazole Phosphorimetry 290 408
Diphenylene sulfide Phosphorimetry 320 425
Fluoranthene Phosphorimetry 360 540
Pyrene UV
Phenanthridone Phosphorimetry 325, 340 425
Triphenylene Phosphorimetry 258 463
1,2-Benzanthracene UV
Chrysene UV
Tetracene UV
Peri-(1,8,9)-naphthoxanthene Phosphorimetry, UV
398 515
3,4-Benzcarbazole Phosphorimetry 360 483
Perylene UV
3,4-Benzpyrene Fluorimetry
1,2-Benzpyrene Phosphorimetry 330 540
a M. Zander, Erdoel Kohle 19, 278 (1966).
TABLE 31 Testing the Determination of Phenanthridone in Coal Tar Fractions*
Given Found
(wt. %) (wt. %)
2.0 2.1
3.0 2.9
4.0 3.9
5.0 5.0
7.0 6.7
9.0 9.1
12.0 11.6
* M. Zander, Erdoel Kohle 19,278 (1966).
43. Applications to the Study of Air Pollution 1 7 3 adding phenanthridone in known quantities to tar fractions that con
tained none.
There are not many instances in which a compound in a tar fraction can be quantitatively evaluated with roughly the same accuracy both by phosphorimetry and by UV spectroscopy. One example is 1,8,9) naphthoxanthene, which can be determined by UV spectroscopy using the band at 3 9 8 m/x and by means of its phosphorescence spectrum using that at 5 1 5 m/x. Ultraviolet and phosphorescence spectroscopic analyses for this compound were carried out for a series of tar fractions, and the results are quoted in Table 3 2 .
T A B L E 3 2 Comparison of Determinations Carried Out by UV and Phosphorescence Spectroscopy*
/?m-(l,8,9)-Naphthoxanthene (wt. %) Sample
number Phosphorescence UV
24 2.6 2.3
26 4.1 4.2
27 5.2 4.9
28 6.9 6.8
30 10.4 9.4
33 8.6 10.3
* M. Zander, Erdoel Kohle 19, 278 (1966).
4 . 3 . APPLICATIONS TO THE STUDY OF A I R POLLUTION
In the dust of the atmosphere (especially that of industrial towns), numerous polycyclic aromatic hydrocarbons and heterocyclics are to be found. It has been known for a long time that many of these compounds produce cancers in animals, and medical statistics have produced indirect evidence that the same is true also with human beings. It is therefore obvious why nowadays very great interest is shown in the analysis of airborne particles for the carcinogenic compounds present, to which all mankind is exposed. On this subject the work of E. Sawicki and his collaborators at the Robert Α. Τ aft Engineering Center in Cincinnati, Ohio, is particularly important.
The analysis of samples of dust from the air is usually so carried out that the part that is soluble in an organic solvent is separated into coarse fractions either by column chromatography or by some other separation technique; each layer is then further resolved by paper or thin-layer chromatography. The separation proceeds either to the pure components or as far as mixtures that still consist of several substances.
The pure components or mixtures so obtained must finally be qualita
tively and quantitatively analyzed. For this purpose it is preferable to make use of spectroscopic methods, particularly fluorescence spectro
scopy.
Sawicki1 has pointed out, in a review that appeared in 1964, that phosphorescence spectroscopy should prove of inestimable service for trace analysis, and hence for the investigation of airborne dust samples.
It is certain that the possible applications of spectrophosphorimetry in this field are far from exhausted. It follows, for example, that, for the recognition of aromatic and heterocyclic carbonyl compounds in samples of atmospheric dust, phosphorescence spectroscopy should be appreciably more effective than the better established methods.
Sawicki and Johnson 2 have shown that polycyclic aromatics from the air can easily be rendered visible on thin-layer chromatograms by means of their phosphorescence (in liquid nitrogen).
In the course of their studies Sawicki and his colleagues3 compared the possibilities of applying UV, phosphorescence, and fluorescence spectroscopy to the characterization of polynuclear azaheterocyclic compounds. They found that, with the help of their phosphorescence spectra, the following isomers could be distinguished: phenanthridine and acridine, indeno(l,2,3-//)isoquinoline and acenaphtho-(l,2-6)pyri- dine, benzo(a)acridine and benzo(c)acridine, dibenz(a,/z)acridine and dibenz(a,/)acridine, and 14-phenyldibenz(tf,y)acridine and 7-phenyl- dibenz(c,A)acridine. Spectrophosphorimetry showed, with the aza- heterocyclics, considerably greater selectivity than UV spectroscopy.
The reasons for this lie in the quite large differences in the phosphor
escence quantum yields, the phosphorescence spectra, and phosphor
escent lifetimes of the various compounds. As a disadvantage of the
1 E. Sawicki, Chemist-Analyst 53, 88 (1964).
2 E. Sawicki and H. Johnson, Microchem. J. 8, 85 (1964).
3 E. Sawicki, T. W. Stanley, J. D. Pfaff, and W. C. Elbert, Anal. Chim. Acta 31, 359 (1964).
4.4. Applications to the Analysis of Petroleum Products 175 phosphorescence technique it was asserted that the intensity measure
ments were difficult to reproduce. This, however, may have been attributable to the apparatus, since, in general, phosphorescence intensity measurements can be reproduced quite accurately.
4.4. APPLICATIONS TO THE ANALYSIS OF PETROLEUM PRODUCTS
Several examples of the application of phosphorescence spectroscopy to the complex field of petroleum analysis have appeared in the literature.
Mamedov1 has identified a number of polycyclic aromatic hydrocarbons in the wax distillates from petroleum by this means, among them being
2,9-dimethyl-3,4-benzphenanthrene (CXV). Khaluporskii2 studied the phosphorescence and fluorescence of lubricating oils. He observed that products with good lubricating properties were recognizable by their low phosphorescences. Sidorov and R o d o m a k i n a3 have reported on various applications of phosphorescence spectroscopy to the analysis of petroleum products. We shall now discuss in detail an important study of the application of spectrophosphorimetry to this problem by Drushel and Sommers.4
These authors investigated the azahydrocarbons and other nitrogen heterocyclics in petroleum products by combining the use of gas chroma
tography with UV, fluorescence, and phosphorescence spectroscopy.
The basic nitrogen compounds from a straight-run middle distillate (430°-650°F) were extracted from the oil with dilute (1:1) hydrochloric acid, the extract was then neutralized with sodium hydroxide, and the
1 Kh. J. Mamedov, Izv. Akad. Nauk SSSR, Ser. Fiz. 23, 126 (1959); Chem. Abstr.
53, 13,561g(1959).
2 M. D. Khaluporskii, Zavodsk. Lab. 28, 206 (1962); Chem. Abstr. 57, 24947 and 8799d (1962).
3 Ν. K. Sidorov and G. M. Rodomakina, Uch. Zap. Saratovsk. Gos. Univ. 69, 161 (1960); Chem. Abstr. 57, 12,782e (1962).
4 H. V. Drushel and A. L. Sommers, Anal. Chem. 38,10 and 19 (1966).
CXV
nitrogen compounds that were precipitated in this way were dissolved in hexane. After the hexane solution was thoroughly washed with water, the solvent was distilled off and the basic nitrogen compounds remained behind. This material was used for the analytical examination. Gas chromatography effected a partial separation. The individual fractions leaving the gas chromatograph were collected in cooling traps and characterized spectroscopically. In the first fractions, quinolines seemed to be indicated by their UV spectra, but these overlap the spectra of substituted pyridines and tetrahydroquinolines, which could not there
fore be confirmed. Phosphorescence spectra supplied additional evidence on the composition of the gas chromatographic fractions. By suitable selection of excitation wavelengths, it was possible to demonstrate the occurrence of quinolines and substituted pyridines or tetrahydro
quinolines (or both) side by side in the fractions. Characterization was effected both by means of the spectra and by measurement of the phos
phorescent lifetimes. Although quantitative analysis was not the object of the investigation, an estimate of the relative amounts of quinolines and substituted pyridines or tetrahydroquinolines or both in the speci
mens could be obtained. It showed that, as expected, pyridines or tetrahydroquinolines or both were concentrated in the first gas chroma
tographic fractions, and quinolines were concentrated in the later fractions. In these fractions acridine and benzacridines could also be detected through their intense fluorescence spectra.
A still more thorough study of this kind was carried out by Drushel and Sommers 4 on a light catalytic cycle oil with boiling range 400°-620°F.
Starting from 3 kg of the oil and following a complicated process of working up in which, among other techniques, silica gel chromatography and extraction processes were employed, fractions were obtained in which carboxylic acids, phenols, basic nitrogen compounds, indoles, and carbazoles were concentrated. These fractions were examined—as described above—by gas chromatography and spectroscopy; the same gas chromatographic fractions were cleverly used for the measurement of infrared, phosphorescence, fluorescence, UV, and mass spectra.
The phosphorescence spectra gave more specific information than the fluorescence spectra. In the appropriate gas chromatographic fractions, substituted pyridines and quinolines could be detected via their phos
phorescence spectra. Several spectra, possibly arising from tricyclic systems, remained unidentified. The indole-carbazole fraction produced
4.4. Applications to the Analysis of Petroleum Products 1 7 7
TABLE 3 3 Investigation of the Nitrogen Compounds Resulting from the Catalytic Hydrogénation of Quinolinea
Gas
chromatographic Percentage
peak Compound identified by weight
1 Aniline 12.3
2 o-Toluidine 5.3
3 o-Ethylaniline 1.2
4 N-Ethyl-0-toluidine 0.3
5 o-Propylaniline (and other compounds) 4.2
6 Quinoline 47.8
7 2-Methylquinoline and 1,2,3,4-tetrahydroquinoline 14.1
8 3-Methylquinoline 1.3
9 Indole 4.4
10 2-Ethylquinoline 4.4
11 2-Isopropylquinoline 2.6
12 Dimers and codimers of partially hydrogenated
quinolines, alkylquinolines and indoles 2.1 100.0
a According to H. V. Drushel and A. L. Sommers, Anal. Chem. 3 8 ,1 0 (1966).
The combined application of gas chromatography and spectroscopy also justified itself in the investigation of the complicated mixture of reaction products obtained by the catalytic hydrogénation of quinoline.
Here too, the great value of phosphorescence spectroscopy was clear, as had been stressed by Drushel and Sommers. By combination of the evidence provided by gas chromatography and by both phosphorescence two well-separated groups of peaks that were traced to substituted indoles and carbazoles. In the corresponding gas chromatographic fractions, compounds of the indole type were definitely detected. The carbazoles were also recognizable by their characteristic phosphor
escence spectra. In every case the excitation spectra and the phosphor
escence lifetimes were employed in the identification as well as the luminescence spectra.
and infrared spectroscopy on the individual gas chromatographic fractions, the majority of the compounds present were identified. The results of this interesting analysis are given in Table 33. It is worth comment that besides the normal hydrogénation of the quinoline system cracking and alkylation (with alkyl radicals from the cracking process) also take place. Attention may be called to the relatively high indole content of the mixture resulting from the catalysis.
4.5. DETERMINATION OF INHIBITORS IN POLYMERS1
Inhibitors are often added to polymers to prevent oxidation and degrada
tion, both of which alter the physical properties of the polymers in undesirable ways. The quantitative estimation of the inhibitors is an important analytical problem in the chemistry of synthetic products and so it is not surprising that much work has been published on it.
Frequently the inhibitor is extracted from the polymer before the real analysis is carried out. The determination of the inhibitor in the extract then takes place by IR or U V spectroscopy. However, the extraction process is usually tedious, frequently incomplete, and in many cases may change the inhibitor chemically as it proceeds. Consequently methods of evaluation are sought in which no extraction is necessary.
Such procedures are known. In them either IR or UV spectroscopy is used, but direct IR analysis of inhibitors in polymers has the disadvan
tage that the method is not very sensitive, and UV spectroscopic deter
mination becomes difficult or impossible if the inhibitor displays no sharp, characteristic UV bands or if the absorption of the inhibitor is hidden beneath bands arising from the main component or additives.
Hence use has been made in this field of the advantages that the lumin
escence spectroscopic methods possess compared with the absorption methods. In many instances the direct quantitative determination of inhibitors is possible by measuring the fluorescence spectra. Some inhibitors, however, show weak uncharacteristic fluorescences. As in other cases, weakly fluorescing inhibitors are frequently found to be intensely phosphorescent. Drushel and Sommers1 have shown how they can be estimated.
For their experiments they used an ethylene-propylene rubber (EPR) and the inhibitors they studied were 2,2'-dimethyl-5,5'-dW-butyl-4,4'-
1 H. V. Drushel and A. L. Sommers, Anal. Chem. 36, 836 (1964).
4.6. Applications in Biochemistry and Pharmacology 179 dihydroxydiphenyl sulfide (Santonox) and phenyl-2-naphthylamine (PBN). Santonox has no sharp absorption bands in the U V and only a very weak fluorescence. Its phosphorescence, on the other hand, is very strong. PBN can actually be quite well determined by UV spectroscopy, but difficulties arise from the overlapping of spectra if other additives are present in the synthetic material. PBN also shows intense phosphor
escence. Thus a spectrophosphorimetric estimation procedure is obviously suggested for both these compounds.
In the procedure described by Drushel and Sommers, the phosphor
escence of a thin film of the plastic that contains the inhibitor is measured at 77°K. The measurement was carried out with an Aminco-Keirs spectrophosphorimeter to which had been fitted a device for investigat
ing thin luminescent films. The film thickness must be known; it can be found with a micrometer provided the film is not too thin. Because their extinctions of the transmitted light are too great, thicker films do not give linear phosphorescence calibration curves. Also inner filter effects caused by other components present in the polymer become more important with thicker films. Handling the thin films and the need to determine their thicknesses accurately are difficulties in this and similar methods.
In the paper by Drushel and Sommers, the phosphorescence spectra of the inhibitors investigated and the phosphorescence calibration curves for various film thicknesses are given. The accuracy of the method was studied during the determination of Santonox in EPR. Test analyses gave a relative error of 9 %.
4.6. APPLICATIONS IN BIOCHEMISTRY AND PHARMACOLOGY
The first example ever given of the analytical application of phosphor
escence spectra to organic compounds came from the field of bio
chemistry. In 1955 Rybak et al.1 proposed phosphorescence spectroscopy as a method of analysis for amino acids. Their publication, however, contained few experimental details. Since then a series of communica
tions has appeared from various authors concerning the applications of spectrophosphorimetry in biochemistry and pharmacology.
Freed and Vise 2 developed the ideas of Rybak, Lochet, and Rousset1
1 B. Rybak, R. Lochet, and A. Rousset, Compt. Rend. 2 4 1 , 1278 (1955).
2 S. Freed and H. M. Vise, Anal. Biochem. 5, 338 (1963).
further and used spectrophosphorimetry for the determination of the proteolytic enzyme α-chymotrypsin. The phosphorescence of this substance arises from its tryptophan component (CXVI). A mixture of water, methyl alcohol, and ether in the proportions of 5:11:4 by volume was used as solvent, and the measurement was made at 113°K. The reproducibility of the determination was found to depend essentially on the purity of the solvent. This publication also gives the emission and excitation spectra of 7V-acetyl-L-tyrosine ethyl ester (CXVII), which can likewise be spectrophosphorimetrically determined.
CO
- C H2N H2
I
-C—COOH I H CXVI
H CXVIII
HO
CH3
I CO
I NH
CXJ
H H 2—^—COOC2H5
I H CXVII CH2—COOH
CXIX
4.6. Applications in Biochemistry and Pharmacology 1 8 1 Freed and Salmre3 used phosphorescence spectroscopy to characterize several biochemically and pharmacologically important indole deriva
tives. The phosphorescence spectra of indole (CXVIII), indoleacetic acid (CXIX), tryptophan (CXVI), tryptamine (CXX), serotonin (CXXI), and reserpine (CXXII) were examined. The solvent was a methanol-ethanol mixture. The spectra of several of the substances studied could also be obtained in frozen aqueous solutions provided electrolytes were present.
The most important result of this work is that the phosphorescence spectra of the indole derivatives are substantially more characteristic than their fluorescence spectra. The latter consist, at room temperature, of a single broad band the position of which depends only slightly on the structure of the compound. At low temperature there is a hint of vibrational structure, but this is nothing like so well developed as in the phosphorescence spectra, which, in addition, may vary somewhat from compound to compound. Thus although the derivatives investigated cannot be distinguished by their fluorescence spectra, it should be possible to identify them by means of their phosphorescence spectra.
They can in fact also be detected about ten times as sensitively by phos
phorescence as by fluorescence.
We owe some interesting applications of spectrophosphorimetry in biochemistry, pharmacology, and clinical chemistry to Winefordner and his colleagues.4 These authors found that it is frequently possible to determine foreign substances such as drugs and alkaloids in blood serum, plasma, or urine rapidly, accurately, and simply by spectrophosphori
metry. Winefordner and L a t z5 showed this first of all with respect to the quantitative evaluation of aspirin (acetylsalicylic acid) in blood serum and plasma.
The determination of aspirin in blood and other biological material is important in clinical chemistry and is usually carried out colorimetrically by means of the ferric salicylate complex. For this, aspirin is first con
verted into salicylic acid by hydrolysis. The method is liable to error with low concentrations of aspirin, requires a high background correction if the quantity of salicylate is less than 1 0 m g / 1 0 0 ml of serum, and is tedious to carry out. Winefordner's method, on the other hand, is specific for 3 S. Freed and W. Salmre, Science 128, 1341 (1958).
4 J. D. Winefordner, in "Fluorescence and Phosphorescence Analysis" (D. M.
Hercules, ed.), p. 176ff. Wiley (Interscience), New York, 1966.
5 J. D. Winefordner and H. W. Latz, Anal Chem. 35, 1517 (1963).
aspirin and both rapid and accurate over a wide range of concentrations.
The applicability of a spectrophosphorimetric method of estimating aspirin in blood naturally presupposes that the serum and plasma and the substances normally present in them do not phosphoresce at all or do so much more weakly than the aspirin. This question has been studied very thoroughly by Winefordner and Latz. Of the substances investi
gated, thiamine, riboflavin, tyrosine, and tryptophan showed measurable phosphorescence, but cholesterol, bilirubin, thyroxine, uric acid, creatinine, glucose, urea, and vitamin C did not. The amino acid trypto
phan gave the most intense phosphorescence. The intensity of a saturated solution of this compound in EPA is comparable with that of a solution which contains 0.2 mg of aspirin in 100 ml of EPA. The EPA extracts of serum gave broad phosphorescence emissions corresponding closely with that of tryptophan, and the measurements could be reproduced quite well. Chloroform extracts likewise gave only the tryptophan phosphorescence. When Winefordner's method for determining aspirin was applied to aspirin-free samples of serum, the observed phosphor
escence corresponded to an apparent aspirin concentration of 0.5 mg/100 ml of serum. It follows, therefore, from these investigations that the phosphorescence of the aspirin is considerably more intense than that of any other natural component of blood. Therefore, only when estimat
ing relatively low concentrations of aspirin is it necessary to apply any background correction.
The aspirin in blood is hydrolyzed to salicyclic acid at an appreciable rate and hence the influence of salicyclic acid on the aspirin determination must be known. It has been shown that salicyclic acid has a phosphor
escence which is only about one five-hundredth as strong as that of aspirin. It can, therefore, cause no significant interference with the evaluation of aspirin. Winefordner and Latz used for their measurements a spectrophosphorimeter they had built themselves. Their method can, however, be carried over to other similar instruments, such as the Aminco-Keirs spectrophosphorimeter. The white, unfiltered light of a xenon lamp was used for the excitation. Aspirin has a single, broad phosphorescence band with its maximum at 410 m/x. All phosphorescence measurements are carried out with this wavelength. First a phosphor
escence calibration curve is set up to give the intensity of phosphorescence versus concentration of aspirin (in EPA). It covers a range of concentra
tion from 0.01 to 100 mg of aspirin in 100 ml of EPA, and is linear over
4.6. Applications in Biochemistry and Pharmacology 183 2 powers of 10, deviating from linearity at higher concentrations only slightly (see Fig. 34). For the determination of aspirin in blood serum or plasma, 0.4-ml samples are taken in 10-ml glass-stoppered graduated cylinders to which 0.1 ml of concentrated hydrochloric acid and 7.5 ml of chloroform are added. The mixture is shaken vigorously for 30 seconds
Fig. 34. Phosphorescence calibration curve for the determination of aspirin [according to J. D. Winefordner and H. W. Latz, Anal. Chem. 35, 1517 (1963)].
and then the chloroform layer is separated; 1.00 ml of this is transferred to a 10 ml beaker and the chloroform is driven off in a stream of air.
The residue is taken up in 1.00 ml of EPA and the resulting solution is used for the phosphorescence measurement as described above. From the intensity value thus obtained there may be subtracted, if necessary, the phosphorescence blank value of the EPA used and that of an aspirin- free sample of serum or plasma. From the corrected value the concen
tration of aspirin in the EPA is obtained with the help of the calibration curve and is then multiplied by 18.75 to obtain the concentration of aspirin (in milligrams) in 100 ml of plasma or serum.
a. In Citrated Plasma Aspirin in 100 ml plasma (mg) Relative
standard
Found deviation Recovery
Given (mean of 4 or 5 analyses) (%) (%)
1.006 0.95 8 95
5.00* 5.00 13 100
10.00* 10.10 8 101
25.00* 23.00 5 92
50.00* 43.00 10 86
b. In Pooled Serum Aspirin in 100 ml serum (mg)
Found Recovery
Given (mean of 3 analyses)
(%)
1.0 1.1 110
1.5* 2.0 133
5.0 4.2 84
7.5 7.4 99
10.0 10.3 103
15.0* 14.0 93
25.0 26.0 104
37.0* 28.0 76
50.0 41.0 82
a J. D. Winefordner and H. W. Latz, Anal. Chem. 35, 1517 (1963).
* These samples also contained an equal amount of salicylic acid.
The accuracy of the method has been established by test analyses. For these, known quantities of aspirin were weighed into aspirin-free serum or plasma a;nd the mixtures were analyzed in the way described above.
The results of these test analyses have been collected in Table 34. They TABLE 34 Test Analyses for the Determination of Aspirin in Blood
Plasma and Seruma
4.6. Applications in Biochemistry and Pharmacology 185 show a relative standard deviation of 5-10%. The limits of detection for the method lie at about 0.2 mg of aspirin per 100 ml of serum or plasma. The time needed for a complete analysis amounted to less than
10 minutes.
As Winefordner and T i n6 have shown, spectrophosphorimetry can also be brought into use for the quantitative determination of numerous other medically important substances in biological media. These authors have described in detail methods for the estimation of procaine (CXXIII), phénobarbital (CXXIV), cocaine (CXXV), and chlorpromazine in blood serum as well as of cocaine and atropine (CXXVI) in urine. In each case the substance is extracted from the biological fluid with chloro
form or ether, the solvent is evaporated, and the residue dissolved in EPA, and the resulting solution measured phosphorimetrically.
As in the case of aspirin, the phosphorescences of the pharmaceuticals investigated by Winefordner and T i n6 are substantially more intense than the background phosphorescence of the blood serum or plasma.
The same is true with urine if the extraction is performed with ether and the p H value is kept greater than 5. Possible interference from the presence of metabolic products of the drugs being investigated was thoroughly discussed at the same time. The only metabolite of procaine that shows phosphorescence is /?-aminobenzoic acid. Addition of small quantities of p-aminobenzoic acid to the procaine caused no significant change in the procaine analysis. The reason is obviously that the p- aminobenzoic acid has a very small distribution coefficient between
6 J. D. Winefordner and'M. Tin, Anal. Chim. Acta 32, 64 (1965) ; see also H. A. Moye and J. D. Winefordner, / . Agr. Food Chem. 13, 533 (1965).
C X X I I I C X X I V
C X X V C X X V I
chloroform and water at the p H value of 10 used in the analysis. Under these conditions, therefore, /7-aminobenzoic acid is not extracted at all from the blood serum by the chloroform and so does not appear in the solution for analysis. The behavior of the possible metabolic products of the other drugs examined is very similar.
The analytical procedures described by Winefordner and Tin refer solely to the determination, in each case, of one particular drug in the blood or urine. In practice several drugs will frequently be present. In many such cases the desired objective will be achieved by applying the phosphorimetric techniques for the analysis of many-component systems.
In Table 35 there are collected the phosphorescence excitation wave
lengths, key bands, limits of detection, and relative standard deviations for the determination of procaine, cocaine, phénobarbital, atropine, and chlorpromazine in urine or blood.
In a further contribution Winefordner and T i n7 have published TABLE 3 5 Spectrophosphorimetric Determination of a Number of Drugs in
Urine and Blooda
Relative Excitation Key Detection standard wavelength band limit6 deviation0
Compound Medium (m/x) (m/x) (gm/ml)
(%)
Procaine (CXXIII) Blood 310 430 1 χ 10"8 2-5 Cocaine (CXXV) Blood 240 400 1 χ ΙΟ"8 3-10
Cocaine Urine 240 400 1 χ ΙΟ"8 2-10
Phénobarbital (CXXIV) Blood 240 380 1 χ 10-7 2-3 Atropine (CXXVI) Urine 240 380 1 χ 10-7 2-3
Chlorpromazine Blood 320 490 — 3-4
hydrochloride
a J. D. Winefordner and M. Tin, Anal. Chim. Acta 3 1 , 239 (1964); 3 2 , 64 (1965).
b The detection limits quoted refer to solutions in ethanol.
c To determine the relative standard deviations the test samples were each investi
gated five times. The standard deviation varies with the range of concentrations, so the figures given above are limiting values.
7 J. D. Winefordner and M. Tin, Anal. Chim. Acta 3 1 , 239 (1964); see also H. C.
Hollifield and J. D. Winefordner, Talanta 14, 103 (1967).
4.6. Applications in Biochemistry and Pharmacology 187 phosphorescence data for numerous medically important compounds without specifying the methods of estimating them in biological media.
The possibility of analyses of this kind has, however, been discussed and the appropriate techniques follow by analogy with those described in the other publications of Winefordner. Alcohol was used as the solvent in these measurements because the solubility of many drugs in alcohol is considerably greater than in EPA. Table 36 gives the phosphorescence excitation wavelengths, phosphorescence bands, lifetimes, and limits of detection for some of the compounds examined by Winefordner and Tin.7
TABLE 36 Spectrophosphorimetric Determination of Various Drugsa
Excitation Detection
wavelength Bands0 Lifetime limit
Compound6 (m/x) (mjit) (sec) (gm/ml)
Mebaral 240 380 2.2 1 χ 10-8
Rutonal 240 380 2.5 2 χ ΙΟ"8
Benzocaine 310 430, 420, 440 5.3 7 χ ΙΟ"9
/7-Aminobenzoic acid 310 430, 420, 440 3.2 4 χ ΙΟ"9 Butacaine sulfate 310 430, 420, 440 5.7 5 χ 10-8 Cyclaine hydrochloride 240, 290 400, 410, 370 2.4 6 χ 10-9 Metycaine hydrochloride 240, 290 400, 410, 370 2.7 6 χ 10-9 Benzoic acid 240, 290 400, 410, 370 2.3 5 χ 10-9 Quinidine sulfate 340, 250 500, 470 1.3 5 χ ΙΟ"8 Quinine hydrochloride 340, 250 500, 470 1.3 4 χ ΙΟ"8
Lidacaine 265, 240 400 1.1 1.2 χ 10~6
Caffeine 285, 245 440 2.0 2 χ 10-7
Ephedrine 225, 410 390 3.6 2 χ 10-7
Phenylephrine hydrochloride 290, 240 390 2.4 1 χ ΙΟ"8 Tronothane hydrochloride 300, 240 410 1.2 2 χ ΙΟ"8
Cinchophen 350, 270 520, 490 0.8 2 χ ΙΟ"8
Physostigmine sulfate 315, 260 420 3.6 3 χ 10-8
Chlortetracycline 280 410 2.7 5 χ 10-8
a J. D. Winefordner and M. Tin, Anal. Chim. Acta 31, 239 (1964).
b The compounds are arranged according to their structural similarities and the relationships between their spectral characteristics.
c The first band given is suitable for use as key band, and the phosphorescent lifetime and limits of detection have been determined for this.
Excitation Detection wavelength Bands Lifetime limit
Compound (m/x) (m/x) (sec) (gm/ml)
Codeine 275 505 0.3 1 X ΙΟ"8
Morphine 285 500 0.25 1 X ΙΟ"8
Papaverine hydrochloride 245, 305, 360 455, 480 1.5 5 X 1 0- i o Yohimbine hydrochloride 290 410 7.4 1 X 10⁻⁸
Apomorphine hydrochloride 320 440, 470 3.1 1 X 10⁻⁹
Narceine 290 440 0.5 1 X 10⁻⁷
Thebaine 315 500 1.0 1 X 10⁻⁶
Brucine 305 435 0.88 1 X 10⁻⁷
Strychnine phosphate 220, 290 325, 440 1.2 5 X 10⁻⁵
Morphine sulfate 265 460 0.75 1 X 10⁻⁵
Narcotine 315 440 0.5 1 X 10⁻⁸
a H. C. Hollifield and J. D. Winefordner, Talanta 12, 860 (1965).
b The data for morphine sulfate and narcotine relate to acidified alcoholic solutions ; all the rest, to neutral alcoholic solutions. Italics indicate the most intense band in each case.
An investigation by Hollifield and Winefordner8 is particularly concerned with the phosphorescence of alkaloids. The quantitative determination of alkaloids in medicines, plants, and biological media is an analytical problem of medical and forensic importance. Here spectrophosphorimetry presents itself as a very useful method of investigation. The phosphorescence quantum yields of the alkaloids are relatively high and the limits of detection are correspondingly low. It was found that all the alkaloids examined could be detected more sensitively in neutral than in either acid or alkaline solution. A limitation of the method arises from the fact that both the excitation spectra and the phosphorescence spectra consist of only a few broad bands that easily become superposed in mixtures. In analyzing such mixtures phosphori
metrically, it will therefore frequently be necessary first to separate the individual components from each other by suitable methods such as thin-layer chromatography, and to employ phosphorimetry only for
8 H. C. Hollifield and J. D. Winefordner, Talanta 12, 860 (1965).
TABLE 3 7 Spectrophosphorimetric Determination of Various Alkaloids**b
4.7. Applications in Food Chemistry and Related Fields 189 determining quantitatively the pure compounds isolated. However, one can conceive of mixtures of alkaloids that can be analyzed entirely by phosphorimetry through suitable choice of excitation wavelengths and key bands.
Excitation wavelengths, phosphorescence bands (in ethanol), phos
phorescent lifetimes, and limits of detection (in grams per milliliter) are given in Table 37 for the alkaloids investigated by Hollifield and Wine
fordner.8
4.7. APPLICATIONS IN F O O D CHEMISTRY AND RELATED FIELDS
McCarthy and Winefordner1 have reported an interesting application of spectrophosphorimetry to food chemistry: the rapid, quantitative determination of biphenyl in oranges.
Biphenyl is frequently used as a fungicide for citrus fruits to prevent perishing during storage and transportation and is found not only on the peel but also in the flesh. As in many countries limits of tolerance for biphenyl in citrus fruits are specified, a rapid and accurate method for its estimation is of great importance. M a n y procedures have been described in the literature. In all of them steam distillation is employed to isolate the fungicide from the fruit and UV and IR spectroscopy as well as colorimetric and gas chromatographic techniques are then used for the quantitative determination of the compound in the distillate.
There are many shortcomings in all these procedures : the amounts of test material required are relatively large, for some processes up to 2 pounds for a single estimation; the time taken for the analyses is quite long because of the steam distillation, in some cases up to 48 hours ; the accuracy of many of the procedures that are applied leaves much to be desired and they are not all specific. In contrast the method described by McCarthy and Winefordner1 represents a very important advance.
For the isolation of biphenyl from the fruit, Winefordner's method substitutes extraction with ether for steam distillation. Normally the analyses can be carried out even on a single orange, although it is desirable to use several in order to obtain a better average. The oranges are first quartered and then separated into pulp and juice on the one hand and peel on the other. The material is homogenized and then the
1 W. J. McCarthy and J. D. Winefordner,/. Assoc. Offic. Agr. Chemists48,915 (1965).