0139–3006 © 2019 The Author(s) DOI: 10.1556/066.2019.48.4.9
CLASSICAL AND CORRELATIVE ANALYTICAL METHODS FOR ORIGIN IDENTIFICATION OF HUNGARIAN HONEYS
Zs. Bodora,b, Cs. Benedekb*, T. Kaszaba, J.-L. Zinia Zaukuua, I. Kertésza, and Z. Kovacsa
aDepartment of Physics and Control, Faculty of Food Science, Szent István University, H-1118 Budapest, Somlói út 14–16. Hungary
bDepartment of Dietetics and Nutrition, Faculty of Health Sciences, Semmelweis University, H-1088 Budapest, Vas utca 17. Hungary
(Received: 19 March 2019; accepted: 10 June 2019)
Honey is produced by honeybees from nectar, sap of plant parts, or the juicy material secreted by sucking insects living on trees. It is rich in nutritionally useful components, the occurrence of which highly depends on the botanical and geographical origin of honey. Our goal is to develop a new, rapid, and accurate combination of analytical methods for identification of botanical and geographical origin.
Physicochemical parameters (pH, electrical conductivity, moisture, and ash content), colour (L*a*b*), and antioxidant properties were determined in addition to correlative techniques, such as electronic tongue and near infrared spectroscopy. For the statistical evaluation ANOVA, principal component analysis, and linear discriminant analysis were applied.
Results showed significant differences (P<0.05) in physicochemical properties, colour, and antioxidant capacity according to the botanical origin of honeys. Electronic tongue (ET) and near infrared spectroscopy (NIR) techniques were useful in the identification of the botanical and geographical origin, showing generally good accuracy.
The physicochemical parameters are important and can serve as reference methods, completing NIR and ET as target techniques, which are promising, but need further improvement for the determination of honey origin.
Keywords: honey, antioxidant, electronic tongue, NIR, authenticity
According to the EU legislation, honey is produced by honeybees (Apis mellifera) from nectar, sap of plants, or honeydew (European Council, 2001). It is rich in nutrients like vitamins, antioxidants, organic acids, minerals, and enzymes, although the occurrence of these components depends on the botanical and geographical origin of the product (Anklam, 1998). The valuable nutritional content and high market price of honey make it a target of various forms of adulteration globally. Common honey adulteration practices include its blending with sugar syrups, undeclared mixing of honeys from different geographical origins, or even feeding bees with sugars during the collecting period (Zábrodská & Vorlová, 2014).
Current analytical methods such as HPLC, NMR, IRMS, or ICP-OES are useful in tracking some of these fraudulent activities (Aries et al., 2016; Spiteri et al., 2016), nevertheless, they remain relatively expensive, time consuming, and require high qualification and practice.
Furthermore, they are not well standardized for the continuously developing trends of honey adulteration.
Origin identification of honey has often been regarded as a complex task, as legislations for compositional limits or ranges of physicochemical parameters (like electrical conductivity, pH, sugar composition, etc.) are not available for the different unifloral honeys in the
* To whom correspondence should be addressed.
Phone: +36 1 486 4822; e-mail: benedek.csilla@se-etk.hu
478
European Union. Only national directives are available in some countries like Germany, Italy (Thrasyvoulou et al., 2018), or in Hungary (for acacia and linden honey) (Hungarian Food Book, 2009). The physicochemical properties might also be used for the determination of botanical origin of honeys, when they are applied as a multivariable, combined data set for analysis. The individual parameters cannot give satisfactory differentiation (Anklam, 1998).
Moreover, the determination of these parameters is also time-consuming, quite expensive, and frequently requires many chemical reagents. Therefore, there is an urgent demand for an accurate control system and a well-defined, rapid universal method for monitoring the authenticity of honey. Near infrared spectroscopy (NIR) and electronic tongue (ET) (Wei et al., 2009; Wei & Wang, 2011; Di Rosa et al., 2018) are rapid and easy-to-use techniques with a potential to fulfil these requirements.
NIR was successfully used for discrimination of Chinese honeys based on their botanical origin: discriminant analysis showed 87.4 and 85.3% accuracy for the recognition (training) and prediction (validation) abilities for five botanical groups (Chen et al., 2012). Gan and co-workers (2016) used NIR spectroscopy and electronic tongue for the classification of botanical origin and detection of adulteration of honeys. Their results showed that recognition and prediction abilities were 100% and >80%, based on the results of both NIR and electronic tongue.
The aim of our study was to build up a database based on the physicochemical, colour, and antioxidant properties of different unifloral honeys to support the data available for Hungarian honeys. On the other hand, the second goal was to assess the application possibilities of NIR and ET as rapid, correlative methods in the determination of botanical and geographical origin of honey.
1. Materials and methods 1.1. Honey samples
In our studies more than 100 honeys from different botanical and geographical origins were collected to build up a robust database. In this work four different types, including eleven acacia (Robinia pseudoacacia), four rape (Brassica napus), five chestnut (Castanea sativa), and six sunflower (Helianthus anuus) honeys, which are commonly consumed in Hungary, were analysed.
Acacia samples originated from Hajdú-Bihar, Heves, Jász-Nagykun-Szolnok, Nógrád, Pest, and Szabolcs-Szatmár-Bereg counties, rape samples from Békés, Heves, and Jász- Nagykun-Szolnok counties, chestnut samples from Zala, Vas, Northern-Mountains region, and Győr-Moson-Sopron counties, and sunflower samples from Békés, Heves, and Nógrád counties of Hungary.
1.2. Physicochemical, colour, and antioxidant parameters of honey
Physicochemical parameters (ash content, electrical conductivity, pH, and total soluble dry matter) were determined according to the International Honey Commission guidelines (Bogdanov, 2009), as quality indicators. Measurements were performed in three replicates per sample, resulting in a total of 78 observations for the whole sample set.
Antioxidant properties were characterized by the measurement of total polyphenol content (TPC, expressed as gallic acid equivalents, GAE), cupric ion reducing antioxidant
capacity (CUPRAC, expressed as Trolox equivalents, TE), and ferric reduction antioxidant power (FRAP, expressed as ascorbic acid equivalents, AAE), using a Thermo Helios-α spectrophotometer (Singleton & Rossi, 1965; Benzie & Strain, 1996; Prior et al., 2005;
Apak et al., 2008). Analyses were performed in five replicates per sample, resulting in 130 observations for the whole sample set.
Colorimetric measurements were done in CIE L*a*b* tristimuli coordinate system with a Konica Minolta CR410 colorimeter. For each sample five replicates were obtained, resulting 130 observations for the whole sample set.
1.3. Rapid techniques
As rapid measurement techniques, electronic tongue (ET) and near infrared spectroscopy (NIR) were applied for the analysis of the honey samples. Transflectance spectra (1000–2500 nm) were recorded with the spectral step of 2 nm with a PMC Spectralyzer 10-25 infrared spectrophotometer. The acquisition of spectra was performed with Spectralyzer Operating Software, version 1.44. (METRIREP, Hungary). Approximately 5 g of honey sample was placed in ring cup cuvette and scanned after standard per each sample. The sample set was scanned in two runs, on two different consecutive days. At both runs, samples were recorded in randomized order. Three consecutive spectra were recorded for each sample at each time.
Therefore, one sample was represented by six spectra in total from the two measurement days, resulting 156 spectra for the whole sample set.
ET measurements were performed with an Alpha ASTREE (AlphaM.O.S., Toulouse, France) electronic tongue composed of seven ISFET sensors developed for food applications (ZZ, CA, BB, GA, HA, JB, and JE). The honey samples were diluted with distilled water prior to the ET tests: 10 g of honey was weighed and filled up to 100 ml in a volumetric flask.
Honeys were tested three times on three independent days with nine consecutive measurements every day resulting 18 values for each sample and a total of 468 observations.
1.4. Statistical analysis
The mean and standard deviation were determined for each botanical group for the physicochemical, antioxidant, and colour parameters. Significant differences between different botanical groups were determined by ANOVA method, followed by Tukey’s post hoc test at P<0.05 significance level.
Multivariate statistical methods were used for the evaluation of the results of NIR and ET measurements after the relevant pre-treatment of the data, for both measurements. Outliers were identified based on the exploratory data evaluation (principal component analysis – PCA) and omitted before the further data evaluation, resulting 124 spectra for the NIR measurements and 288 observations in total for the electronic tongue data set. As raw data pre-treatment, drift correction was applied in the case of ET to decrease the impact of the sensor drift during different days (Szöllősi, 2015). In the case of NIR, spectra in the range 1100–1800 nm were evaluated by chemometrics. Savitsky–Golay smoothing (2nd order polynomial and 21 points) and multiplicative scatter correction (MSC) were applied on raw spectra to reduce noise and baseline variation. PCA was also used for the pattern recognition of results of ET and NIR, with special attention to the separation of botanical and geographical origin of honeys. Linear discriminant analysis (LDA) was applied to build models for the classification of botanical and geographical groups based on the results of the ET (threefold cross validation) and NIR (five-fold cross validation). During statistical evaluation of the
480
data, Microsoft Excel 365 was used for the descriptive statistics, while R-project 3.5.2 software with Aquap2 package was used for the chemometrical evaluation of the NIR and ET results.
2. Results and discussion
2.1. Results of physicochemical, colour, and antioxidant measurements of honey
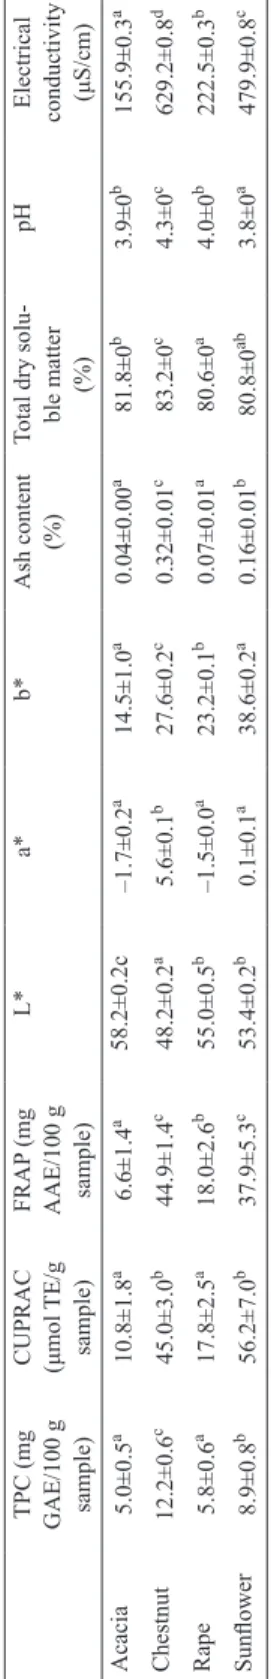
Table 1 shows the results of the physicochemical and colour parameters for each botanical type. The lowest antioxidant capacity, ash content, and electrical conductivity were obtained in acacia honeys – the results of these parameters were significantly lower than in the case of chestnut and sunflower honeys. Acacia honeys were also the lightest (L*), less yellowish (b*), and had the lowest a* value in the green range. These results are in accordance with the literature, where acacia honey had the lowest antioxidant capacity and highest L*, while chestnut honeys had higher antioxidant capacity and lower L* (Bertoncelj et al., 2007; Gül
& Pehlivan, 2018).
Rape honeys showed the highest pH value and had significantly lower antioxidant properties, electrical conductivity, and ash content than sunflower and chestnut honeys.
Sunflower honeys had significantly higher yellow colour than the other honey types, while they had significantly lower FRAP and TPC values, electrical conductivity, and ash content than chestnut honeys. These results are also in good agreement with the data acquired by the IHC group (Oddo & Piro, 2004).
2.2. Identification of botanical and geographical origin of honey by near infrared spectroscopy
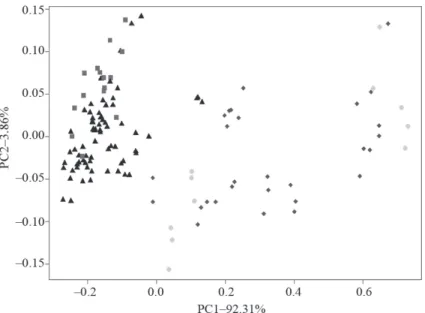
The PCA score plots of evaluated spectra of honey showed the best separation of points of sunflower and rape honeys from the groups of chestnut and acacia honeys (Fig. 1).
Fig. 1. PCA score plots of results of NIR spectra by botanical origin of honey after outlier detection (n=124) : Rape; : Chestnut; : Acacia; : Sunflower –0.2
Table 1. Results of physicochemical and colour parameters of the 26 honey samples TPC (mg GAE/100 g sample)
CUPRAC (μmol TE/g sample)
FRAP (mg AAE/100 g sample)
L*a*b*Ash content (%)Total dry solu- ble matter (%)
pH
Electrical conductivity (μS/cm) aaaaaabbaAcacia58.2±0.2c5.0±0.510.8±1.86.6±1.4–1.7±0.214.5±1.00.04±0.0081.8±03.9±0155.9±0.3 cbcabccccdChestnut 12.2±0.645.0±3.044.9±1.448.2±0.25.6±0.127.6±0.20.32±0.0183.2±04.3±0629.2±0.8 aabbabaabbRape 5.8±0.617.8±2.518.0±2.655.0±0.5–1.5±0.023.2±0.10.07±0.0180.6±04.0±0222.5±0.3 bbcbaababacSunflower 8.9±0.856.2±7.037.9±5.353.4±0.20.1±0.138.6±0.20.16±0.0180.8±03.8±0479.9±0.8 Mean ± standard deviation. Superscript letters show the significant differences based on the results of Tukey’s post hoc method (P<0.05)
482
This separation can be seen through the first principal component (PC1), which describes 92.31% of the total variance. The PCA loadings (Fig. 2) showed that 1584 nm, 1444 nm, and 1368 nm had the highest role in the formation of PC1. These peaks belong to the 1st overtone:
peak at 1444 nm can be assigned to the free water content of the samples, while peak at 1584 nm could show the difference in the sugar composition (Bázár et al., 2016.)
Fig. 2. PCA loadings (PC1-PC2) of results of NIR spectra by botanical origin of honey ––––: PC 1 (92.316%) ; ----: PC 2 (3.864%)
These results are in accordance with our results obtained in the water content measurement: rape and sunflower honeys had higher water content, and their sugar structure was different from the chestnut and acacia honeys, which can be due to their crystallized structure. It is well known that the main determining factor in crystallization of honeys is their crystal structure (Bogdanov, 1993).
LDA classification models built for the classification of the different botanical origin of the honey samples are presented in Figure 3.
Similarly to PCA, root 1 shows the separation of sunflower and rape honeys from chestnut and acacia, nonetheless, based on root 2, a tendency of separation can also be observed for chestnut and acacia honeys. The LDA model presented average recognition and prediction abilities of 88.12% and 62.52%, respectively, for the four groups. The best results were obtained for acacia honeys: LDA model recognizes 97.9% and predicts correctly 92.4%
of the acacia honeys, misclassifying 7.6% as belonging to chestnut honeys. This minimal overlapping with the chestnut honeys is caused by the crystal structure: these two honey types were not crystallized like sunflower and rape samples, which data points separated well enough from the chestnut and acacia honeys. The model recognizes 96.4% and predicts 72.3% of sunflower samples correctly, misclassifying 3.6% and 27.7% to rape honeys. On the other hand, misclassification between the rape and sunflower honeys can be explained by their similar crystallized structure. The results show that NIR instrument was sensitive to the stage of crystallization patterns. Our results lag behind those mentioned in the literature: e.g.
Chen and co-workers (2012) reached better classification results from 250 spectra of five different types of unifloral honey samples (acacia, jujube, vitex, rape, and linden), resulting in 85.3% correct prediction using FT-NIR spectrometer (Antaris, Thermo Nicolet, USA) in
the 10000 cm–1 to 4200 cm–1 (1000–2380 nm) spectral range. The weaker classification results obtained in our research can be attributed to the lower accuracy of the instrument and the narrower wavelength range used.
Fig. 3. LDA score plots of results of NIR spectra for the classification of unifloral honey types after outlier detection (n=124)
: Rape; : Chestnut; : Acacia; : Sunflower; : Rape validation; : Chestnut validation;
: Acacia validation; : Sunflower validation
PCA score plot including all botanical groups showed no clear separation based on the geographical origin, this pointing to the higher discriminative power of botanical origin over the geographical one. Therefore, LDA models were built for the individual botanical groups of honey separately, resulting in better discrimination of the groups of honey samples obtained from different parts of Hungary. Origin of rape honeys (n=11) was classified correctly. For the origin of sunflower (n=22) samples, LDA model provided average recognition and prediction abilities of 100% and 82.3%, respectively (mutual misclassification was found only for honeys from Békés and Heves). For chestnut (n=15) honeys, recognition and prediction abilities of the LDA models were 98.4% and 75.0%, respectively (mutual misclassification was found only for honeys from Zala and the region of the Northern mountains). In the case of acacia (n=49) honeys, classification accuracy was not as good as for the previous botanical types, average recognition and prediction abilities were significantly lower (68.6% and 46.7%, respectively) and mutual misclassification was found between each of the groups from Hajdú-Bihar, Heves, Jász-Nagykun-Szolnok, Nógrád, Pest, and Szabolcs- Szatmár-Bereg counties. This can be explained on the one hand by the fact that acacia honeys are poor in nutritionally active components (Bertoncelj et al., 2007), on the other hand that the samples originated mostly from the eastern and middle part of Hungary, where the climate and the topographic conditions are not substantially different.
484
2.3. Identification of botanical and geographical origin of honey by electronic tongue PCA results of the electronic tongue measurements of the tested honeys showed some separation tendencies according to both their botanical and geographical origins, but the dominance of botanical origin over the geographical one was observed (Fig. 4).
Fig. 4. PCA score plots of results of electronic tongue by botanical origin of honey after outlier detection (n=288) : Rape; : Chestnut; : Acacia; : Sunflower
LDA results of electronic tongue for the classification of the honey samples from different botanical origin (Fig. 5.) presented average recognition and prediction abilities of 92.1% and 91.8%, respectively. The model classified correctly the chestnut honeys, reflecting thus the rich aroma of these honeys. Second best results were obtained for sunflower honeys;
LDA model recognized 99.1% of sunflower honeys misclassifying 0.9% to rape honeys. It predicts correctly 98.2%, misclassifying only 1.8% as belonging to rape samples. For acacia honeys recognition and prediction abilities were 92.0% and 91.5%, respectively, some samples were misclassified as being rape honeys. Rape samples were classified correctly in 77.5% (misclassifying 22.5% belonging to acacia honeys) during both the model building and validation. The overlapping between rape and acacia honeys can be explained by their relatively weak aroma and similar nutrient content.
The classification based on geographical origin provided higher accuracy when the geographical locations of the tested honey samples were far from each other and thus climatic conditions were different. The geographical origin identification of chestnut honeys (n=66) presented 100% correct classification for the four areas. LDA model of rape honeys (n=49) also resulted in 100% correct classification for the three geographical groups. Classification model for sunflower (n=55) honeys resulted again in high prediction and recognition abilities of 100 and 97.25% (mutual misclassification was found for honeys from Békés and Nógrád county, while honeys from Heves were classified correctly). Similarly to NIR results, the
lowest classification accuracy was obtained in the case of acacia honeys (n=118), where the prediction and recognition abilities were 72.7% and 63.4%, respectively, and misclassifications were found for each geographical origin.
Fig. 5. LDA score plots of results of electronic tongue for the classification of unifloral honey types after outlier detection (n=288).
: Rape; : Chestnut; : Acacia; : Sunflower; : Rape validation; : Chestnut validation;
: Acacia validation; : Sunflower validation
3. Conclusions
Physicochemical and colour attributes of honeys showed significant differences according to botanical type. These results are promising in identification of botanical origin of the honey types investigated. Even though these are cheap and affordable measurements, they are time- consuming and can only be applied in authentication as a complex, multivariable dataset, requiring a high number of samples. On the other hand, these attributes can be used as valuable descriptive reference parameters for different unifloral honeys, supporting thus the creation of calibration models for NIR and ET.
Near infrared spectroscopy was able to classify the different botanical groups: average recognition and prediction abilities were 88.12% and 62.52%, respectively. Our results suggest that geographical origin of honey can be identified reliably only if models are built for the individual floral types. When botanical types were evaluated separately, high accuracy was obtained for identification of geographical origin of sunflower, rape, and chestnut honeys.
Electronic tongue provided better results for the classification of botanical groups than NIR, average recognition and prediction abilities were above 90%. It was also applicable for determination of geographical origin: models of rape, sunflower, and chestnut honeys provided accuracies higher than 90%.
486
Further enlargement of the honey database is envisaged to improve the performance of differentiation according to both floral and geographical origin of honeys, exploring the potential of NIR and ET as rapid and affordable analytical tools.
*
Supported by the ÚNKP-18-4, ÚNKP-19-4 (Zoltan Kovacs) and ÚNKP-19-3 (Zsanett Bodor) New National Excellence Program of the Ministry for Innovation and Technology, the Bolyai János Scholarship of the Hungarian Academy of Sciences (ZK) and the Doctoral School of Food Science, Szent István University (ZsB, JLZZ). The project is supported by the European Union and co-financed by the European Social Fund (grant agreement no.
EFOP-3.6.3-VEKOP-16-2017-00005). This research was supported by the Higher Education Institutional Excellence Program (20430-3/2018/FEKUTSTRAT) awarded by the Ministry of Human Capacities within the framework of plant breeding and plant protection research at Szent István University.
References
Anklam, E. (1998): A review of the analytical methods to determine the geographical and botanical origin of honey.
Food Chem., 63, 549–562.
Apak, R., Güçlü, K., Özyürek, M. & Çelik, S.E. (2008): Mechanism of antioxidant capacity assays and the CUPRAC (cupric ion reducing antioxidant capacity) assay. Microchim. Acta, 160, 413–419.
Aries, E., Burton, J., Carrasco, L., De Rudder, O. & Maquet, A. (2016): Scientific support to the implementation of a Coordinated Control Plan with a view to establishing the prevalence of fraudulent practices in the marketing of honey. JRC Technical Reports. JRC104749, 38 pages.
Bázár, G., Romvári, R., Szabó, A., Somogyi, T., Éles, V. & Tsenkova, R. (2016): NIR detection of honey adulteration reveals differences in water spectral pattern. Food Chem., 194, 873–880.
Benzie, I.F.F. & Strain, J.J. (1996): The ferric reducing ability of plasma (FRAP) as a measure of “antioxidant power”: The FRAP assay. Anal. Biochem., 239(1), 70–76.
Bertoncelj, J., Doberšek, U., Jamnik, M. & Golob, T. (2007): Evaluation of the phenolic content, antioxidant activity and colour of Slovenian honey. Food Chem., 105, 822–828.
Bogdanov, S. (1993): Liquefaction of honey. Apiacta, 28(1), 4–10.
Bogdanov, S. (2009): Harmonised methods of the International Honey Commission. International Honey Commission (IHC), (5), 63 pages.
Chen, L., Wang, J., Ye, Z., Zhao, J., Xue, X., … & Sun, Q. (2012): Classification of Chinese honeys according to their floral origin by near infrared spectroscopy. Food Chem., 135, 338–342.
European Council (2001): Council Directive 2001/110/EC of 20 December 2001 relating to honey. Official Journal, L 010, 12/01/2002, pp. 0047–0052.
Di Rosa, A.R., Leone, F., Scattareggia, C. & Chiofalo, V. (2018): Botanical origin identification of Sicilian honeys based on artificial senses and multi-sensor data fusion. Eur. Food Res. Technol., 244(1), 117–125.
Gan, Z., Yang, Y., Li, J., Wen, X., Zhu, M., … & Ni, Y. (2016): Using sensor and spectral analysis to classify botanical origin and determine adulteration of raw honey. J. Food Eng., 178, 151–158.
Gül, A. & Pehlivan, T. (2018): Antioxidant activities of some monofloral honey types produced across Turkey.
Saudi J. Biol. Sci., 25, 1056–1065.
Hungarian Food Book (2009): Directive 2-100. Honey with disctinctive quality indication.
Oddo, L.P. & Piro, R. (2004): Main European unifloral honeys: Descriptive sheets. Apidologie, 35, S38–S81.
Prior, R.L., Wu, X. & Schaich, K. (2005): Standardized methods for the determination of antioxidant capacity and phenolics in foods and dietary supplements. J. Agr. Food Chem., 53, 4290–4302.
Singleton, V.L. & Rossi, J.A. (1965): Colorimetry of total phenolics with phosphomolybdic-phosphotungstic acid reagents. Am. J. Enol. Viticult., 16(3), 144–158.
Spiteri, M., Dubin, E., Cotton, J., Poirel, M., Corman, B., … Rutledge, D. (2016): Data fusion between high resolution1H-NMR and mass spectrometry: a synergetic approach to honey botanical origin characterization.
Anal. Bioanal. Chem., 408(16), 4389–4401.
Szöllősi, D. (2015): Analysis of taste interactions with the electronic tongue. PhD. thesis. Corvinus University of Budapest, 20 pages.
Thrasyvoulou, A., Tananaki, C., Goras, G., Karazafiris, E., Dimou, M., … & Gounari, S. (2018): Legislation of honey criteria and standards. J. Apicult. Res., 57(1), 88–96.
Wei, Z. & Wang, J. (2011): Classification of monofloral honeys by voltammetric electronic tongue with chemometrics method. Electrochim. Acta, 56(13), 4907–4915.
Wei, Z., Wang, J. & Liao, W. (2009): Technique potential for classification of honey by electronic tongue. J. Food Eng., 94(3–4), 260–266.
Zábrodská, B. & Vorlová, L. (2014): Adulteration of honey and available methods for detection – A review. Acta Vet. Brno, 83(10), S85–S102.
Open Access statement. This is an open-access article distributed under the terms of the Creative Commons Attri- bution 4.0 International License (https://creativecommons.org/licenses/by/4.0/), which permits unrestricted use, distribution, and reproduction in any medium, provided the original author and source are credited, a link to the CC License is provided, and changes – if any – are indicated. (SID_1)