LWT - Food Science and Technology 149 (2021) 111859
Available online 5 June 2021
0023-6438/© 2021 The Authors. Published by Elsevier Ltd. This is an open access article under the CC BY license (http://creativecommons.org/licenses/by/4.0/).
Colour of honey: can we trust the Pfund scale? – An alternative graphical tool covering the whole visible spectra
Zsanett Bodor
a, Csilla Benedek
b,*, Agnes Urbin ´
c, D ´ aniel Szab ´ o
d, L ´ aszl ´ o Sipos
daHungarian University of Agriculture and Life Sciences, Institute of Food Science and Technology, Department of Physics and Control, 14-16 Soml´oi Street, Budapest, 1118, Hungary
bSemmelweis University, Faculty of Health Sciences, Department of Dietetics and Nutrition, 17 Vas Street, Budapest, 1088, Hungary
cBudapest University of Technology and Economics, Faculty of Mechanical Engineering, Department of Mechatronics, Optics and Mechanical Engineering Informatics, M˝uegyetem Street, Budapest, 1111, Hungary
dHungarian University of Agriculture and Life Sciences, Institute of Food Science and Technology, Department of Postharvest, Supply Chain, Commerce and Sensory Science, 35-43 Vill´anyi Street, Budapest, 1118, Hungary
A R T I C L E I N F O Keywords:
Honey Colour
Transmission spectra Pfund
CIE L*a*b*
A B S T R A C T
Honey is popular and versatile nutraceutical product, widely used as a sweetener. Its sensory properties, determined by the botanical origin, play a high role in consumers’ decision. Among these, colour is an important, often price-defining property. Colour evaluation of honey can be done by different ways, the most commonly known being the Pfund scale, but Lovibond scale or spectral analysis are used as well. The Pfund method pro- vides a specific evaluation scale for honeys, however, this method is not able to detect slight differences and it also has some deficiencies.
Our aim was to provide some examples proving the shortages of the present methodology for determination of honey colour and suggest a solution that could qualify as a possible standardized method. A template providing all the calculations (Pfund value, L*a*b*, C*ab, h◦ab, ΔE*ab, ΔC* ab, Δh*ab, ΔH*ab, ΔL*, Δa*, Δb*) based on the UV-VIS transmission spectra, comparing the results of honey samples is attached. The experiment revealed the drawbacks of the Pfund scaling system. We provide an alternative analytical method that can deliver more details and information on honey colour and could overcome the deficiencies of the present protocols.
1. Introduction
Honey, is an important product worldwide that has been appreciated for its nutritional and medicinal value. According to the provisions of the Codex Alimentarius and the European Council, honey is produced by honeybees from the “nectar of plants or from secretions of living parts of plants or excretions of plant-sucking insects on the living parts of plants, which the bees collect, transform by combining with specific substances of their own, deposit, dehydrate, store and leave in honeycombs to ripen and mature” (Codex Standard for Honey, CODEX STAN 12–1981, 2001;
The European Council, 2001). Several types of unifloral and polyfloral honeys are known worldwide, the origin having a high impact on the composition and the sensory properties of honey. Amongst sensory properties, colour is an important attribute that is also part of regular honey analysis (Da Silva et al., 2016; Oddo & Piro, 2004; Persano Oddo
& Bogdanov, 2004).
Colour determination of honey can be done by several methods. The most commonly used techniques are usually based on visual comparison of the samples, such as Pfund, Lovibond and Jack’s scale. Honeys are usually marketed and evaluated according to the Pfund scale, which is able to give the colour intensity of honey in the amber scale, however, it is sometimes hard to handle (Bogdanov et al., 2004). The ‘Pfund colorimeter’ is a simple instrument which has a reference unit (Pfund scale). It is based on the visual comparison of a honey sample against a colour standard (Martin et al., 2014). In the absence of a dedicated in- strument, Pfund values can be determined by a trained analyst, too (Dominguez & Centurion, 2015). The instrument consists of a wedge of ´ amber-coloured glass next to a wedge-shaped cell which is filled with honey. It has an arbitrary scale of 0–140 mm (mm Pfund) and is read visually; the reading is the distance covered by the wedge that must be moved to make a match. The method has been widely used through the past decades and it is still very popular for a fast, inexpensive and simple
* Corresponding author.
E-mail address: benedek.csilla@se-etk.hu (C. Benedek).
Contents lists available at ScienceDirect
LWT
journal homepage: www.elsevier.com/locate/lwt
https://doi.org/10.1016/j.lwt.2021.111859
Received 10 April 2021; Received in revised form 26 May 2021; Accepted 2 June 2021
characterisation of honey colour (Karabagias et al., 2020). However, during recent decades several problems have arisen regarding the Pfund scale. Some researchers have reported that it is hard to find a match for the chromaticity for some samples (Brice, 1960). Others found that the accuracy of the instruments highly depends on the subjective individual readings, moreover, some samples are out of the range of 0–140 mm (Bowles & Gullett, 1976). Another problem of the method is that it cannot detect smaller differences between the samples due to the wide ranges of the scale, i.e.: 0–8 mm – water white, 8–17 mm – extra white, 17–34 mm - white, 34–50 mm extra light amber, 50–85 mm – light amber, 85–114 mm – amber, >114–140 mm – dark amber (Belay et al., 2015; Bowles & Gullett, 1976; Pascual-Mat´e et al., 2018).
The Lovibond method is another visual method applied for honey colour analysis. During this procedure glasses of six shades of yellow colour are compared with the honey sample. Similarly, to the Pfund scale, this method is not able to detect small colour differences, and the result can depend on the observer itself (Szabo et al., 2016). ´
Another option for characterization the colour of honey is the determination of colour intensity, which can be defined as the net absorbance between two absorbance values, corresponding to the dif- ference of A450 nm-A720 nm (expressed as mAU). The determination of colour intensity may give information about the pigments of honey (Karabagias et al., 2020).
Further possible technique for the measurement of honey colour is determination of colorimetric parameters based on spectral information or tristimulus values. This can be done in a chromaticity diagram or in a colour space developed for the perception of the human eye, such as CIE LAB, CIE xyY or CIE L*u*v* (Koren et al., 2020), but in the case of honey analysis the LAB system is the most widely applied (Escriche et al., 2017;
Juan-Borr´as et al., 2014; Karabagias et al., 2017; Rodríguez-flores et al., 2019; Sakaˇc et al., 2019; Tuberoso et al., 2014). In this case L* defines the lightness of the sample (0–100 scale), the higher the value, the lighter the sample is. The a* coordinate determines the greenness/red- ness of the sample. In this case greenish colour is in the negative range, while reddish colour is in the positive range. The b* axis quantifies the blue or yellow colour, where blueness is in the negative range and yel- lowness in the positive range. The L*a*b* coordinates can be calculated from the X,Y,Z tristimulus values. The magnitude of the perceived colour differences can be represented by numerical values, described by Euclidean distances in the CIELAB colour space (ISO, 2019). Based on the L*a*b* coordinates, it is possible to determine the C*ab and h◦ab,
values, where C*ab stands for the chroma (relative saturation) and h◦ab
stands for the hue angle. As described by numerous researchers (Al-Farsi et al., 2018; Cimpoiu et al., 2013; Pascual-Mat´e et al., 2018; Pontis et al., 2014) the colour measurement can also be performed by spectroscopy, when the absorbance of the sample is measured and the Pfund value is calculated from the absorbance obtained at 635 nm (Table 1). Spec- troscopic and colorimetric techniques can provide a more exact evalu- ation of honey colour and are able to identify the small differences between honeys. However, there is still a demand for a method of colour analysis which is more universal and can be used in a more standardized way, enabling researchers and authorities to characterise honey more objectively and detect differences more exactly.
Therefore, the aim of this study was to develop a method using spectroscopic analysis to describe the colour attributes of honey samples
in a more accurate way, that also, delivers the Pfund value and also the CIE colorimetric parameters of the samples with a better repeatability.
Moreover, we aimed to provide a tool that can be easily and practically used by researchers.
2. Materials and methods 2.1. Honey samples
In this study 73 honey samples were analysed from different botanical sources: 31 acacia (Robinia pseudoacacia), 10 Linden (Tilia spp.) 7 chestnut (Castanea sativa), 7 honeydew, 7 sunflower (Helianthus annuus), 5 silkgrass (Asclepias syriaca) and 6 rapeseed (Brassica napus).
The samples were collected directly from beekeepers with the exception of one sample that was originated from of honey from European Union and non-European Union countries. The coding system of the samples consists of the abbreviation of the sample type derived from the Latin names (RP-acacia, TS-linden, CS-chestnut, HO-honeydew, HA-sun- flower, AS-silkgrass, BN-rapeseed) and the identification number of the sample. The samples were collected from various geographical locations in Hungary (except for one sample) and from different years (Table S2).
The samples were stored at dark places at room temperature until the date of the measurement. Measurements were performed in July 2020.
2.2. Measurements
The colour of the samples was determined by spectroscopy, recording the transmission spectra of the samples in the wavelength range of 380–780 nm, at 1 nm steps. For the spectral analysis samples were diluted with distilled water at 50/50 w/v% concentration, as usually done for Pfund analysis (Bertoncelj et al., 2007) and spectral acquisition was performed using a dual-beam Hanon i9 UV/VIS spec- trophotometer (Hanon Group, China), using disposable plastic cuvettes (10 mm optical pathlength). During the spectral acquisition distilled water was used as blank. The measurements were performed at room temperature (25 ◦C). No replicates were performed.
2.3. Data analysis
Transmission spectra of the samples were exported from the UV/VIS Analyst software (Chongqing Drawell Instrument Co., Ltd., Chongqing, China) and transferred to a template developed in Excel 365 (Microsoft Corporation, Redmond, Washington, USA). The template was designed to calculate all the colour parameters from the transmission spectra according to the equations below (CIE Technical Committee, 2004;
Sant’Ana et al., 2014). The Pfund values were calculated from their absorbance at 635 nm, derived from the corresponding transmission spectra values. Besides the Pfund values, the following colorimetric parameters were calculated: chromaticity coordinates (L*a*b*, XYZ, xy), lightness, chroma and hue defined in the 1976 CIELAB colour space.
During the calculations, the D65 illuminant was assumed as light source since our aim was to observe perceptible differences and the D65 illu- minant is the most widely used daylight simulator in computational vision science and provides a neutral state of chromatic adaptation.
Pfund= − 38.70+371.39×Absorbanceλ635 (1)
X=k
∫
780
380
φ(λ)x(λ)dλ (2)
Y=k
∫
780
380
φ(λ)y(λ)dλ (3)
Table 1
Perceptible ΔE*ab difference threshold and categories.
Threshold values of the categories Category of the difference
ΔE*ab ΔE*ab =0 no difference
ΔE*ab ≤0.5 non-perceptible
0.5 <ΔE*ab ≤1.5 barely perceptible
1.5 <ΔE*ab ≤3.0 perceptible
3.0 <ΔE*ab ≤6.0 visible
6.0 <ΔE*ab huge
Z=k
∫
780
380
φ(λ)z(λ)dλ (4)
x=X/(X+Y+Z) (5)
y=X/(X+Y+Z) (6)
L* =116f (Y
Yn
)
− 16 (7)
a* =500 [
f (X
Xn
)
− f (Y
Yn
)]
(8)
b* =200 [
f (Y
Yn
)
− f (Z
Zn
)]
(9)
f (X
Xn
)
= (X
Xn
)1 3
if (X
Xn
)
>(6/29)3
f (X
Xn
)
= (841
108 )(X
Xn
) + 4
29if (X
Xn
)
≤ (6/29)3
f (Y
Yn
)
= (Y
Yn
)1 3
if (Y
Yn
)
>(6/29)3
f (Y
Yn
)
= (841
108 )(Y
Yn
) + 4
29 if (Y
Yn
)
≤ (6/29)3
f (Z
Zn
)
= (Z
Zn
)1 3
if (Z
Zn
)
>(6/29)3
f (Z
Zn
)
= (841
108 )(Z
Zn
) + 4
29 if (Z
Zn
)
≤ (6/29)3 ΔEab* = ( (
L*A − L*B)2 + (
a*A − a*B)2 +(
b*A − b*B)2)1/2
(10)
h◦ab=tan−1b*
a* (11)
Cab=
̅̅̅̅̅̅̅̅̅̅̅̅̅̅̅̅̅̅̅
a*2+b*2
√
(12) where A and B in the subscript denote the values of different samples, X, Y and Z stand for the tristimulus values, x,y,z are CIE colour matching functions, φ(λ)denotes the relative colour stimulus function, k is a constant for normalisation, x and y are the chromaticity coordinates in the CIE 1931 chromaticity diagram, L*, a*, b* are the colour coordinates and ΔE*ab is the colour difference defined in the CIELAB colour space which describes the overall perceptible difference between two colour stimuli. Based on Δ E*ab the perceptible difference can be categorised as shown in Table 1 (Mokrzycki & Tatol, 2011). Further on, lightness, chroma and hue differences allowed us to gain more information about the nature of the perceived difference.
During the data analysis samples belonging to the same Pfund category were compared according to their calculated colour attributes from the transmission spectra to be able to prove that Pfund scale is not sensitive enough to detect slight differences between samples.
The Pfund values of the honeys from the different botanical groups were compared using ANOVA variance analysis. Before the analysis the necessary assumptions, such as normality and Levene’s test of equality of error variances were applied. In case the Levene’s test showed sig- nificant (p <0.05) values, the pairwise comparison was performed using Games-Howell post hoc test, which is not sensitive to the equality of the error variances (Tabachnick & Fidell, 2013).
3. Results
3.1. The features and capabilities of the designed calculation template table
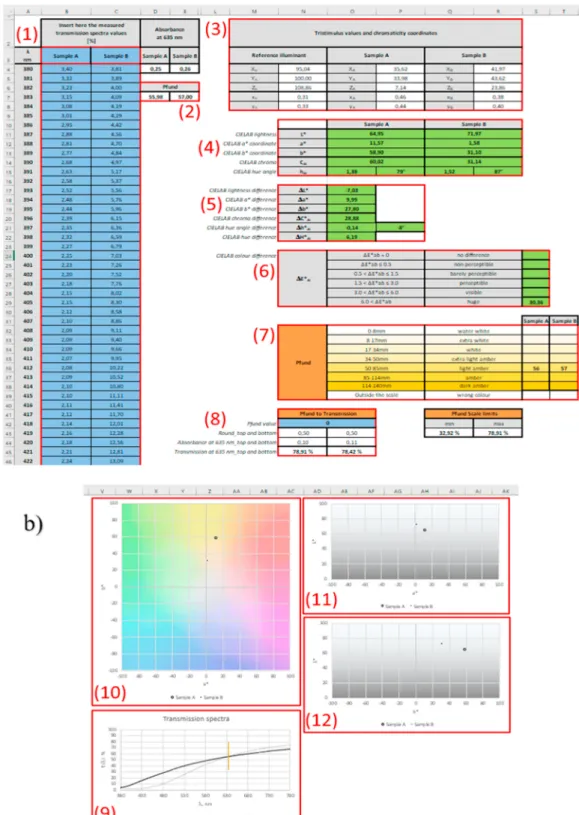
The structure of the calculation template (Table S1 - supplementary material) is shown in Fig. 1, the calculation steps are marked with (1)- (12). The tool enables concomitant calculation of the different colour attributes and Pfund values from the transmission spectra (Fig. 1a). In addition, the template makes it possible to compare the colour proper- ties of two different samples based on their transmission spectra (Fig. 1b). There are two worksheets for processing data measured with 1 nm and 5 nm steps, respectively. Input cells are marked with blue background. After inserting the transmission spectral data (1 nm or 5 nm steps) and labels of the samples to column B (Sample A) and column C (Sample B) (1), the template automatically calculates the Pfund values (cells D7 and E7; (2)) of the two samples from the transmission values obtained at 635 nm. The tristimulus values and chromaticity coordinates (XYZ, xy) are also calculated for both samples (range M2:R8; (3)). This is followed by the parameters of the CIELAB colour space: L*a*b*, h◦ab and C*ab calculated from the tristimulus values and chromaticity coordinates (range N10:R15; (4)). In the next range from N17:P22 (5) the colour differences of L*a*b*, h◦ab and Cab can be found between the two samples, followed by the perceptible ΔE*ab difference (range N24:S29;
(6)), which not only gives the difference, but also shows which the category to which this difference belongs (in accordance with Table 1).
In the range of N32:T39 the Pfund categories and values of the samples are calculated from the transmission at 635 nm (7). For inverse calcu- lations, the template gives the interval of transmission values at 635 nm providing a Pfund value defined in cell N42 (range M41:Q45; (8)). The template also automatically creates a plot of the transmission spectra (9) for the samples to be compared (see examples in Figs. 1 and 2), and creates three diagrams which visualize the two samples in the two dimensional projections of the L*a*b* colour space (10), (11), (12), in terms of the combinations of L*, a* and b* parameters (see example in Fig. 3).
3.2. Results of the honey samples based on the calculations from transmission spectra
Detailed calculated results of the honey samples regarding their colour parameters can be found in Table S2 in supplementary data. The table shows that samples from different botanical origins provide various results, moreover, it can be also noted large differences can be found among the colour parameter of the samples within the same botanical group. The Pfund value range for acacia honeys was 7.26–20.92, for chestnut honeys it was 71.30–149.42, for honeydew honeys 58.37–194.19, for linden honeys 38.27–139.48, for rapeseed honeys 2.08–138.56, for silkgrass honeys 42.83–75.96 and for sunflower honeys it was 96.30–198.91 (Table 2). The results showed higher stan- dard deviation in the case of the honeydew, rapeseed and sunflower samples. In the latter two cases the groups included aged honeys (5–6 years). Results of the ANOVA test followed by the pairwise comparison showed that the acacia honeys had significantly (p <0.01) lower Pfund values compared to the other botanical groups, with the exception of rapeseed honeys, which were not significantly different (p =0.088).
Other groups did not show significant differences compared to each other (p >0.05).
The results show that some honey samples were out of the range of the Pfund scale, which is a notable deficiency of the colour grading method. Another phenomenon recognized was that even though some samples have of transmission values at 635 nm and belong thus to the same Pfund value or Pfund group, their detailed colour parameters and transmission spectra were different. In the next two paragraphs exam- ples of the above mentioned recognized deficiency and phenomena are detailed.
The results obtained by the calculation template are illustrated on acacia samples. Altogether 31 acacia samples were observed. Fig. 2 shows the transmission spectra of these samples normalised to their value at 635 nm. It can be seen that the gradient changes of the spectral transmissions below 635 nm were higher than above 6235 nm. The transmission spectra of the other honey types can be found in Fig. S1. In the case of other honeys, transmissions are even more scattered above 635 nm, with the exception of silkgrass honey, where distribution of the spectra is similar to that obtained for acacia. Fig. 3 shows all acacia
samples on the a*b* graph. As seen on this graph, the a* and b* values of the acacia honey samples were mainly scattered along the b* value. The results of the other honey types can be found in Fig. S2. Similar plots were obtained for silkgrass, rapeseed, linden and sunflower honeys, while chestnut and honeydew honeys were scattered along a*.
Fig. 1.The structure of the calculation template for the colour properties of honey samples using transmission spectra a) DATA, b) PLOTS. (For interpretation of the references to colour in this figure legend, the reader is referred to the Web version of this article.)
3.3. Results showing deficiency of Pfund scale regarding outlier Pfund values
It is important to mention that due to the limitations of the Pfund scale (values outlying of the interval between 0 and 140 are categorised as wrong samples) it covers only a part of the possible range of trans- mission spectra values (between 0% and 100%). Samples having
transmission above 78.91% (Pfund below 0) and transmission below 32.92% (Pfund above 140) were defined as wrong samples according to the Pfund scale, although we found authentic honey samples from both categories.
3.3.1. Example 1
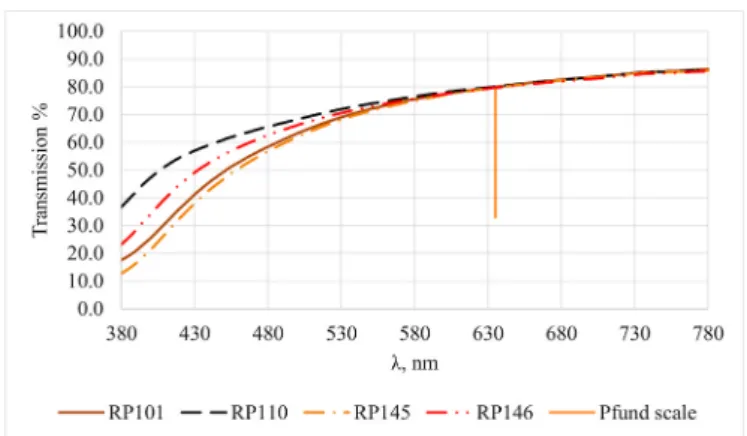
As an example, acacia honey samples from different years, having too high transmissions, were compared. The transmission spectra are shown in Fig. 4 where, it can be seen that, the transmission spectra above ~580 nm could be considered as constant, while with aging the spectral features of the samples in the range below ~580 nm changed significantly.
In the case of our four acacia samples the transmission values at 635 nm were 80.01%, 80.01%, 79.79% and 79.64%, each of them leading to a negative Pfund value (3). However, they were quite close to each other regarding their Pfund-metrics. The Pfund and the ΔEab values listed in Table 3 show that the spectral differences in the shorter visible wave- length range produced perceptible differences in chromaticity.
3.3.2. Example 2
The limitations of the Pfund scale could also be observed with too low transmission values (too dark samples), as in the case of our chestnut and sunflower samples, shown in Fig. 5. The Pfund values were 149.43 and 149.53, while the perceived colour difference was 20.86.
This case is also a good example illustrating the differences in spectral characteristics of different types of honeys.
3.4. Results of honey samples showing close Pfund values but high perceived differences
3.4.1. Example 3
Acacia samples were grouped based on their Pfund values. The lightest group based on the colour (Pfund category: water white) con- sists of five samples. The graph of the transmission spectra is shown in Fig. 6 and the Pfund values and the ΔE*ab colour differences in Table 4.
Even though samples A and E had the same Pfund value, there was a perceptible colour difference between them, while the colour difference between E and B was minimal, but their Pfund values were different.
3.4.2. Example 4
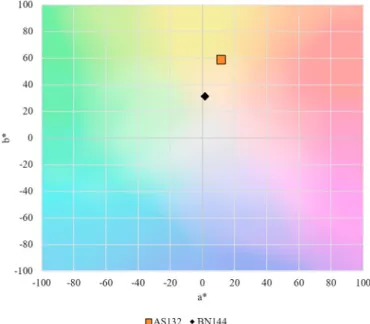
Another type of example illustrates the comparison of different types of honey samples. Fig. 7shows the transmission spectra of a silkgrass and a rapeseed sample. Their transmissions (and therefore absorptions) were quite close at 635 nm, confirming the similarities in their similar Pfund values (55.98 and 57.00), although, there were important differences in other spectral ranges which caused a perceptible colour difference of 30.36.
Fig. 8 shows the samples in the a*b* diagram. In this case hue Fig. 2. Transmission spectra of the acacia honey samples normalised to their
value at 635 nm.
Table 2
Results of the Pfund calculations by botanical groups.
Pfund value
range Pfund class range Pfund valuea
Acacia −7.26–20.92 Out of range <0 - white 7.01 ±8.27a Chestnut 71.3–149.42 Light amber - out of range
>140 104.41 ±
27.28b Honeydew 58.37–194.19 Light amber - out of range
>140 131.16 ±
51.64b Linden 38.27–139.48 Extra light amber- dark
amber 71.79 ±31.98b
Rapeseed 2.08–138.56 Extra white - dark amber 86.91 ± 51.06ab Silkgrass 42.83–75.96 Extra light amber – light
amber 63.43 ±14.07b
Sunflower 96.3–198.91 Amber - out of range >140 122.38 ± 38.43b aMean ± SD Letters in superscript denote the significant differences based on the ANOVA results followed by pairwise comparison using Games-Howell test p
<0.05.
Fig. 3.CIE a*b* graph of all acacia samples analysed.
Fig. 4.Comparison of the transmission spectra of four acacia honeys out of the Pfund range, having similar transmission at 635 nm.
difference also plays a role in the perceived colour difference.
In examples 1–4 cases were presented in which the Pfund method provides misleading results. The magnitude of the perceived difference between two samples is independent of the actual Pfund values of the samples. It is possible to find any combination of high/low perceived difference between samples with high/low Pfund values. This aspect underlines the importance of verifying Pfund measurements with such a calculation tool considering the whole visible spectra.
4. Discussion
Even though both methods (i.e. Pfund and CIE L*a*b*) applied by us to define the colour of the honey samples were based on spectral mea- surements, the main difference needs to be highlighted. In practice the Pfund value is given by a Pfund grader applying visual categorization but in this study the Pfund values were calculated based on the spectral transmittance of the sample measured at a single wavelength (635 nm), disregarding the spectral information describing other wavelength ranges. Besides, the CIE colorimetric system relies on the tristimulus values, based on the spectral distribution measured at the whole visible wavelength range between 380 nm and 780 nm. The efficiency of spectral measurement determination of colour has been proven by other authors too using reflectance spectroscopy to determine the colour of honey and calculation of colour parameters from the spectra (Neguer- uela & Perez-Arquillue, 2000).
In addition to the values measured at 635 nm, other differences in spectra may cause perceptible colour differences between honey sam- ples of equal Pfund values. Lightness and chroma differences can be observed between honey samples of the same type but different ages, while in case of different types of honeys even hue differences may occur.
Limitations of the Pfund scale have another aspect as well. The range Table 3
Examples of samples not fitting the scale of the Pfund method and their perceived differences.
Pfund ΔEab A B C
RP101 − 2.73 A - - -
RP110 − 2.73 B 9.35 - -
RP145 − 2.29 C 1.97 11.21 -
RP146 − 1.98 D 5.18 4.19 7.30
Fig. 5.Comparison of the transmission spectra of sunflower and chestnut honey out of the Pfund range, having similar transmission at 635 nm.
Fig. 6. Comparison of the transmission spectra of five acacia honeys belonging to the same group (water white) based on their Pfund value.
Table 4
Pfund values, ΔE*ab values, and the perceived differences of five acacia samples having similar Pfund values.
Pfund ΔE*ab A B C D
RP21 1 A - - - -
RP111 2 B 8.37 - - -
RP117 2 C 11.46 3.00 - -
RP120 3 D 12.13 3.75 0.81 -
RP126 1 E 8.32 0.35 3.24 3.99
Fig. 7.Comparison of the transmission spectra of two honey samples from different botanical origins, having similar transmission at 635 nm.
Fig. 8.Comparison of two honey sample from different botanical origins based on their a*b* values, having similar transmission at 635 nm.
between 0 and 140 mm covers only transmission values between 32.92% and 78.91%. Escriche et al. (2017) also found Pfund values of honey to be higher than 140, this showing the darkness of the samples.
Pontis et al. (2014) used also measurements at 635 nm and determined the colour intensity. They found some honey samples as outlier from the 140 mm Pfund scale, having higher values. Honeys with transmission out of this range at 635 nm cannot be categorised based on the Pfund scale.
Results of our study showed that despite of the close Pfund values and transmission values at 635 nm, some samples, even within the same range, have different perceived colours, as proven by their ΔE*ab results (Table 1, Table 3). Therefore, there was a need for a method that can provide more detailed results regarding the colour of the honey samples.
It is also important to note that the spectral measurements and L*a*b*
colour determinations of the samples are done in different ways, which does not provide results that are comparable at an international scien- tific level (Al-Farsi et al., 2018; Escriche et al., 2017; Juan-Borr´as et al., 2014; Negueruela & Perez-Arquillue, 2000; Pontis et al., 2014). The results of spectroscopic measurements can depend on numerous factors, including the type of the light source, temperature, concentration and spectral resolution. Crystal-free honey samples are of utmost impor- tance, thus samples need to be liquefied, either by heating or by pre- paring solutions of different concentrations. However, liquefaction of samples by heating brings up other problems that can affect the colour of the sample (Bodor et al., 2019; Kędzierska-Matysek et al., 2016). The temperature applied for the liquefaction has an effect on the sample in the function of time (Bogdanov, 1993). Depending on the amount of the sample usually several hours are needed to liquefy samples at lower temperatures (≤40 ◦C), but long heating time can change the colour even at low temperature levels (Smith, 1967), influencing thus the re- sults. Therefore, application of watery solutions (typically at 50% w/v concentration) seems to be a good solution for preparation of crystal-free samples (Bertoncelj et al., 2007; Karabagias et al., 2020;
Kavanagh et al., 2019; Pontis et al., 2014).
As regards instrumentation, both colorimeters and spectrophotom- eters can be applied for the measurement of the colour of the samples. It is important to highlight that there is a widespread misunderstanding in terminology: these two instruments are often referred to as synonyms.
As defined in colour technology, colorimeters apply continuous filters and provide the X, Y and Z tristimulus values as output, while spectro- photometers measure the transmission (or reflection or emission) spectra. A main difference is that the tristimulus values can be derived from the spectral data, therefore the results carry the error caused by the spectral resolution of the spectrophotometer. Even though the color- imeters do not carry this error because of their continuous filters, they do not provide spectral information, therefore they are not applicable for spectral comparison or the determination of the Pfund value of the samples.
As regards spectrophotometers, the benefit of the benchtop instru- ment is that it has a dedicated place for the sample, with well-defined angles and pathlength when standard cuvettes are used. Moreover, the spectrophotometer provides accurate measurements at all the wave- lengths and it also provides better wavelength resolution (usually up to 1 nm). The colorimeters and handheld spectrophotometers are able to provide quick colour determination, however in this case the place of the measured sample and the environmental circumstances need higher control and supervision. Moreover, handheld spectrophotometers are usually not able to provide a wavelength resolution as low as 1 nm, therefore these parameters have to be considered during the analysis and results interpretation (Admesy, 2015). As a general recommenda- tion, we suggest that the colour analysis of honey within laboratory conditions should be performed on a benchtop UV-VIS spectrophotom- eter as a primary choice. Pfund analysis should be applied within lab- oratory circumstances only as a complementary measurement, and only in the case of the samples that have a transmittance within the range of the 32.92%–78.91%, as this covers the range of the Pfund scale. For
honey samples that are out of this range, the Pfund values are not applicable (see section 3.3). However, in the case of on-the-spot mea- surements the use of handheld spectrophotometers and Pfund scales can still be a choice, considering the aforementioned accuracy issues.
Nevertheless, in order to avoid deviations in transmittance values due to temperature fluctuations, temperature control during the measurement should be ensured.
Our measurements performed at room temperature (25 ◦C) were found to allow a generally satisfactory repeatability. Repeatability was estimated from a series of 12 measurements performed under identical conditions, by multiplying the standard deviation by 2.8 (OIV, 2005).
Examining transmittance repeatability for a light and a dark honey, relative repeatability was generally under 4% for the entire spectrum.
Based on these T% values, estimated repeatability was: for L* less than 0.5% rel., for a* less than 1% rel., for b* less than 1.5%. For the dark honey estimated repeatability of the Pfund value calculated from these transmittances was under 1.5%, however, it was rather high (around 20% rel.) for the light honey sample (from the lightest Pfund category), which seems thus to be a more sensitive category.
As regards estimation of the impact of temperature changes, mea- surements were carried out on a dark honey sample at 15 ◦C, 23 ◦C and 30 ◦C. Transmittance values were found to increase throughout the whole visible spectrum, except for the range between 380 and 395 nm.
At 15 ◦C relative differences in T% were under 2% compared to the values measured at 23 ◦C. Higher relative differences in T% were detected when the values measured at 30 ◦C were compared to those measured at 23 ◦C, especially at lower wavelengths, where they increased close to 10% rel. This temperature dependence is reflected mainly in a* and Pfund values, where relative differences at 30 ◦C reach 27% rel. for a* and 17% rel. for Pfund. Therefore, temperature control is an important aspect of the measurement which should be respected (temperature of 25 ◦C is suggested as a standard temperature).
5. Conclusion
Disregarding spectral information in the visible wavelength range may result in discrepancy in terms of colour definition. Since the Pfund scale is based on the spectral absorbance measured at a single wave- length, the colour definition based exclusively on this value might be illusive. Further limitation of the Pfund scale is that it can even exclude some honey samples based on their transmission value at 635 nm.
For exact colour definition the colour categories defined by the Pfund scale should be complemented - whenever possible - with colorimetric data, such as L* a* b* colour coordinates and their derivatives defined in the CIELAB colour space.
The colour of honey is influenced by several factors: (phenolics, ca- rotenoids, sugars, minerals, pollens), water content, floral and geographical origin, temperature and time conditions of processing/
handling/storage, age of honey, measurement conditions of colour measurement, etc. In order to be able to compare internationally pub- lished results on honey colours, a standardized measurement system needs to be developed. It is necessary to lay down a detailed sample preparation and exact measurement conditions (sample and measure- ment temperature, wavelength ranges, wavelength step). Our method could serve as a basic study to further establish a reliable method for the repeatable and comparable measurement of honey colour, com- plementing the Pfund analysis. Therefore, we would suggest to use the whole spectral range (380–780 nm) during the measurement and also to have stable temperature conditions. Based on our results, we also sug- gest the establishment of a dedicated expert group for honey colour analysis within the working group of ISO/TC 34/SC 19/WG 1-Honey, where the validation and applicability of the method could be elaborated.
Authors’ contributions to manuscript
All the authors have contributed to the manuscript. The experi- mental design was done by C.B., Z.B., A.U. and L.S. The Excel template ´ was designed by A.U. and L.S. The experimental laboratory work was ´ performed by Z.B. and C.B.. Data analysis was done by Z.B. and L.S. The manuscript was written by Z.B., A.U., D.Sz. and L.S. The revision was ´ done by all the authors.
CRediT authorship contribution statement
Zsanett Bodor: experimental design, experimental laboratory work was performed, Data analysis was done, manuscript was written. Csilla Benedek: experimental design, experimental laboratory work was performed. Agnes Urbin: ´ experimental design, Excel template was designed, manuscript was written. D´aniel Szab´o: manuscript was written. L´aszl´o Sipos: experimental design, Excel template was designed, manuscript was written, All the authors have contributed to the manuscript.
Declaration of competing interest
The authors state that there is no conflict of interest issue in relation to the manuscript above.
Acknowledgement
This paper was supported by the J´anos Bolyai Research Scholarship of the Hungarian Academy of Sciences. This work was partly supported by the European Union and co-financed by the European Social Fund (grant agreement no. EFOP-3.6.3-VEKOP-16-2017-00005). This research was funded by National Research, Development and Innovation Office of Hungary (OTKA, contracts No. 135700). The research reported in this paper has been supported by the NRDI Fund (TKP2020 NC, Grant No. BME-NCS) based on the charter of bolster issued by the NRDI Office under the auspices of the Ministry for Innovation and Technology. The research reported in this paper has been supported by the NRDI Fund (TKP2020 IES, Grant No. BME-IE-BIO) based on the charter of bolster issued by the NRDI Office under the auspices of the Ministry for Inno- vation and Technology. Supported by the ÚNKP-20-3-II-SZIE-12 New National Excellence Program of the Ministry of Innovation and Tech- nology from the source of the National Research, Development and Innovation Fund (Z.B.). Zsanett Bodor and D´aniel Szab´o express their gratitude to the Doctoral School of Food Science of Hungarian Univer- sity of Agriculture and Life Sciences. Authors are grateful to John-Lewis Zinia Zaukuu for checking the manuscript in terms of English spelling and grammar.
Appendix A. Supplementary data
Supplementary data to this article can be found online at https://doi.
org/10.1016/j.lwt.2021.111859.
References
Admesy. (2015). Transmissive measurements - how to measure spectral, color and luminous transmission. AZoM. https://www.azom.com/article.aspx?ArticleID=12092.
Al-Farsi, M., Al-Amri, A., Al-Hadhrami, A., & Al-Belushi, S. (2018). Color, flavonoids, phenolics and antioxidants of Omani honey. Heliyon, 4(10), Article e00874. https://
doi.org/10.1016/j.heliyon.2018.e00874
Belay, A., Solomon, W. K. K., Bultossa, G., Adgaba, N., & Melaku, S. (2015). Botanical origin, colour, granulation, and sensory properties of the Harenna forest honey, Bale, Ethiopia. Food Chemistry, 167, 213–219. https://doi.org/10.1016/j.
foodchem.2014.06.080
Bertoncelj, J., Doberˇsek, U., Jamnik, M., & Golob, T. (2007). Evaluation of the phenolic content, antioxidant activity and colour of Slovenian honey. Food Chemistry, 105(2), 822–828. https://doi.org/10.1016/j.foodchem.2007.01.060
Bodor, Z., Zaukuu, J. Z., Benedek, C., & Kovacs, Z. (2019). Detection of heat treatment by rapid correlative techniques. 5th International Symposium on Bee Products.
Bogdanov, S. (1993). Liquefaction of honey. Apiacta, 28(1), 4–10.
Bogdanov, S., Ruoff, K., Persano Oddo, L., & Oddo, L. P. (2004). Physico-chemical methods for the characterisation of unifloral honeys: A review. Apidologie, 35(Suppl.
1), S4–S17. https://doi.org/10.1051/apido:2004047
Bowles, L. H., & Gullett, E. A. (1976). Color classification of honey using reflectance measurement. Canadian Institute of Food Science and Technology Journal, 9(3), 125–129. https://doi.org/10.1016/s0315-5463(76)73644-7
Brice, B. A. (1960). Glass color standards and a uniform chromaticity scale for sugar products*. Journal of the Optical Society of America, 50(1), 49–56. https://doi.org/
10.1364/JOSA.50.000049
CIE Technical Committee. (2004). CIE 15:2004 Technical support.
Cimpoiu, C., Hosu, A., Miclaus, V., & Puscas, A. (2013). Determination of the floral origin of some Romanian honeys on the basis of physical and biochemical properties.
Spectrochimica Acta Part A: Molecular and Biomolecular Spectroscopy, 100, 149–154.
https://doi.org/10.1016/j.saa.2012.04.008
Da Silva, P. M., Gauche, C., Gonzaga, L. V., Costa, A. C. O., & Fett, R. (2016). Honey:
Chemical composition, stability and authenticity. Food Chemistry, 196, 309–323.
https://doi.org/10.1016/j.foodchem.2015.09.051
Dominguez, M. A., & Centurion, M. E. (2015). Application of digital images to determine ´ color in honey samples from Argentina. Microchemical Journal, 118, 110–114.
Escriche, I., Tanleque-Alberto, F., Visquert, M., & Oroian, M. (2017). Physicochemical and rheological characterization of honey from Mozambique. Lebensmittel- Wissenschaft und -Technologie- Food Science and Technology, 86, 108–115. https://doi.
org/10.1016/j.lwt.2017.07.053
ISO, 2019, ISO-ISO/CIE 11664-4:2019 -Colorimetry - Part 4: CIE 1976 L*a*b* colour space.
Juan-Borr´as, M., Domenech, E., Hellebrandova, M., & Escriche, I. (2014). Effect of country origin on physicochemical, sugar and volatile composition of acacia, sunflower and tilia honeys. Food Research International, 60, 86–94. https://doi.org/
10.1016/j.foodres.2013.11.045
Karabagias, I. K., Karabournioti, S., Karabagias, V. K., & Badeka, A. V. (2020).
Palynological, physico-chemical and bioactivity parameters determination, of a less common Greek honeydew honey: “dryomelo”. Food Control, 109, 106940. https://
doi.org/10.1016/j.foodcont.2019.106940
Karabagias, I. K., Louppis, A. P., Karabournioti, S., Kontakos, S., Papastephanou, C., &
Kontominas, M. G. (2017). Characterization and geographical discrimination of commercial Citrus spp. honeys produced in different Mediterranean countries based on minerals, volatile compounds and physicochemical parameters, using chemometrics. Food Chemistry, 217, 445–455. https://doi.org/10.1016/j.
foodchem.2016.08.124
Kavanagh, S., Gunnoo, J., Marques Passos, T., Stout, J. C., White, B., Marques, T., Stout, J. C., White, B., Marques Passos, T., Stout, J. C., White, B., Marques, T., Stout, J. C., White, B., Marques Passos, T., Stout, J. C., & White, B. (2019).
Physicochemical properties and phenolic content of honey from different floral origins and from rural versus urban landscapes. Food Chemistry, 272, 66–75. https://
doi.org/10.1016/j.foodchem.2018.08.035. August 2018.
Kędzierska-Matysek, M., Florek, M., Wolanciuk, A., Skałecki, P., & Litwi´nczuk, A. (2016).
Characterisation of viscosity, colour, 5-hydroxymethylfurfural content and diastase activity in raw rape honey (Brassica napus) at different temperatures. Journal of Food Science & Technology, 53(4), 2092–2098. https://doi.org/10.1007/s13197-016- 2194-z
Koren, D., Hegyesn´e Vecseri, B., Kun-Farkas, G., Urbin, ´A., Nyitrai, ´A., & Sipos, L. (2020).
How to objectively determine the color of beer? Journal of Food Science & Technology, 57(March), 1183–1189. https://doi.org/10.1007/s13197-020-04237-4
Martin, M. J., Fredes, C., Nunez, G., Ginocchio, R., & Montenegro, G. (2014). Comparison ˜ of methods for determining the color of Chilean honeys and the relationship of color with botanical origin in central Chile. Ciencia e Investigaci´on Agraria: Revista Latinoamericana de Ciencias de La Agricultura, 41(3), 411–418.
Mokrzycki, W. S., & Tatol, M. (2011). Colour difference deltaE - a survey. Machine Graphics and Vision, 20(4), 383–411.
Negueruela, A. I., & Perez-Arquillue, C. (2000). Color measurement of rosemary honey in the solid state by. Journal of AOAC International, 83(3), 669–674. http://lib3.dss.go.
th/fulltext/Journal/J.AOAC 1999-2003/J.AOAC2000/v83n3(may-jun)/v83n3p669.
pdf.
Oddo, L. P., & Piro, R. (2004). Main European unifloral honeys: Descriptive sheets.
Apidologie, 35, S38–S81. https://doi.org/10.1051/apido
OIV. (2005). Practical guide for the validation, quality control, and uncertainty assessment of an alternative oenological analysis method. In Compendium of international analysis of methods - OIV Guide for the validation - quality control.
Pascual-Mat´e, A., Os´es, S. M., Fern´andez-Mui˜no, M. A., & Sancho, M. T. (2018). Methods of analysis of honey. Journal of Apicultural Research, 57(1), 38–74. https://doi.org/
10.1080/00218839.2017.1411178
Persano Oddo, L., & Bogdanov, S. (2004). Determination of honey botanical origin:
Problems and issues. Apidologie, 35(Suppl. 1), S2–S3.. https://doi.org/10.1051/
apido:2004044
Pontis, J. A., da Costa, L. A. M. A., da Silva, S. J. R., Flach, A., Costa, L. A. M. A., da, Silva, S. J. R., da, Flach, A., da Costa, L. A. M. A., da Silva, S. J. R., & Flach, A. (2014).
Color, phenolic and flavonoid content, and antioxidant activity of honey from Roraima, Brazil. Food Science and Technology (Campinas), 34(1), 69–73. https://doi.
org/10.1590/S0101-20612014005000015
Rodríguez-flores, M. S., Escuredo, O., Míguez, M., Seijo, M. C., Míguez, M., & Seijo, M. C.
(2019). Differentiation of oak honeydew and chestnut honeys from the same geographical origin using chemometric methods. Food Chemistry, 297(June), 124979. https://doi.org/10.1016/j.foodchem.2019.124979
Sakaˇc, M. B., Jovanov, P. T., Mari´c, A. Z., Pezo, L. L., Kevreˇsan, ˇZ. S., Novakovi´c, A. R., &
Nedeljkovi´c, N. M. (2019). Physicochemical properties and mineral content of honey
samples from Vojvodina (Republic of Serbia). Food Chemistry, 276, 15–21. https://
doi.org/10.1016/j.foodchem.2018.09.149
Sant’Ana, L. D. O., Buarque Ferreira, A. B., Lorenzon, M. C. A., Berbara, R. L. L., &
Castro, R. N. (2014). Correlation of total phenolic and flavonoid contents of brazilian honeys with colour and antioxidant capacity. International Journal of Food Properties, 17(1), 65–76. https://doi.org/10.1080/10942912.2011.614368
Smith, F. G. (1967). Deterioration of the colour of honey. Journal of Apicultural Research, 6(2), 95–98. https://doi.org/10.1080/00218839.1967.11100165
Standard for Honey. (2001). CODEX STAN 12-1981, 11 Codex Alimentarius 7. http://teca.
fao.org/sites/default/files/resources/Annex A Codex Alimentarius Honey Standard.
pdf.
Szab´o, R., Mezes, M., Szalai, T., Zaj´acz, E., & Weber, M. (2016). Colour identification of honey and methodical development of its instrumental measuring. Columella :
Journal of Agricultural and Environmental Sciences, 3(1), 29–36. https://doi.org/
10.18380/SZIE.COLUM.2016.3.1.29
Tabachnick, B. G., & Fidell, L. S. (2013). Using multivariate statistics (6th ed.). Pearson Education.
The European Council. (2001). Council directive 2001/110/EC of 20 December 2001 relating to honey. In Official Journal of the European Union (pp. 47–52), 2001/110/EC https://eur-lex.europa.eu/legal-content/EN/TXT/PDF/?uri=CELEX:32001L0110
&from=en.
Tuberoso, C. I. G., Jerkovi´c, I., Sarais, G., Congiu, F., Marijanovi´c, Z., & Ku´s, P. M. (2014).
Color evaluation of seventeen European unifloral honey types by means of spectrophotometrically determined CIE L * - C*ab - h*ab chromaticity coordinates.
Food Chemistry, 145, 284–291. https://doi.org/10.1016/j.foodchem.2013.08.032