ANALYSIS OF TASTE INTERACTIONS WITH THE ELECTRONIC TONGUE
Thesis
DÁNIEL SZÖLLŐSI
Budapest
2015
PhD Program
Name: PhD School of Food Science Field: Food Science
Head: Prof. József Felföldi Corvinus University of Budapest
Supervisors: Prof. András Fekete†
Department of Physics and Control Faculty of Food Science
Corvinus University of Budapest period of supervision: 2010-2013
Prof. József Felföldi
Department of Physics and Control Faculty of Food Science
Corvinus University of Budapest period of supervision: 2013-
Zoltán Kovács, PhD
Department of Physics and Control Faculty of Food Science
Corvinus University of Budapest period of supervision: 2013-
The applicant met the requirement of the PhD regulations of the Corvinus University of Budapest and the thesis is accepted for the defence process.
.………...
……….………. .………...
Signature of Head of School Signature of Supervisors
1. Introduction
The taste of food and pharmaceuticals is one of the most important quality measures.
However, even if we know the exact composition of a sample (e.g. by measuring every component one by one) we hardly can tell anything about the taste of the sample, therefore analytical measurements are improper to address the problem. The concept of the electronic tongue is to measure a ‘fingerprint’ of the samples allowing sensitive comparison which makes the technique suitable for taste measurements. The scientific field of the electronic tongues is very active especially in possible applications. Searching in the Web of Science in December of 2015 for ’electronic tongue’ resulted 5192 hits (1226 if we search only in the titles) and the numbers are increasing.
An important part of our knowledge about the electronic tongue is how components of a sample interacts with each other and with the electronic tongue sensors. As the majority of the analyzed samples contain more than one dissolved components, interactions to occur is very likely. Most of the publications dealing with electronic tongue taste interactions describe bitter taste masking and the instrument is usually used as a bitterness detector and not much about the principle is reported.
In my work I explored the taste interactions affecting the Alpha Astree electronic tongue by analyzing the results on a global and also on individual sensor level. My conclusions contributes to the overall knowledge about the electronic tongue and assist later work with the instrument both in the experimental design and data analysis point of view.
In the experiments model solutions and food samples were used. The model solutions were prepared from compounds given in the sensory analysis standard and used alone or in combination in multiple concentrations. The measurement procedure was optimized to avoid known disturbing effects.
The analysis of compound interactions with the electronic tongue is a new research field of the Physics and Control Department.
2. Objectives
Samples analyzed by the electronic tongue usually contain more than one dissolved compound. Therefore the possibility of interactions is very high which also affects the analysis of the obtained measurement results. My objective was to explore and describe these interactions for the Alpha Astree electronic tongue by using model solutions and food samples. By analyzing the obtained results I made suggestions to aid later measurements. To achieve my aim I marked out the following task:
The analysis has to address interactions among all five basic tastes and their combinations.
Both qualitative and quantitative analysis of the measurement results has to be done on the individual sensor level and also on a global scale.
A measurement method need to be developed which minimizes the known measurement errors.
3. Materials and methods
3.1 The electronic tongue
My measurements were done by the Alpha Astree 2 potentiometric electronic tongue supplied by Alpha M.O.S. (Toulouse, France). The main components of the instrument is the sensor- array which contains seven working electrodes (labeled as ZZ, JE, BB, CA, GA, HA and JB) a Ag/AgCl reference electrode and a stirrer. The sensor array is held by an automatic sampler unit with a tray for 16 samples. The sensor signals are measured and converted by the electronic unit which connects to a desktop computer with the AlphaSoft software (ver. 12.4).
This later software collects and analyzes the data and controls the autosampler and sensors.
Before every measurement the electronic tongue was conditioned and calibrated according to the manufacturers recommendations.
3.2 Samples
Part of the experiments were done with model solutions. The applied compounds and concentrations were selected according to the sensory analysis standards [ISO/FIDS 3972:2011] assessor evaluation procedure. Table 1. shows the selected compounds and their concentrations along with the human and electronic tongue detection thresholds. In case of dilution sequences the presented concentration was the middle (median) in these series.
For comparison and correction purposes I also used distilled water (signed as ‘DW’ in the text and in figures) and a solution which contained all the compounds in Table 1. with lower concentrations (Table 1. third column). This later sample was signed as ‘centrum’ in the text and figures.
Table 1. Analyzed model solutions and their concentrations and detection thresholds
Compounds Concentration*, g/L
Concentration, M
Centrum concentration,
g/L
Human taste- threshold**,
M
Electronic tongue taste-threshold**,
M
citric-acid 0.280 0.0015 0.0885 0.0001 0.0000001
NaCl 1.190 0.0204 0.3763 0.001 0.000001
Na-glutamate 0.290 0.0017 0.0917 0.0005 0.0001
caffeine 0.195 0.0010 0.0617 0.0005 0.0001
sucrose 5.760 0.0168 1.8215 0.00065 0.00001
*[ISO/FIDS_3972:2011 2011] **[AlphaM.O.S. 2002a]
From the model solutions two and three component mixtures were also prepared in some case in multiple concentrations. The labeling of the mixture was done by enumerating the compounds dividing them by a ‘|’ sing.
From NaCl and caffeine a one component dilution series was prepared as several of my conclusions involved building predictive models. The concentrations were determined on a logarithmic scale with the value indicated in Table 1. in the ‘middle’.
Analysis of the interactions between citric-acid and NaCl as well as between NaCl and Na- glutamate different concentration combinations of these mixtures were prepared and measured.
To investigate interactions among sweet and biter compounds caffeine, quinine, sucrose and aspartame were analyzed alone and in paired combinations (concentrations were 0.195, 5.76, 0.00269 and 0.0288 g/L, respectively). The quinine concentration was determined according to the human taste threshold while the aspartame concentrations was set to get an equally sweet solution as for the sucrose.
The other part of the experiments were done with food samples purchased from retail sources.
They were the following: dilution series of tomato juice (100 – 0.01 mL/L in tenfold steps), dilution series of soy drink (1000 – 0.0001 mL/L in tenfold steps, measured in 2009), tenfold dilution of two apple juice samples alone and supplemented with 5 g/L NaCl (measured in
2012) and a tenfold diluted apple juice sample alone and complemented with different amounts of 1:3 mixture of glucose – fructose (added concentration was 1; 2.5; 5; 10; 20 g/L;
measured in 2010)
During the experiments the control samples (DW and centrum) were measured at the beginning and at the end of the measurement while the other samples were analyzed in between in a random order. Every sample was analyzed in nine replicates and after every sample the sensors were dipped into a cleaning solution (distilled water). Every other measurement parameter was setup according to the manufacturer’s recommendation.
3.3 Correction and statistical methods
The experiments usually take approximately four hours and therefore the drift of the sensor signals is unavoidable. This drift can be measured and corrected using the centrum sample measured at the beginning and at the end of the experiment assuming that the drift is linear during one measurement.
Two samples were considered different if at least one sensor showed significant difference detected by Welch-test (p<0.01). For the multivariate evaluation discriminant analysis was applied which is common in the electronic tongue filed. A great advantage of the technique is it transforms the original variables to a new variable set (roots) to maximize the difference among the predefined sample groups and minimize within these groups. The arrangement of the samples in the new variable space gives information about the similarities and differences among the samples.
Some conclusions were corroborated by regression models. For this purpose partial least squares regression (PLS) was used which gives optimal solution to regress the dependent variable (concentration in this case) with multivariate sensor signal data.
4. The summary of the results
4.1 Interaction of citric-acid and NaCl
The interaction of citric-acid and NaCl was evaluated by multiple concentration mixtures of these compounds including pure solutions. According to the discriminant analysis of all five one-component model solutions the two most differing samples were the citric-acid and the NaCl samples while the DW sample (which is assumed to be a neutral sample) took place between them which suggests that citric-acid and NaCl has opposite effect on the electronic
tongue. Discriminant analysis of the combined one and two component samples revealed that the mixture of citric-acid and NaCl notably modified the sensor signals compared to the one component solutions. The deviation of the mixture from the one component solution is toward the DW sample on the discriminant analysis plot which indicates that this is a masking effect.
Analyzing the different concentration combinations of citric-acid and NaCl turned out that based on the ZZ sensor the 0.028 g/L citric-acid and 11.9 g/L NaCl mixture shows similar signal levels as the DW sample. NaCl has less effect on samples with increasing citric-acid levels for the ZZ and BB sensors. In case of the CA sensor the sensor signal was determined by the NaCl level, however the pure citric-acid was significantly different from the DW sample. Sensor HA signals were also determined by the NaCl concentration. Interestingly the low NaCl level and arbitrary citric-acid concentration samples signal was the same as the DW sample (NaCl 0.119 g/L, t-test, p=0.30 and p=0.44) although the detection threshold of the HA sensor is far lower for citric-acid (10-6 M) or NaCl (10-4 M) than the applied concentrations.
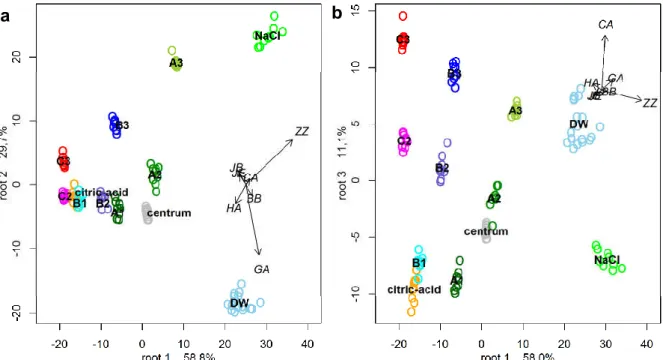
Figure 1. Discriminant analysis plots of different concentration mixtures of citric-acid and NaCl measured with the electronic tongue. Citric-acid concentrations were signed with A,B,C (0.028; 0.28; 2.8 g/L) while NaCl levels with 1,2,3 (0.119; 1.19; 11.9 g/L). Arrows in the figure show the coefficients of the original sensors in the discriminant model.
Discriminant analysis of the different concentration mixtures showed that according to the first and third roots (Figure 1.) samples with a certain citric-acid concentration arrange into a
a b
sequence on the discriminant analysis plot. The higher the NaCl concentration the farther from the pure citric-acid sample but towards the DW sample and not to the pure NaCl sample.
These results confirms that we see a masking effect.
A further evidence of the opposing effect of citric-acid and NaCl was obtained by building a predictive PLS regression model based on a NaCl dilution series using logarithmic concentrations (R2=0.96, RMSEP=0.2665). Predicting the apparent NaCl concentration with this model for the citric-acid|NaCl mixtures turned out that samples containing high concentration citric-acid has lower apparent NaCl concentration than the DW sample.
The above presented evidences suggest that while citric-acid can have a dominant effect on the electronic tongue, NaCl can significantly modify the sensor signals via a masking effect.
Comparing the results to the scientific literature showed that results obtained for the other commercially available electronic tongue (there are two altogether: the French Astree and the Japanese TS-5000Z) is consistency with my data.
4.2 Interaction of NaCl and Na-glutamate
Interactions of NaCl and Na-glutamate was analyzed with different concentration mixtures of these compounds. Discriminant analysis of the combined data of the one and two component model solutions showed that if we consider the DW sample as neutral starting point then NaCl, Na-glutamate and their mixture differs in the same direction in the discriminant model and the mixture is the farthest. This phenomenon suggests that NaCl and Na-glutamate has an additive interaction.
By analyzing the different concentration mixtures measurement result by electronic tongue sensors for the ZZ sensor the obtained signals were always higher compared to the DW sample and proportional to the total dissolved concentration. For CA, GA and HA sensors high NaCl concentrations strongly determine the signal level which indicates a saturation effect. In case of the HA sensor only samples with the highest concentration NaCl were significantly different from all the other (NaCl 11.9 g/L, t-test, p=2.21*10-8 and p=2.78*10-8), although the detection threshold provided by the electronic tongue manufacturer in this case is also lower than the investigated concentrations.
The derived conclusion is that the NaCl and the Na-glutamate has a similar effect on the electronic tongue sensors and their effect is additive, however, sensitivity for this two compounds are different.
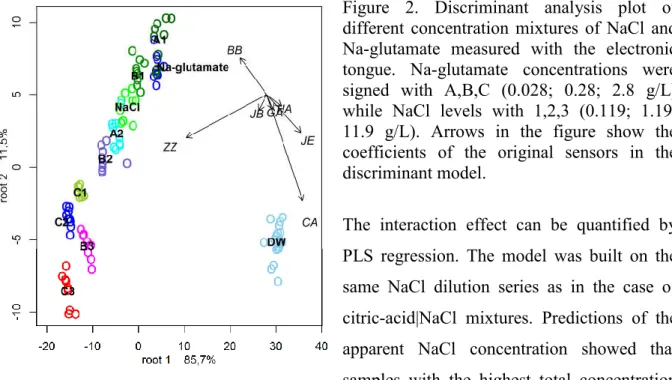
Discriminant analysis of the different concentration mixtures showed (Figure 2.) that sample data points arrange in a continuous sequence from the lowest to the highest total concentration sample and the one component solutions are also in the series which confirms the previous conclusion.
Figure 2. Discriminant analysis plot of different concentration mixtures of NaCl and Na-glutamate measured with the electronic tongue. Na-glutamate concentrations were signed with A,B,C (0.028; 0.28; 2.8 g/L) while NaCl levels with 1,2,3 (0.119; 1.19;
11.9 g/L). Arrows in the figure show the coefficients of the original sensors in the discriminant model.
The interaction effect can be quantified by PLS regression. The model was built on the same NaCl dilution series as in the case of citric-acid|NaCl mixtures. Predictions of the apparent NaCl concentration showed that samples with the highest total concentration resulted the highest apparent concentrations (e.g. 23.18 g/L for C3) while the DW and centrum samples were predicted with the lowest values (0.0097 and 0.0024 g/L, respectively).
The one component NaCl sample was predicted with a lower value than it truly was however, samples with higher total concentrations were predicted consistently higher.
A further evidence of the similar and additive effect of NaCl and Na-glutamate is their effect on citric-acid. By projecting the three component model solution measurement results into a discriminant model built from the one component solution results showed that pure and combined solutions of NaCl and Na-glutamate has a similar masking effect on the model solutions containing citric-acid.
The same Japanese group mentioned in the previous section also analyzed NaCl and Na- glutamate and found consistent results based on experiments with the commercially available electronic tongue. This also indicates that results of different electronic tongues are comparable.
4.3 Interaction of caffeine and sucrose with other substances
Analysis of interactions of bitter and sweet compounds are especially important because of the pharmaceutical applications of the electronic tongue. However effect of caffeine and sucrose on the electronic tongue sensors are smaller (~100 vs. ~1000 intensity value) compared to the ionic/acidic compounds but this does not mean that their effects are not significant.
Experiment with caffeine, sucrose, quinine and aspartame (0.195, 5.76, 0.00269 and 0.0288 g/L, respectively) alone and in paired mixtures were performed in order to compare two bitter and two sweet components. The obtained results showed that in some cases mixtures with totally different taste has undistinguishable sensor results (t-test, p>0.02). This means that there are sample pairs which are difficult to differentiate by the electronic tongue. A good example for that in the literature is the developmental difficulties of the sweetness sensor reported in several papers.
Results of ZZ sensor showed that mixtures of quinine|caffeine, aspartame|quinine and aspartame|caffeine have similar sensor signals than those of DW sample although, the corresponding one component solutions were found significantly different. This suggests that in some cases even when measurement data is available for the pure samples the result of the mixture is not predictable. These notions underline the importance of the interaction analysis of bitter and sweet components.
To get a detailed picture about the effect of caffeine on the electronic tongue sensors a dilution series from caffeine was prepared and a discriminant model on the measurement result including the DW sample was built. The first discriminant root contained 97.7% of the variance among the concentration groups and showed the increasing concentration direction.
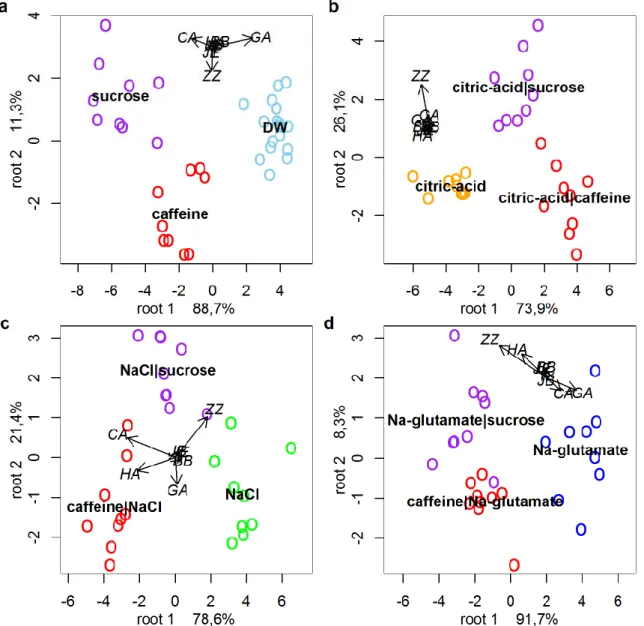
In this discriminant model results of the one and two component model solutions were projected in. If the effect of the caffeine is consistent than every sample containing caffeine should be shifted to the right (increasing caffeine concentration in the calibration data) compared to the corresponding solution without caffeine. This shift can be observed only for the DW-caffeine solution pair but if any other compound was in the mixture the effect of caffeine can not be detected by this discriminant model. The reason of this phenomenon is that the caffeine has a different effect in the presence of other compounds. Analyzing the same data with discriminant analysis but in groups containing a ‘stock’ solution (DW, citric- acid, NaCl or Na-glutamate, Figure 3.) and its caffeine or sucrose complemented version a good separation between the samples was found, the rate of correct classification was 97.2,
96.3, 100 and 96.3% respectively. Sensors responsible for the separation was different from solution to solution which confirms that the effect of caffeine and sucrose depend on the other compounds present in the solution.
This mechanism has not been described elsewhere in the scientific literature yet.
Figure 3. Distilled water, citric-acid, NaCl and Na-glutamate samples alone and in combination with caffeine or sucrose analyzed by discriminant analysis. Arrows in the figure show the coefficients of the original sensors in the discriminant models.
4.4 Taste masking and taste enhancement
Taste masking in the point of view of the electronic tongue was defined the following: the taste of a substance is masked if the pure component’s sensor signal can be differentiated from distilled water while in the presence of other (masking) compounds addition of this
(masked) compound does not change the measured electronic tongue signals. The phenomenon can be observed by comparing the two and three component mixtures of model solutions. While the citric-acid|caffeine – citric-acid|sucrose, NaCl|caffeine – NaCl|sucrose and Na-glutamate|caffeine – Na-glutamate|sucrose pairs are significantly different, in three component solutions only the citric-acid|Na-glutamate|caffeine - citric-acid|Na- glutamate|sucrose pair remained different. Other pairs which contained two ionic components and caffeine or sucrose seemed to be similar which suggests that the ionic components masked the effect of caffeine or sucrose. My results indicated that taste masking more likely affect substances with lower electronic tongue sensitivities.
In the human taste perception taste enhancement is a well-known phenomenon. The definition of the Codex Alimentarius Hungaricus says: A substance is a taste enhancer if it amplifies the food’s original flavor. In this work an effect was considered taste enhancement if an added component could amplify the effect of the original components. In electronic tongue measurement results the effect would show up as differences of samples are increasing by adding the same amount of taste enhancer to every sample.
Figure 4. Discriminant analysis plot of two commercially available 100% fruit content apple juices diluted tenfold and analyzed alone and by adding 5 g/L NaCl to both samples. Arrows in the figure show the coefficients of the original sensors in the discriminant models.
The taste enhancement could be observed in apple juice measurements were the samples were analyzed alone and by adding 5 g/L NaCl to both samples. Discriminant analysis of these samples (Figure 4.) showed that the originally undistinguishable samples could be differentiated after the addition of the same amount of NaCl which is confirmed by the sensor signals t-test.
4.5 Concentration dependence of the interactions
The concentration dependence of interactions could be observed in numerous electronic tongue experiments performed with model solutions but also in earlier food measurements. In this summary only one example is highlighted.
Analyzing the sensor signals of a dilution series of 100% fruit content tomato juices (concentrations 0.01 – 100 mL/L, in tenfold steps) showed that in case of the ZZ (Figure 5.) and CA sensors the tendency of the sensor signals turn over as the concentration is increasing.
Figure 5. ZZ sensor signals obtained from the dilution series of 100% fruit content tomato juices. The x axis shows the mL/L tomato juice concentration.
The turnover of the tendency at the concentration of 10 mL/L indicates that the nature of interaction among the tomato juice compounds is changing with the concentration. In light of this (and the other here not shown) results the interactions among the sample compounds depends from their concentration. A dramatic change in the behavior can be observed within tenfold of concentration change (100 mL/L 10 mL/L).
4.6 Interaction among samples in different beakers
In all the previous cases the interaction were defined as an effect between compounds in the same sample holding beaker. However, because of the different measurement disturbing effects (drift, continuous conditionment of the sensors during the measurement or ‘off conditionment’, memory effect) interactions are possible among samples in different vessels.
The phenomenon has some similarity when one tastes lemon juice and after that the taste of tap water appears to be sweet.
These kind of effects could be detected by analyzing the electronic tongue measurement results of a NaCl dilution series, different concentration citric-acid|NaCl mixtures and different concentration NaCl|Na-glutamate mixtures by projecting them into the discriminant analysis plot built on the one component model solutions. In every case there were similar samples present in at least two of the measurements. If there is no ‘off conditionment’ during the projected measurements then the same samples have to get similar positions on the discriminant analysis plot after correction of the raw data.
In all the three cases the DW sample was correctly predicted. In case of the NaCl dilution series the 0.119 g/L NaCl dilution is well positioned to its counterpart solution from the one component measurement. This indicates that in this case there was no interaction among the samples or at least it was successfully corrected.
Projections of the citric-acid|NaCl mixtures showed that while the pure citric-acid sample was correctly predicted, position of the NaCl sample was considerably shifted. The continuous conditionment (or drift) of the electronic tongue sensors explain this phenomenon. As in this measurement the samples were mixtures of two different compounds the effect on the sensors are more complex than for the NaCl dilution series.
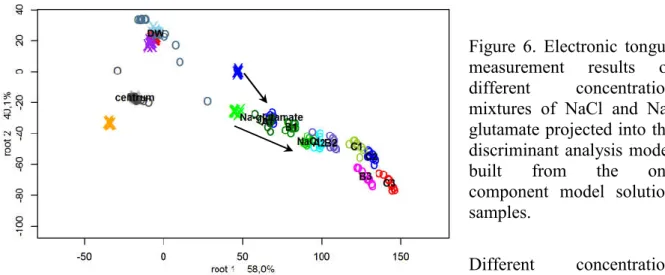
Figure 6. Electronic tongue measurement results of different concentration mixtures of NaCl and Na- glutamate projected into the discriminant analysis model built from the one component model solution samples.
Different concentration mixtures of NaCl and Na-glutamate projected into the discriminant analysis model built from the one component model solution samples (Figure Figure 6.) shows that while the DW samples were correctly predicted, positions of the pure NaCl and Na-glutamate samples were shifted and interestingly into the same direction (arrows on the figure). Taking into account that previous results indicated a similar effect of the tested compounds on the electronic tongue the ‘off conditionment’ is the most likely to occur in this experiment. The fact that the shift of the positions has the same direction in the plot and points toward the highest concentration sample (C3) confirms that these samples interact with each other without being in the same beaker.
Analyzing the amount of correction needed in the different experiments during this work the following observations can be done. Longer measurements (more samples) needed stronger correction. The biggest drift was observed for the different concentration NaCl|Na-glutamate mixtures for the individual electronic tongue sensors and also in summary. In the different measurements the electronic tongue sensors were differently affected.
Based on these observations I concluded that interaction is possible among samples in different sample holders. The effect is stronger in longer measurements and depends on the samples composition participating the experiment.
4.7 A method for analyzing taster interactions with the electronic tongue
A measurement protocol was developed to obtain results and establish conclusions investigating the electronic tongue taste interactions. Important differences of this method compared to the electronic tongue’s manufacturer’s recommendations is the application of control samples at the beginning and at the end of the experiment. These samples enable to measure and correct the drift occurring during the measurement which decrease the deviation of the sample results and enhance discrimination thus makes experiments performed at different days more comparable.
The applied data analysis was also different compared to the ‘conventional’ evaluation while the analysis was performed also on the individual sensor level. Moreover the evaluations included the comparison of samples with Euclidean distances which is used in several recent papers. Critical points of the method are the following: The analyzed samples should be in the experiment alone and in mixtures using relevant concentrations. The usage of control samples like distilled water and some kind of average sample. The usage of data correction. The random sequence of the tested non-control samples. Analysis of the data on sensor and global level. The effects can be quantified by partial least squares regression.
Measurement of complex solutions (foods) need special attention as in this case the analyzed sample is already a mixture and the change of concentration affects immediately the interactions. The technique can analyze and validate the relationship between the human taste perception and electronic tongue measurements.
5. New scientific results
I formulated my conclusions based on the experiments performed with the Alpha Astree electronic tongue equipped with a sensor array for food samples. These conclusions are absolutely valid for this system. However, I think my results significantly contributes to the knowledge about the instrument as well. Moreover the analyzed samples which are common components of foods and the work gives a new view point for analyzing electronic tongue data. My conclusions are the following:
1. The citric-acid and the NaCl has a masking effect on each other for the electronic tongue sensors in mixtures of relevant concentrations.
2. The NaCl and the Na-glutamate has similar and additive effect for the electronic tongue sensors in mixtures of relevant concentrations.
3. The effect of caffeine and sucrose depends on other compounds present in the solution and interactions has strong effect to the measured signal. The interactions are not additive and poorly predictable.
4. Taste masking and taste enhancement is possible in the point of view of the electronic tongue which means that the perceived difference of a samples pair can be increased (apple juices, NaCl) and decreased (caffeine in citric-acid|NaCl mixture) by adding a certain component.
5. Interactions of sample components are concentration dependent.
6. The results of a sample are dependent form the other samples present in the same experiment because of the continuous conditionment of the electronic tongue sensors.
7. A method was developed to analyze interactions affecting the electronic tongue measurement results. Key notions are the following
Evaluation of pure and mixed samples in different concentrations simultaneously
Usage of control samples
Data correction
Random sample order for the non-control samples
Analysis of the results on senor and global level
6. Practical suggestions
My conclusions also have some practical concerns which are the following.
1. Interaction of the citric-acid and NaCl both for the human and for the instrumental taste sensing (in concentrations above the detection thresholds) show similar behavior and mutually mask each other effect. This also means that the electronic tongue is an appropriate tool for taste measurements in the point of view of citric-acid and NaCl.
2. The additive interaction of NaCl and Na-glutamate is similar both for the human and electronic tongue taste sensing in above-threshold concentrations. This is a further evidence that electronic tongue measurements correlate with human sensory analyzes.
3. Results suggest that measuring samples containing caffeine and/or sucrose need special attention. In most of the commonly used multivariate techniques effect of these compound ‘hide’ in higher sequential number latent variables. Previously not analyzed sample’s sensor values are not deducible from the pure components’ measurement results.
4. Taste masking interaction for the electronic tongue can be a limiting factor for certain cases were the important compound is masked by other sample constituents e.g. the effect of caffeine was masked in the presence of citric-acid and NaCl. In spite of this, taste enhancement can be used to increase the electronic tongue’s sensitivity by adding compounds highlighting the differences between samples e.g. apple juices complemented with NaCl.
5. Concentration of the examined samples affect the interactions. Therefore in future experiments the measured samples should be in an even narrower concentration range than three order of magnitude (recommended by the manufacturer) as significant changes can occur within a tenfold change. The interaction change (and along with that the electronic tongue sensor signal change) caused by concentration change can be also exploited to increase the sensitivity of the electronic tongue. In case of concentration measurements if the samples are known to have a concentration dependent interaction change (as sawn for the tomato juice) than by setting the evaluated samples close to this concentration, differences among the samples would increase and discrimination is easier.
6. As samples can interact with each other without being in the same sample beaker the composition of the whole experiment is very important if all the samples can be only measured in multiple experiments. Markedly different samples (sour, sweet, etc.) should evenly distributed in the individual experiments and balance in this way the between-sample interactions and making the conditionment during the measurement uniform therefore the correction procedure efficient.
7. The method developed for interaction analysis can be used for further interaction experiments with no or only minor adaptation modifications.
7. Publications concerning the thesis Papers in journal with impact factor
D. Szöllősi, Z. Kovács, A. Gere, L. Sipos, Z. Kókai and A. Fekete (2012) Sweetener recognition and taste prediction of coke drinks by electronic tongue, IEEE Sensors Journal, 12 3119-3123. (IF: 1,475)
D. Szöllősi, D. L. Dénes, F. Firtha, Z. Kovács and A. Fekete (2012) Comparison of six multiclass classifiers by the use of different classification performance indicators, Journal of Chemometrics, 26 76-84. (IF: 1,937)
Z. Kovács, L. Sipos, D. Szöllősi, Z. Kókai, G. Székely and A. Fekete (2011) Electronic tongue and sensory evaluation for sensing apple juice taste attributes. Sensor Letters Volume 9, Number 4, August 2011 , pp. 1273-1281(9). (IF: 0,819)
Papers in foreign language journal without impact factor
Z. Kovács, D. Szöllősi and A. Fekete (2009) Application of electronic tongue to soya drink discrimination. Progress in Agricultural Engineering Sciences, Volume 5, Number 1, pp. 75- 96/December 18
Papers in Hungarian language journal without impact factor
D. Szöllősi, Z.Kovács and A. Fekete (2010) Hőmérséklet hatása modell oldatok és almalevek elektronikus nyelvvel mért eredményeire. Élelmiszer Tudomány Technológia LXIV:(2) pp.
40-43.
Full papers in conference proceedings
D. Szöllősi, Z. Kovács, A. Gere, L. Sipos, Z. Kokai and A. Fekete (2011) Sensory evaluation and electronic tongue analysis for sweetener recognition in coke drinks. AIP Conference Proceedings,1362 (1):193-194.
Z. Kovács, D. Szöllősi, A. Fekete and S. Isz (2011) Sensing Basic Tastes by Electronic Tongue Sensors. AIP Conference Proceedings ,1362 (1):73-74.
D. Szöllősi, Z. Kovács, L. Sipos, Z. Kókai, R. Romvári and A. Fekete, (2011) APPLICATIONS OF ELECTRONIC TONGUE, Synergy in the Technical Development of Agriculture and Food Industry (Synergy2011), Gödöllő, Hungary, 2011.
D. Szöllősi, Z. Kovács, E. Várvölgyi and A. Fekete (2013) The effect of glucose on electronic taste analyser. 2013 ASABE Annual International Meeting. Kansas, United States of America, 2013.07.21-2013.07.24. Kansas: pp. 3752-3755
Abstracts in conference proceedings
D. Szöllősi, Z. Kovács, A. Gere, L. Sipos, Z. Kókai and A. Fekete (2011) Sensory evaluation and electronic tongue analysis for sweetener recognition in coke drinks. 14th International Symposium on Olfaction and Electronic Nose (ISOEN 2011) New York city, New York, USA, 2-5, May 2011
D. Szöllősi, Z. Kovács and A. Fekete (2011) Mutivariate models for soft drink classification, in: Károly Héberger (Ed.) Conferentia Cemometrica 2011, Chemometric Section, Hungarian Chemical Society, Automatic Analysis and Chemometric Working Group of the Hungarian Academy of Sciences, Sümeg, Hungary, pp. P44.
8. Acknowledgement
I would like to thank the help and support for my:
Supervisors: Dr. András Fekete
Dr. József Felföldi
Dr. Zoltán Kovács
I acknowledge the contribution and help for:
Dr. Attila Szöllősi
Evelin Várvölgyi
Dr. László Sipos
János Soós
Dr. Eszter Vozáry
The staff of the Department of Physics and Control at Corvinus University of Budapest
The Hegelab.
I also would like to thank the support and patience for my wife and for my whole family.