DOI: 10.1556/446.14.2018.S1.2
1786-335X @ 2018 Akadémiai Kiadó, Budapest
Application of Near Infrared Spectroscopy and Classical Analytical Methods for the Evaluation
of Hungarian Honey
ZSANETT BODOR1,FANNI ADRIENN KONCZ2,MAHMOUD SAID
RASHED2,TIMEA KASZAB2,ZOLTAN GILLAY2,CSILLA BENEDEK1, ZOLTAN KOVACS2
Abstract. People have recently started to pay more attention to the healthier lifestyle, which also includes the consumption of more natural and less processed food products. Honey as one of the most often used natural sweeteners has also been reconsidered and more commonly used. However, honey has also been the target of food adulteration due to its emerging use and relatively high price. Therefore, there is an increasing need to develop rapid evaluation methods for the identification of honey from different sources. Experiments have been performed with 79 authentic honey samples of different floral and geographical origins, mainly from Hungary. The standard analytical parameters used to characterize the nutritional values of honey such as antioxidant capacity, polyphenol content, ash content, pH, conductivity have been determined. The samples were also analyzed with a benchtop near infrared (NIR) spectrometer to record their NIR spectra. The data acquired with NIR spectroscopy measurements were evaluated with various univariate and multivariate statistical methods. Results gained with a limited sample set show that NIR spectroscopy might be useful for the identification of floral and geographical origin of honey samples. Further experiments are proposed to build a robust database, which could support the use of NIR spectroscopy as a quick alternative for honey authentication.
Keywords: Hungarian honey, NIR, chemometrics, authentication
1Department of Dietetics and Nutrition Sciences, Faculty of Health Sciences, Semmelweis University, 17 Vas str., 1088 Budapest, Hungary,
E-mail: zsanett.bodor93@gmail.com
2Department of Physics and Control, Faculty of Food Science, Szent Istvan University, 14-16 Somloi str., 1118 Budapest, Hungary, E-mail: kovacs@correltech.hu
1. Introduction
Whether from flower nectar or the juice secreted from leaves under the action of insects, honey is a particularly valuable natural product, rich in nutritional components such as vitamins, minerals, antioxidants and organic acids. On the other hand, its composition and quality depend on the floral and geographical origin, both having an important impact on price.
As a consequence, honey is prone to adulteration, methods ranging from feeding bees with sugar syrups to blending honeys from different floral or geographical sources. Detection of adulteration includes various analyses from chromatographic techniques to nuclear magnetic resonance spectroscopy. The limitation of these methods is that they are time- consuming and expensive. Generally, a wide range of quality indicators are needed in order to detect honey adulteration, but new methods are also necessary (Zábrodská & Vorlová, 2015). As cheap and fast techniques, specific physicochemical and antioxidant properties can represent a good choice, especially when combined with other target methods (Cimpoiu et al., 2013) (Jose et al., 2009). Typically, NIR instruments cover some or all of the wavelength range of 700–2500 nm. This wavelength range is a reduced requirement for sample preparation, making it a more practical option for routine industrial analysis (Farkas & Dalmadi, 2009). Near infrared spectroscopy (NIRS) can be a fast and simple tool for identifying adulterated honey (Bazar et al., 2016). Data processing with different statistical analyses – for instance discriminant analysis (DA) or principal component analysis (PCA) – are suitable for detecting differences between floral and geographical origins. These can also support identification of adulterated honeys measured by NIR spectroscopy (Guelpa et al., 2017).
Although Hungary is one of the main honey importer countries, data referring to Hungarian honeys is very limited.
2. Materials and Methods 2.1. Honey samples
In this study 79 honey samples of different floral and geographical origins were analyzed. To ensure authenticity, honeys were collected mainly from the producers but we have also procured some commercial products for
comparison. All of the 60 Hungarian honeys are from honey producers, including samples of acacia, false indigobush, honeydew, pine, chestnut, buckwheat, linden, linden-chestnut, raspberry, milk thistle, mustard, sunflower, canola, canola-fruit, canola-linden, bear’s garlic, meadow sage, silkgrass and multiflora honeys. We also tested some samples from other European countries and samples of non-European origin. Hungarian honeys were collected from different parts of Hungary (Fig. 1). The samples were stored at room temperature.
Figure 1. Map of the geographical origin of Hungarian honeys
2.2. Methods
2.2.1. Physicochemical properties
Classical honey analytical parameters (ash, pH, conductivityy, total water soluble matter by refractometry) were determined according to the International Honey Committee methods (Bogdanov et al., 2002)
.
2.2.2. Total polyphenol content and antioxidant capacity
Sample preparation
1.0 g of honey sample was diluted 10 times with distilled water and this solution was used for antioxidant measurements. Ferric Reduction Antioxidant Power assay (FRAP) and Total polyphenol content (TPC) measurements were performed with the Thermo Helios Alpha UV-VIS spectrophotometer (±0.001 au) using cells of 1 cm pathlength.
Total polyphenol content
Total polyphenol content was determined by the Folin–Ciocalteu method, following a procedure adapted from Singleton & Rossi (1965). 1 ml of the honey sample solution was put in a test tube, and 7.5 ml distilled water was added. Then 0.5 ml of the Folin–Ciocalteu reagent was given to each tube and after 3 minutes 1 ml Na2CO3 solution was added. Absorbances were read at 750 nm after a 30-minute incubation period in the dark. Results were expressed as mg equivalents of gallic acid (GAE) per 100 g honey.
Ferric Reducing Antioxidant Power assay
In FRAP experiments, the reduction power of honeys was estimated according to the procedure described by Benzie & Strain. (1996). The freshly prepared FRAP reagent contained 25.0 ml of 300 mM acetate buffer, 2.5 ml of 10 mM TPTZ solution in 40 mM HCl, 2.5 ml of 20 mM iron (III) chloride solution. For the measurements 500 μl honey stock solution was given to 15 ml of FRAP reagent, rigorously shaken, incubated at 37 °C for an hour and measured at 653 nm against a blank. Results were reported as mg ascorbic acid equivalent (ASE) /g honey.
2.2.3. NIR spectroscopy
NIR absorption spectra of honey samples were recorded by Spectralyzer (PMC Spectralyzer 10–25 infrared spectrophotometer) in the range between
1000 and 2500 nm with 2 nm spectral resolution in transflectance mode.
Samples were analyzed in a randomized order and each sample was measured twice in different days to gain a more robust database. Reference spectrum was taken before every sample. Each honey sample was measured with three consecutive measurements. The layer thickness of the tested honey sample was 0.4 mm.
2.3. Statistical analysis
The R-project software was applied for data processing and analysis of the absorption spectra of the samples using the spectral range between 1100 and 1800 nm. Smoothing with Savitzky-Golay smoothing filter (Press &
Numerical Recipes, 1992) (2nd order polynomial and 21 points) and multiplicative scatter correction (MSC) (Næs et al., 2002) were used as pre- treatment before the multivariate data evaluation. The second derivative spectra were also calculated with Savitzky-Golay smoothing filter (21 points) for visualization of the absorption peaks.
Principal component analysis (PCA) (Cowe & McNicol 1985) was used to detect patterns and to visualize the information present in the multivariate spectral dataset and to provide orthogonal variables for supervised classifications of linear discriminant analysis (LDA). Linear discriminant analysis was used to develop classification models for identification of floral and geographical origin of the honey samples. LDA models were tested with three-fold-cross-validation, when one third of the sample set was excluded from the calibration set, and the generated model was validated on these retained samples. The procedure was repeated three times iteratively to ensure that all the samples were included in the validation set once. LDA models were evaluated by the ratio of correctly classified samples in the cross-validations.
3. Results and Discussion 3.1. Results of the classical
analytical methods
These indicators, obtained in the preliminary measurements of the honey samples, are used for characterization of honeys and interpretation of the data obtained by NIR.
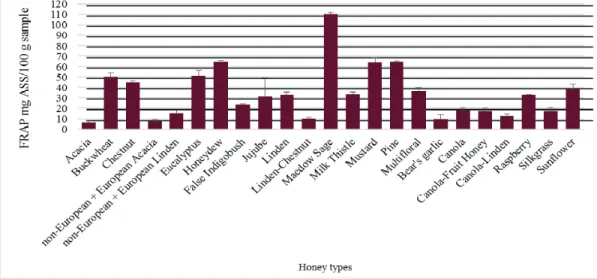
3.1.1. FRAP-Ferric Reducing Antioxidant Power results
The antioxidant capacity and polyphenol content are belonging to important properties of honey. According to the literature for honeys from the same floral origin similar values were shown, but significant variances were found between honeys from different botanical sources, especially honeydew honeys. Low ferric reducing antioxidant power was measured in acacia and canola honeys (average: 6.6 mg ± 1.5 ASE/100g, respectively 18.0± 2.6 mg ASE/100g). Higher capacity were found in honeydew and chestnut honeys (average: 44.9 ±1.4 mg ASE/100g, respectively 64.8 ±1.5 mg ASE/100g). Comparable trends were observed in total polyphenol content values.
Fig. 2. Average and standard deviation of FRAP antioxidant capacity of the tested honey samples grouped by botanical origin (n = 79)
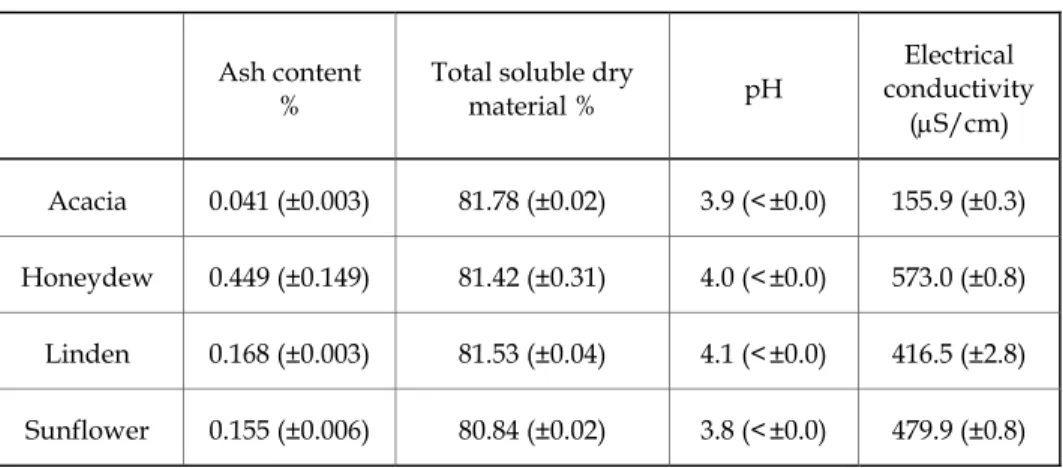
3.1.2. Physicochemical properties
Target physicochemical parameters used for honey characterization.
Average values for some selected honeys are given in Table 1.
Table 1. Physicochemical properties of the tested honey samples (average and standard deviation)
Ash content
%
Total soluble dry
material % pH
Electrical conductivity
(μS/cm) Acacia 0.041 (±0.003) 81.78 (±0.02) 3.9 (<±0.0) 155.9 (±0.3) Honeydew 0.449 (±0.149) 81.42 (±0.31) 4.0 (<±0.0) 573.0 (±0.8) Linden 0.168 (±0.003) 81.53 (±0.04) 4.1 (<±0.0) 416.5 (±2.8) Sunflower 0.155 (±0.006) 80.84 (±0.02) 3.8 (<±0.0) 479.9 (±0.8)
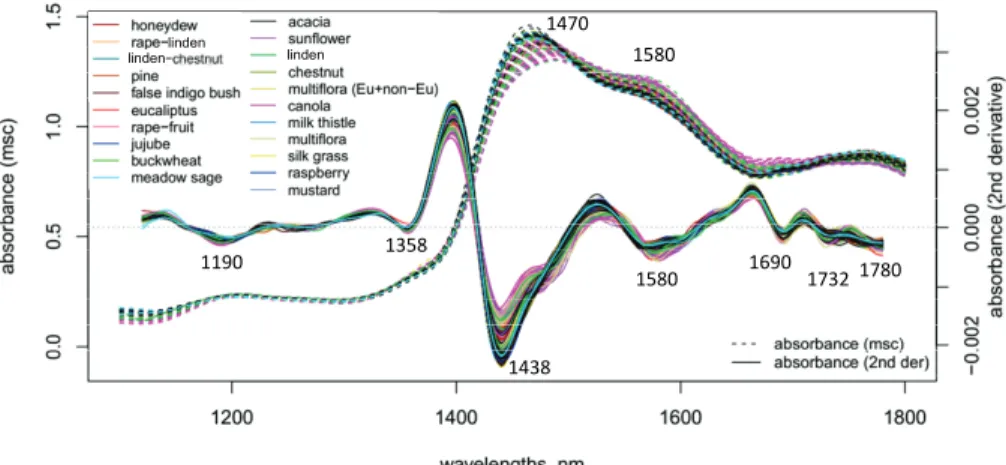
3.2. Results of NIR spectroscopy
Smoothed, MSC-transformed and 2nd derivative absorption spectra of the tested honey samples are shown in Fig. 3. The peaks of the 2nd derivative spectra reveal the underlying peaks of the overlapped bands presenting the broad peak of water (i.e. first overtone combination of symmetric and asymmetric stretching of O-H) around 1470 nm (Segtnan et al., 2001) and C–H stretching in sugars at 1690, 1732 and 1780 nm (Golic et al., 2003).
Results of the PCA calculation based on the spectral data of the entire sample set provided some separation of the different sample groups based on floral and geographical origin as well, but it was difficult to interpret this due to the many different samples.
1190 1358
1438
1580 1690
1732 1780 1470
1580
linden lindenlinden
Fig. 3. Smoothed (Savitzky-Golay 21 points) and MSC transformed spectra and 2nd derivative (Savitzky-Golay 21 points) spectra of the analyzed honey samples
(n = 309)
a,
b,
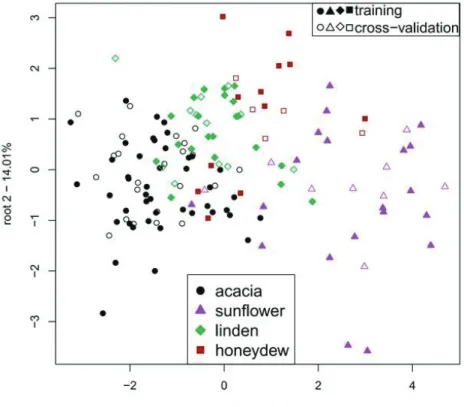
Fig. 4. (a) PCA score plot presenting the separation of the four main floral groups and (b) loadings of PC1 – PC2 calculated after eliminating the outliers (n = 146)
Floral types with at least five samples were selected to calculate PCA (Fig. 4) and to build classification models with LDA to test the ability of NIRS for floral origin identification (Figs. 5 and 6).
Groups of sunflower honey samples showed the best separation from the rest of the sample groups based on PC1 (Fig. 4) and based on root 1 (Figs. 5 and 6), presenting more than 93% of the total variance and nearly 83% of between group variance, respectively. The LDA model presented average recognition and prediction abilities of 81% and 75%, respectively (Table 2) for the classification of acacia, honeydew, linden and sunflower samples.
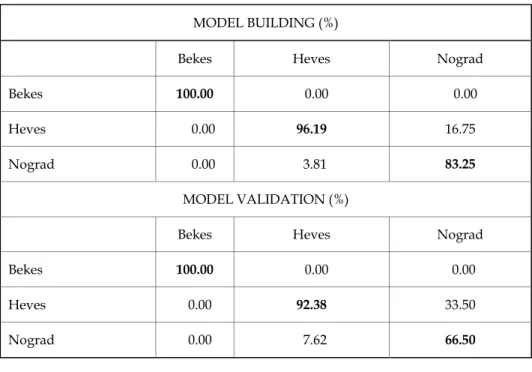
Classification models were also developed for the discrimination of the honey samples based on their geographical origin for the individual floral types. Results summarized in Table 3 present the classification performance for sunflower samples providing average recognition and prediction abilities of 93% and 86%, respectively.
Fig. 5. LDA score plots root 1 – root 2 presenting the separation of the different floral groups after eliminating the outliers (n = 146)
Fig. 6. LDA score plots root 1 – root 3 presenting the separation of the different floral groups after eliminating the outliers (n = 146)
Table 2. LDA results for discriminating honey floral origin using NIRS MODEL BUILDING (%)
Acacia Honeydew Linden Sunflower
Acacia 97.02 17.65 16.68 6.88
Honeydew 0.74 64.70 1.50 5.17
Linden 2.24 8.83 77.27 3.47
Sunflower 0.00 8.83 4.55 84.48
MODEL VALIDATION (%)
Acacia Honeydew Linden Sunflower
Acacia 89.53 11.82 18.17 13.77
Honeydew 3.00 64.73 6.09 6.94
Linden 4.48 17.64 69.66 3.42
Sunflower 3.00 5.82 6.09 75.88
Table 3. LDA results for discriminating the tested sunflower honey samples based on geographical origin using NIRS
MODEL BUILDING (%)
Bekes Heves Nograd
Bekes 100.00 0.00 0.00
Heves 0.00 96.19 16.75
Nograd 0.00 3.81 83.25
MODEL VALIDATION (%)
Bekes Heves Nograd
Bekes 100.00 0.00 0.00
Heves 0.00 92.38 33.50
Nograd 0.00 7.62 66.50
3. Conclusion
The high nutraceutical value of Hungarian honeys was proven by presenting their high antioxidant activities. It has been shown that there are significant differences between samples of different botanical origin. These origin-related differences are in good correlation with those reported for honeys from other geographical regions and showed the same trends as those observed in NIR data.
NIR spectra of the honey samples provide information about the chemical composition of honey which might be useful for identification of the samples originating from different floral or geographical sources.
Classification model built for the identification of the floral origin of the main honey types provided average recognition and prediction abilities of 81% and 75%, respectively. Identification of geographical origin of the honey samples was also possible with satisfactory accuracy for the individual floral types with the tested limited sample set.
Our results show that the application of NIR spectroscopy might have a great importance in the authentication of honeys, however, further
experiments are proposed to build up a robust spectrum library which can serve as a base of more sophisticated chemometrics models.
Acknowledgments
This paper was supported by the János Bolyai Research Scholarship of the Hungarian Academy of Sciences
Supported BY the ÚNKP-16-2-1 (Zsanett Bodor), ÚNKP 17-2 (Zsanett Bodor, Fanni Adrienn Koncz) and ÚNKP-17-4 (Zoltan Kovacs) New National Excellence Program of the Ministry of Human Capacities.
References
Bazar, G., Romvari, R., Szabo, A., Somogyi, T., Eles, V., & Tsenkova, R. (2016). NIR detection of honey adulteration reveals differences in water spectral pattern. Food Chem, 194, 873–880. doi: 10.1016/j.foodchem.2015.08.092
Benzie, I. F. F., & Strain, J. J. (1996). The Ferric Reducing Ability of Plasma (FRAP) as a Measure of “Antioxidant Power”: The FRAP Assay. Analytical Biochemistry, 239(1), 70–76. doi: http://dx.doi.org/10.1006/abio.1996.0292
Bogdanov, S., Martin, P., & Lullmann, C. (2002). Harmonised methods of the international honey commission. Swiss Bee Research Centre, FAM, Liebefeld.
Cimpoiu, C., Hosu, A., Miclaus, V., & Puscas, A. (2013). Determination of the floral origin of some Romanian honeys on the basis of physical and biochemical properties. Spectrochim Acta A Mol Biomol Spectrosc, 100, 149–154. doi:
10.1016/j.saa.2012.04.008
Czipa, N. (2010). Különböző eredetű mézek összehasonlító vizsgálata és a gyártmánykialakítás hatása a minőségre. Hankóczy Jenő Növénytermesztési, Kertészeti és Élelmiszertudományok Doktori Iskola. Retrieved from https://dea.lib.unideb.hu/
dea/bitstream/handle/2437/99459/ertekezes.pdf?sequence=5
Farkas, J., & Dalmadi, I. (2009). Near infrared and fluorescence spectroscopic methods and electronic nose technology for monitoring foods. Progress in Agricultural Engineering Sciences, 5(1), pp. 1–29
Golic, M., Walsh, K., & Lawson, P. (2003). Short-wavelength near-infrared spectra of sucrose, glucose, and fructose with respect to sugar concentration and temperature.
Appl Spectrosc, 57(2), 139–145. doi: 10.1366/000370203321535033
Guelpa, A., Marini, F., du Plessis, A., Slabbert, R., & Manley, M. (2017). Verification of authenticity of South African honey and fraud detection using NIR spectroscopy.
Food Control, 73, 1388–1396. doi: http://dx.doi.org/10.1016/j.foodcont.2016.11.002 Jose, M. A.-S., Sara, T., Stefania, R., Alexis, V., & Maurizio, B. (2009). Methodological
aspects about determination of phenolic compounds and in vitro evaluation of
antioxidant capacity in the honey: A review. Current Analytical Chemistry, 5(4), 293–
302. doi: http://dx.doi.org/10.2174/157341109789077768
Næs, T., Isaksson, T., Fearn, T., & Davies, T. (2002). A user-friendly guide to multivariate calibration and classification. Chichester: NIR.
Press, W. H., & Numerical Recipes, S. (1992). Numerical recipes in C. Cambridge [England]; New York, N.Y.: Cambridge University Press.
Segtnan, V. H., Šašić, Š., Isaksson, T., & Ozaki, Y. (2001). Studies on the structure of water using two-dimensional near-infrared correlation sSpectroscopy and principal component analysis. Analytical Chemistry, 73(13), 3153–3161. doi: 10.1021/ac010102n Singleton, V. L., & Rossi, J. (1965). Colorimetry of total phenolics with phosphomolybdic- phosphotungstic acid reagents. Am. J. Enol. Vitic., 16(3), 144–158. doi: citeulike- article-id:7170825
Zábrodská, B., & Vorlová, L. (2015). Adulteration of honey and available methods for detection–a review. Acta Veterinaria Brno, 83(10), 85–102.