Article
Sensory and Physicochemical Evaluation of Acacia and Linden Honey Adulterated with Sugar Syrup
Zsanett Bodor1 , Zoltan Kovacs1 , Mahmoud Said Rashed1, Zoltán Kókai2, István Dalmadi3 and Csilla Benedek4,*
1 Department of Physics and Control, Faculty of Food Science, Szent István University, HU-1118 Budapest, Hungary; Bodor.Zsanett@hallgato.uni-szie.hu (Z.B.); kovacs.zoltan3@etk.szie.hu (Z.K.);
mahmoud.said@alexu.edu.eg (M.S.R.)
2 Department of Postharvest Science, Trade and Sensory Evaluation, Faculty of Food Science, Szent István University, HU-1118 Budapest, Hungary; kokai.zoltan@etk.szie.hu
3 Department of Refrigeration and Livestocks’ Products Technology, Faculty of Food Science, Szent István University, HU-1118 Budapest, Hungary; dalmadi.istvan@etk.szie.hu
4 Department of Dietetics and Nutrition, Faculty of Health Sciences, Semmelweis University, HU-1088 Budapest, Hungary
* Correspondence: benedek.csilla@se-etk.hu
Received: 11 August 2020; Accepted: 25 August 2020; Published: 27 August 2020 Abstract:Honey is produced by honeybees and is used as a food and medical product. Adulteration of honey has been a problem for several years now because of the relatively high price of honey on the market according to its valuable composition. The aim of our study is to determine the physicochemical properties of authentic Hungarian linden and acacia honeys (pure samples or manipulated ones blended with sugar syrup) as well as commercially available blends of European Union (EU) non-European Union (non-EU) honeys. Authentic linden and acacia were blended with sugar syrup at 10%, 20% and 50% concentration levels, and physicochemical properties were determined according to the methods of the International Honey Commission. Our objectives also included testing of the performance of electronic sensory techniques (electronic tongue (ET) and electronic nose (EN)) in the detection of adulteration, and the results are compared to the sensory profile analysis. The results provide good average recognition and prediction abilities for the classification of adulterated and authentic honeys (>90% for ET and higher than>80 for EN).
Misclassifications were found only in the case of honey with 10% added sugar syrup. The methods were also able to reveal adulteration of independently predicted samples.
Keywords: honey; electronic nose; electronic tongue; sensory analysis; adulteration
1. Introduction
Honey is a supersaturated sugar solution produced by honeybees(Apis mellifera). Its two main sugars are glucose and fructose, but other di- and trisaccharides are also present [1]. Depending on their botanical and geographical origin, vitamins, minerals, phenolic acids, flavonoids, organic acids and amino acids are present in honey in different amounts [2–8]. Origin also has an effect on the sensory profile of honeys [9–11]. Both composition and sensory attributes can be influenced by processing and storage conditions [12]. In recent years, honey adulteration has increased significantly because of its relatively high market price and its popularity due to its valuable nutritional content. Fraud related to honey include several procedures, e.g., feeding bees with different sugar syrups (indirect method) and blending honeys with the syrups (direct method). Depending on the plant source, the syrups used for honey adulteration are either C3 (e.g., rice, beet and wheat) or C4 (e.g., corn and cane) sugars.
Sensors2020,20, 4845; doi:10.3390/s20174845 www.mdpi.com/journal/sensors
Further known types of adulteration are mislabelling honeys as coming from a different geographical location, application of heat treatment for elimination of naturally formed crystals or dyeing honey with sulphite-ammonia caramel to get more favourable colours [13].
Fraud detection related to the botanical or geographical origin of honey is a challenging task due to the complex composition of honey. Promising but time-consuming, destructive and expensive instrumental analyses are used by researchers and authorities to check the authenticity of honey, e.g., nuclear magnetic resonance (NMR), isotopic ratio mass spectrometry coupled with elemental analysis and liquid chromatography (EA/LC-IR-MS), or three-dimensional fluorescence spectroscopy [14]. However, pollen analysis combined with physicochemical properties and sensory analysis are the most commonly used techniques for identifying the botanical origin of honey [15].
Detection of certain adulterations of honey is also possible with the physicochemical and colour attributes of honeys. Amiry et al. (2017) used physical, rheological, colour and chemical parameters of honey to build models for the detection of honey containing invert sugar syrup at 7%, 14% and 30%.
Physical and chemical parameters provided promising results based on the linear discriminant analysis models built [14]. Turkish researchers analysed natural honey mixed with fructose and sucrose syrup at the 10%, 20%, 30%, 40% and 50% levels. The decreasing tendency in pH, ash content, a* (redness) and b* (yellowness) were found to be in an inverse correlation with the increasing adulteration level, while L* (lightness) increased [16]. In a Brazilian study, blossom honey was adulterated with high fructose content corn syrup at the 10%, 25%, 50%, 75% and 100% levels. In this study, increasing pH, L* and moisture content while decreasing b* were found as adulteration level increased [17].
In previous studies, sensory parameters were used for the detection honey adulteration by both lay consumers and trained panels. Brazilian researchers adulterated citrus honey with glucose syrup at the 20% and 50% levels. Consistency, the specific smell, sweet taste and colour of honeys were compared. Based on the scores given by the consumers, the consistency of the samples was found to be different [18]. Guler et al. (2008) tested the sensory properties of honey adulterated by feeding bees with sucrose syrup. For filtered honeys, significant differences were found in odour, flavour and taste, while in comb honeys, there were no significant differences between the control and adulterated honeys [19]. These studies show that sensory evaluation is applicable for the detection of adulterated honey. However, this technique is usually used for discrimination between honeys from different botanical origins [20]. Instrumental sensory analyses, such as the electronic nose (EN) or electronic tongue (ET), can also be successfully applied for testing the authenticity of food, including bee products [21]. Several studies report the application of the electronic tongue and nose for the identification of origin and for the detection of adulteration of honey. Malaysian researchers used both ET and EN and combined these techniques to identify the botanical origin of honey and to discriminate honey samples adulterated with sugar syrup. Linear discriminant analysis (LDA) models provided higher than 90% classification accuracy when ET and EN methods were applied separately, while 100% accuracy was reached by the fusion of the data of both techniques [22]. In a Spanish research, a pulse voltammetric electronic tongue was applied with Principal Component Analysis (PCA) to distinguish between honey samples adulterated at different levels by using different syrups.
Results showed good separation not only for syrups and honey types but also between pure honey and adulterants, and Partial Least Square (PLS) models were able to predict the concentration and type of adulterant [23]. Oroian et al. [24] also applied a voltammetric electronic tongue for the detection of adulteration of honey containing different syrups at the 0–50% levels of adulteration. The electronic tongue achieved an 83.33% correct classification in the differentiation of honeys adulterated with different syrups, while 97.56% was achieved for pure honey and 100% was achieved for correct classification of adulterated honey.
It can be concluded that the electronic tongue, electronic nose and sensory analysis have been used successfully to detect the adulteration of honey. It is important to mention that mostly voltammetric electronic tongue techniques were used. Moreover, the three methods, sensory profile analysis, electronic tongue and electronic nose, have not been applied together for the detection of the honey
adulteration. Finally, they have not been used to predict the authenticity of blended honeys of both EU and non-EU origins.
Therefore, in this study, our objective is to determine the physicochemical and sensory properties of acacia and linden honeys pure or with added sugar syrup and to analyse the ability of electronic tongues and electronic noses compared to sensory profile analysis in the detection of adulteration of the aforementioned honeys. Moreover, our goal was to build a model able to predict the authenticity of blended honeys originating from both European Union and non-European Union countries.
2. Materials and Methods
2.1. Samples
Acacia (Robinia pseudoacacia)and linden (Tiliaspp.) honeys were analysed in our study: 22 acacia and 12 linden honeys were collected in total. Of these, 10 acacia and 3 linden honeys were purchased from retail and labelled as blends of European Union and non-European Union honeys (from here on, EUnonEU acacia and EUnonEU linden) in accordance with the European Council (EC) legislation [25].
The EUnonEU honey blends are coded according to their honey type and registration number in our database (e.g., HL_98 for linden honey and HA_100 for acacia honey). The authentic samples (11 acacia and 9 linden) were collected directly from beekeepers. The geographical origins of the authentic samples can be seen in Table1.
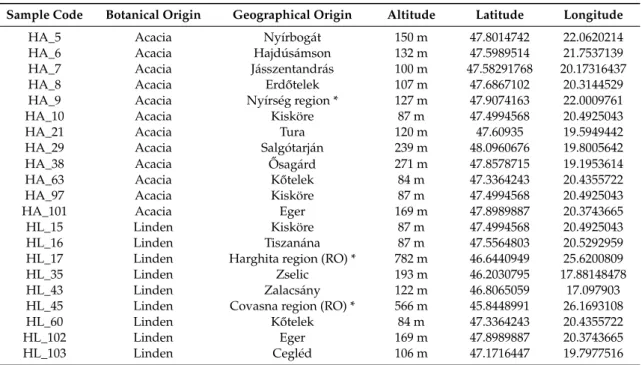
Table 1.Botanical and geographical origins of authentic honey samples.
Sample Code Botanical Origin Geographical Origin Altitude Latitude Longitude
HA_5 Acacia Nyírbogát 150 m 47.8014742 22.0620214
HA_6 Acacia Hajdúsámson 132 m 47.5989514 21.7537139
HA_7 Acacia Jásszentandrás 100 m 47.58291768 20.17316437
HA_8 Acacia Erd˝otelek 107 m 47.6867102 20.3144529
HA_9 Acacia Nyírség region * 127 m 47.9074163 22.0009761
HA_10 Acacia Kisköre 87 m 47.4994568 20.4925043
HA_21 Acacia Tura 120 m 47.60935 19.5949442
HA_29 Acacia Salgótarján 239 m 48.0960676 19.8005642
HA_38 Acacia Osagárd˝ 271 m 47.8578715 19.1953614
HA_63 Acacia K˝otelek 84 m 47.3364243 20.4355722
HA_97 Acacia Kisköre 87 m 47.4994568 20.4925043
HA_101 Acacia Eger 169 m 47.8989887 20.3743665
HL_15 Linden Kisköre 87 m 47.4994568 20.4925043
HL_16 Linden Tiszanána 87 m 47.5564803 20.5292959
HL_17 Linden Harghita region (RO) * 782 m 46.6440949 25.6200809
HL_35 Linden Zselic 193 m 46.2030795 17.88148478
HL_43 Linden Zalacsány 122 m 46.8065059 17.097903
HL_45 Linden Covasna region (RO) * 566 m 45.8448991 26.1693108
HL_60 Linden K˝otelek 84 m 47.3364243 20.4355722
HL_102 Linden Eger 169 m 47.8989887 20.3743665
HL_103 Linden Cegléd 106 m 47.1716447 19.7977516
* Only projections are given for regions. Source:https://www.mapcoordinates.net/en.
Sugar syrup (glucose-fructose) was mixed with an authentic acacia and an authentic linden honey in concentrations of 10% (1:9), 20% (1:4) and 50% (1:1), resulting in three model adulterated samples for each botanical type. These are coded as A10, A20 and A50 and as L10, L20 and L50, where “A” is for acacia and “L” is for linden. The numbers denote the concentration of sugar syrup in %.
2.2. Methods
2.2.1. Reference Methods Physicochemical Indicators
The physicochemical indicators of honey samples (ash content, electrical conductivity, pH and total soluble dry matter (TSDM%) by refractometry) were determined according to the International Honey Commission method book [26]. Each sample was measured in three replicates, resulting in 120 observations.
Sample Preparation for Antioxidant Capacity Assays
Sample preparation for each method was the same: 1.0 g of honey was weighed on an analytical scale, then dissolved in distilled water and filled up to 10 mL in volumetric flasks. Each sample was measured in five replicates, resulting in 200 observations per each parameter.
Total Polyphenol Content (TPC)
Total polyphenol content was measured by the Folin–Ciocalteau method [27]. Of the honey sample solution, 1 mL was put in a test tube and 7.5 mL distilled water was added. Then, 0.5 mL of the Folin–Ciocalteu reagent was given to each tube, and after 3 min, 1 mL Na2CO3solution was added.
Absorbance values were read at 750 nm with a Heliosα-spectrophotometer after 30 min of incubation in the dark. Gallic acid was used as a calibration standard.
Ferric Reduction Antioxidant Power (FRAP)
As a first step of this method, as described by Benzie and Strain [28], the FRAP reagent was prepared: 0.54 g FeCl3was measured in a 100 mL volumetric flask and dissolved up to volume with distilled water, and 0.3123 g 2,4,6-tripyridyl-S-triazine (TPTZ) was dissolved up to 100 mL with 40 mM HCl. The two solutions were mixed with 500 mL acetate buffer at pH 3.6. Following the preparation of the reagents, 500µL of the honey sample was pipetted in a test tube and then 7.5 mL of the FRAP reagent solution was added. This solution was incubated at 37◦C for an hour and then measured at 653 nm. Ascorbic acid was used as a calibration standard.
Cupric Ion Reducing Antioxidant Capacity (CUPRAC)
The procedure was developed by Apak et al. [29]. For the measurement, 1 mL of CuCl2(10−2M), 1 mL of NH4-acetate buffer solution (pH=7), 1 mL of neocuproine solution (0.156 g neocuproine in 100 mL ethanolic solution), 200µL of the honey sample solution and 0.9 mL distilled water were mixed.
After 30 min of incubation in the dark, the solutions were measured at 450 nm. Trolox was used as a calibration standard.
Sugar Determination by HPLC
The sugar composition (fructose, glucose and saccharose) was determined by RP-HPLC (Waters, Milford, Massachusetts, USA), with a refraction index detector, using the Kromasil 100-5 NH2MZ column (250 mm×4.6 mm, particle size of 5µm). The flow rate was 1.5 mL/min, the detection was performed at 25◦C, and the mobile phase was 28:72v/vwater acetonitrile solution.
Glucose, fructose and saccharose standards were prepared at three different concentration levels for the calibration. Honey samples were prepared in two replicates: 1 g honey was dissolved in analytically pure distilled water, then transferred to a 100 mL volumetric flask and filled up to volume.
These solutions were filtered through a Chromafil XTRA RC45/24 filter, and then a 10µL sample was injected.
Colorimetric Measurement
Determination of colorimetric properties of different honeys was performed in the CIE (International Commission on Illumination) L*a*b* tristimulus coordinate system with Konica Minolta 410 colorimeter in five replicates per sample, resulting in 200 observations. L* is assigned to the lightness (0–100, higher L* values denote lighter samples), a* values (−50–+50) are assigned to the greenish (negative direction) or reddish (positive direction) hue, while b* values (−50–+50) are assigned to the blueish (negative direction) or yellowish (positive direction) hue.
2.2.2. Sensory Profile Analysis
The sensory profile analysis of honeys was performed in a sensory laboratory, fulfilling the requirements of the relevant International Organization for Standardization (ISO) standards [30–32].
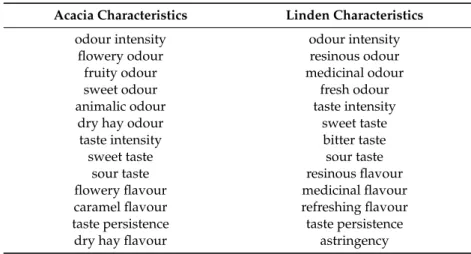
The sensory panel consisted of 12 members. In the sensory test, six acacia and six linden honeys were tested; for each floral type, two authentic honeys were used as references. Samples included one EUnonEU honey (HA_100 and HL_98 honeys) and three honey samples with added sugar syrup (10%, 20% and 50% sugar syrup content). The two honey types (acacia and linden) were tested in two different sessions. Each honey type was tested in two independent sessions by the same sensory panel. Honeys were examined based on odour and taste/flavour characteristics, with 13–13 properties per each honey type shown in Table2. The sensory attributes were chosen from the honey aroma wheel [20]. Honeys were diluted with water in a 4:1 ratio for better sensory differentiation.
Table 2.Sensory properties of acacia and linden honeys defined by the sensory panel.
Acacia Characteristics Linden Characteristics
odour intensity odour intensity
flowery odour resinous odour
fruity odour medicinal odour
sweet odour fresh odour
animalic odour taste intensity
dry hay odour sweet taste
taste intensity bitter taste
sweet taste sour taste
sour taste resinous flavour
flowery flavour medicinal flavour
caramel flavour refreshing flavour
taste persistence taste persistence
dry hay flavour astringency
2.2.3. Electronic Tongue (ET)
Electronic tongue (ET) measurements were performed by an αAstree electronic tongue [33]
which was designed to recognize and analyse the dissolved compounds in liquid samples. The ET consists of a sensor array with seven potentiometric CHEMFET (chemically modified field effect transistor) sensors developed for food applications and an Ag/AgCl reference electrode. During the measurement, the potential difference is recorded between the reference electrode and the individual working electrodes which depends on the chemical composition of the sample, providing a unique fingerprint of the tested liquid samples. A tenfold dilution was prepared for the electronic tongue measurement: 10.0 g honey was weighted in and filled up to volume in a 100 mL volumetric flask.
Three replicate honey samples were tested in repeated measurements on three different days, resulting in 9 repetitions per day. Honeys which were used for the sensory profile analysis were tested in two replicates on two different days. For each measurement day, two reference sample were measured to be able to correct the drift of the different days as a result of ageing of the sensors. After outlier detection, 447 observations were acquired for acacia and 207 were acquired for linden honeys.
2.2.4. Electronic Nose (EN)
Electronic nose measurements were performed using an NST3320 type electronic nose (Applied Sensor A.G., Linköping, Sweden) with a built-in headspace autosampler for 12 samples. In the sample chamber, 23 different sensors can be found: 10 MOS FET (metal oxide semiconductor field effect transistor) sensors, 12 MOS (metal oxide semiconductor) sensors, and a sensor for humidity acquisition. As a reference gas, ambient air was used, which was filtered through a silica gel column and a moisture/hydrocarbon filter. The gas flow rate of the dynamic sampling was set to 50 mL/min.
The sequence of EN measurements began with the equilibration of the sample at 30◦C for 15 min.
Then, the reference air was pumped over the sensor surfaces for 10 s (baseline), followed by the honey head space for 30 s (sampling time), while the sensor signals were recorded. The sample analysis was followed by the recovery phase which was set to 260 s including the flush time of the gas lines with the filtered air prior to the next sample injection allowing reestablishment of the baseline of the instrument. Altogether, the total cycle time was 500 s. Each honey sample was measured three times with three consecutive measurements, resulting in nine replicates per sample. After outlier detection, 162 observations were left for acacia honeys and 115 were left for linden honeys.
2.2.5. Statistics
Statistical evaluation of data was performed by descriptive statistics for the results of the methods mentioned in the Reference Methods Section2.2.1 normality of the residuals was tested with the Shapiro–Wilk test followed by ANOVA evaluations with either the post hoc Tukey test or Games–Howell test. For the latter, homogeneity of variances was not assumed based on the results of the Levene test for the detection of significant differences between determined groups [34]. Significant differences among the groups of EUnonEU, authentic and adulterated honeys were analysed. Moreover, ANOVA models were also built to check the significant differences among authentic acacia and some selected individual EUnonEU blends from both types of honey. In the case of linden honey, all EUnonEU honeys (HL_79, HL_83 and HL_98) were used for the ANOVA test. In the case of acacia honey, four samples were chosen (HA_78, HA_84, HA_99 and HA_100) based on the results of the independent prediction, in order to have samples from suspected adulterants and non-adulterants.
Multivariate statistics like principal component analysis (PCA) and linear discriminant analysis (LDA) were applied on the results of ET and EN. PCA was used for the identification of outliers as an exploratory data evaluation method and for visualization of the main patterns and information of the multivariate sensor set. Before the analyses, in the case of electronic tongue results, a drift correction (additive correction relative to reference samples) was used for correcting the drift between different measurement days [35]. LDA classification models were built for the two honey types separately.
Models were built for the classification of authentic honeys (non-adulterated, collected from beekeepers) and the adulterated ones by 10%, 20% and 50%. For the chosen EUnonEU honeys, an independent prediction was applied on the built classification models to detect which one classified as authentic honey or else as a sugar syrup blend honey to be able to exclude the suspicion of adulteration.
LDA models and an independent prediction were built with a three-fold-cross-validation. Partial least square regression (PLSR) with leave-one out cross validation (LOO) was applied to predict the sensory properties of the acacia and linden honeys using the results of the electronic tongue and nose separately.
The parameters provided significant differences between on the one hand the authentic and adulterated honeys and between the authentic and EUnonEU honeys on the other. The regression error was analysed using root mean square error (RSMEC) in the case of training and using RMSECV in the case of validation. The sensory properties of the chosen EUnonEU samples (HA_99, HA_78, HA_84, HL_79 and HL_83) were predicted using the PLSR prediction model built for the 6–6 samples (the samples which were tested in the sensory profile analysis) based on the data of the electronic nose and tongue separately. R-project 3.5.2, SPSS 25 and Microsoft Excel software were used for statistical analysis.
3. Results
3.1. Results of the Reference Methods
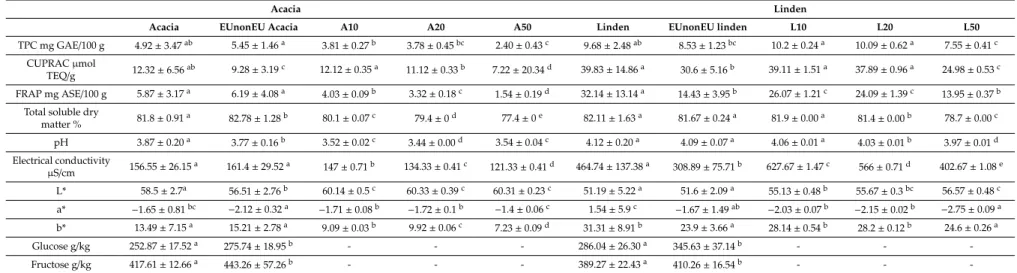
The results of the reference methods for acacia and linden honeys can be found in Table3.
Physicochemical indicators such as total soluble dry matter, pH and electrical conductivity showed lower values for the adulterated samples compared to authentic honeys in the case of acacia honeys.
For linden honeys, electrical conductivity showed higher results compared to authentic honeys, but a decreasing tendency was noticed by the increase of syrup concentration. The higher values in adulterated honey can be explained by the fact that, on the one hand, authentic honeys have high standard deviation and, on the other hand, the honey that was diluted with the syrup had high electrical conductivity (681±1.87µS/cm) itself. Adulterated honeys had significantly lower total soluble dry matter (TSDM%) content compared to authentic honeys in both honey types. ANOVA results of the chosen individual honey types (Table4) showed significantly higher total soluble dry matter content in the case of HA_100 and HA_84 honeys, while HA_78 had significantly lower TSDM%
compared to authentic acacia honeys. Compared to the authentic honeys, the results of linden honey revealed insignificant differences in both TSDM% and pH.
The results of the sugar composition showed (Table3) that authentic linden and acacia honeys had significantly lower glucose and fructose contents compared to the EUnonEU honeys; however, fructose/glucose ratios were similar to the fructose glucose ratio determined by the International Honey Commission (IHC): authentic acacia 1.66±0.14, EUnonEU acacia 1.61±0.22, authentic linden 1.31±0.14 and EUnonEU linden 1.19±0.08 [36].
Colour evaluation of honey (Table3) provided a similar tendency for linden and acacia honeys.
The L* value of adulterated honey was significantly higher, with dilution resulting in lighter honeys, while a* and b* were significantly lower, resulting in greener and less yellowish honey blends.
These results are in accordance with the results of Brazilian and Turkish studies [16,17].
The results of antioxidant capacity measurements of acacia honeys showed a decreased capacity with an increased ratio of sugar syrup (Table3). In the case of acacia honeys, A50 had a significantly lower total polyphenol content than authentic acacia, EUnonEU acacia and A10. The results of the antioxidant capacity measurements showed that A50 had significantly lower CUPRAC and FRAP values compared to the other groups. Significantly lower CUPRAC results were obtained for EUnonEU honeys compared to authentic honeys. A10 and A20 also resulted in significantly lower FRAP values compared to authentic honey and EUnonEU acacia honeys. The results of the ANOVA test for the chosen commercial EUnonEU (Table4) honeys showed that HA_100 and HA_99 honeys had significantly lower antioxidant capacity compared to authentic honeys. There was no significant difference in the total polyphenol content (TPC). HA_78 had significantly higher FRAP, albeit not significantly lower CUPRAC values. The linden honey results showed significantly lower TPC for L50 honey compared to authentic, L10 and L20, while there was no significant difference between L50 and EUnonEU honeys. A significantly lower antioxidant capacity was found in the L50 and EUnonEU linden honeys in comparison with authentic honey. Individual EUnonEU linden honey results (Table4) revealed significantly lower FRAP and CUPRAC scores in the case of HL_83 and HL_98, while HL_79 had significantly lower FRAP results compared to authentic linden honey.
Table 3.Physicochemical, antioxidant and colour properties of acacia and linden honey types.
Acacia Linden
Acacia EUnonEU Acacia A10 A20 A50 Linden EUnonEU linden L10 L20 L50
TPC mg GAE/100 g 4.92±3.47ab 5.45±1.46a 3.81±0.27b 3.78±0.45bc 2.40±0.43c 9.68±2.48ab 8.53±1.23bc 10.2±0.24a 10.09±0.62a 7.55±0.41c CUPRACµmol
TEQ/g 12.32±6.56ab 9.28±3.19c 12.12±0.35a 11.12±0.33b 7.22±20.34d 39.83±14.86a 30.6±5.16b 39.11±1.51a 37.89±0.96a 24.98±0.53c FRAP mg ASE/100 g 5.87±3.17a 6.19±4.08a 4.03±0.09b 3.32±0.18c 1.54±0.19d 32.14±13.14a 14.43±3.95b 26.07±1.21c 24.09±1.39c 13.95±0.37b
Total soluble dry
matter % 81.8±0.91a 82.78±1.28b 80.1±0.07c 79.4±0d 77.4±0e 82.11±1.63a 81.67±0.24a 81.9±0.00a 81.4±0.00b 78.7±0.00c pH 3.87±0.20a 3.77±0.16b 3.52±0.02c 3.44±0.00d 3.54±0.04c 4.12±0.20a 4.09±0.07a 4.06±0.01a 4.03±0.01b 3.97±0.01d Electrical conductivity
µS/cm 156.55±26.15a 161.4±29.52a 147±0.71b 134.33±0.41c 121.33±0.41d 464.74±137.38a 308.89±75.71b 627.67±1.47c 566±0.71d 402.67±1.08e L* 58.5±2.7a 56.51±2.76b 60.14±0.5c 60.33±0.39c 60.31±0.23c 51.19±5.22a 51.6±2.09a 55.13±0.48b 55.67±0.3bc 56.57±0.48c a* −1.65±0.81bc −2.12±0.32a −1.71±0.08b −1.72±0.1b −1.4±0.06c 1.54±5.9c −1.67±1.49ab −2.03±0.07b −2.15±0.02b −2.75±0.09a b* 13.49±7.15a 15.21±2.78a 9.09±0.03b 9.92±0.06c 7.23±0.09d 31.31±8.91b 23.9±3.66a 28.14±0.54b 28.2±0.12b 24.6±0.26a
Glucose g/kg 252.87±17.52a 275.74±18.95b - - - 286.04±26.30a 345.63±37.14b - - -
Fructose g/kg 417.61±12.66a 443.26±57.26b - - - 389.27±22.43a 410.26±16.54b - - -
Mean±standard deviation. Letters denote the significant differences between groups based on results of ANOVA followed by the Games–Howell pairwise comparison separately for acacia and linden honey types. Samples with no results were not analysed for the sugar composition.
Table 4. Significant differences of blends of honeys of both European and non-European Union origins in physicochemical and colour results for linden and acacia honeys.
TPC mg GAE/100 g N=5/Sample
CUPRACµmol TEQ/g N=5/Sample
FRAP mg ASE/100 g n=5/Sample
Total Soluble Dry Matter % n=3/Sample
pH n=3/Sample
Electrical ConductivityµS/cm n=3/Sample
Glucose g/kg n=2/Sample
Fructose g/kg n=2/Sample
Authentic Acacia 4.92±3.47 12.32±6.56 5.87±3.17 81.8±0.91 3.87±0.2 156.55±26.15 252.87±17.52 417.61±12.66
HA_100 4.37±0.67 5.68±0.42 *** 1.35±0.21 *** 85±0.14 *** 3.52±0.01 *** 158.67±0.41 312.41±2.27 *** 503.42±0.88 ***
HA_78 6.93±1.26 9.30±0.72 8.16±0.24 *** 81.4±0 * 3.73±0 *** 116.00±0 *** 275.90±6.34 ** 476.35±2.74 ***
HA_84 6.01±0.42 11.2±1.66 7.40±3.12 84.2±0 *** 3.84±0 175.00±0 *** 271.00±8.16 409.27±13.94
HA_99 4.94±1.20 5.68±1.39 *** 2.40±0.96 ** 81.8±0 3.76±0 ** 173.67±0.41 *** NA NA
Authentic Linden 9.68±2.48 39.83±14.86 32.14±13.14 82.11±1.63 4.12±0.2 464.74±137.38 286.04±26.30 389.27±22.43
HL_79 9.44±1.14 37.02±2.64 17.98±1.55 *** 81.8±0 4.17±0 388.67±0.41 ** 310.49±1.86 *** 394.81±0.25
HL_83 7.41±1.11 28.72±1.7 *** 12.34±5.31 *** 81.6±0.28 4.03±0.02 * 212±1.41 *** 380.77±3.56 *** 425.72±4.25 ***
HL_98 8.74±0.4 26.05±1.23 *** 12.97±0.29 *** 81.6±0.28 4.05±0.01 326±1.22 *** NA NA
Mean±standard deviation. The asterisk * denotes the significant differences from authentic honeys based on the results of ANOVA test followed by the pairwise comparison: *p<0.05,
**p<0.01 and ***p<0.001.
3.2. Results of the Sensory Profile Analysis
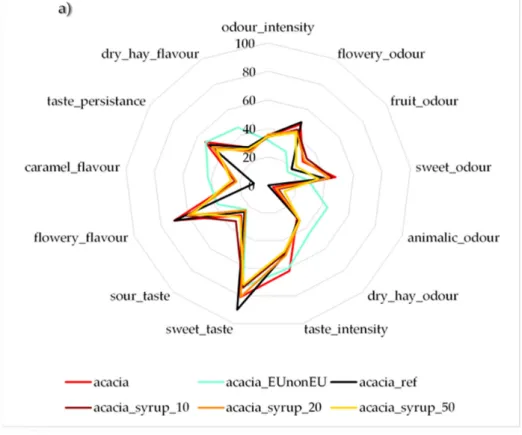
The sensory profile of adulterated and authentic acacia honeys is shown in Figure 1a.
The evaluation revealed significant differences between the reference and adulterated honeys in four parameters: A10 honey reached a significantly higher score for fruity odour, A10 and A50 received significantly lower sweet taste and flowery taste scores, while A20 and A50 had significantly higher caramel taste scores compared to reference honey (p<0.05), based on results of ANOVA test followed by the Games–Howell post hoc test. However, other parameters showed differences that were not statistically significant: adulterated honeys had lower odour scores (odour intensity and fruity odour) and higher values in sweet odour, animalic odour, fruit odour and dry hay odour. Taste parameters showed lower values in the case of intensity, sweetness, flowery, dry hay taste and taste persistence.
Higher values were obtained for caramel flavour and sour taste. The EUnonEU acacia honey showed significant differences from at least one of the authentic honeys in flowery, sweet and animalic odour and in sweet, flowery and caramel taste. Sugar composition analysis showed that the EUnonEU honey blend had higher glucose and fructose contents (312.41 g/kg and 503.42 g/kg) than the reference honey (285.04 g/kg and 414.64 g/kg), which can explain of the sweeter taste and odour perceived.
The results of the linden honey sensory evaluation (Figure1b) showed significant differences between reference and adulterated honey for eight parameters (p<0.05): L10 was significantly different in fresh odour; L20 was different in sour taste; L50 was different in bitter taste and medicinal flavour;
and L10, L20 and L50 were different in taste and odour intensity and in sweet taste. Odour intensity, resinous odour, taste intensity, sweet, bitter, medicinal taste, astringency and taste persistence were weaker in adulterated samples, while refreshing and sour taste, and fresh and medicinal odour were stronger compared to the reference linden sample. The mixture of EU and non-EU originated honey showed significant differences from at least one of the authentic linden honeys in seven parameters:
taste intensity and persistence, refreshing, medicinal and bitter taste, taste intensity, resinous odour and odour intensity. Turkish researchers found also significant differences in aroma, taste and odour between pure and adulterated honeys [19].
Sensors 2020, 20, x 10 of 20
3.2. Results of the Sensory Profile Analysis
The sensory profile of adulterated and authentic acacia honeys is shown in Figure 1a. The evaluation revealed significant differences between the reference and adulterated honeys in four parameters: A10 honey reached a significantly higher score for fruity odour, A10 and A50 received significantly lower sweet taste and flowery taste scores, while A20 and A50 had significantly higher caramel taste scores compared to reference honey (p < 0.05), based on results of ANOVA test followed by the Games–Howell post hoc test. However, other parameters showed differences that were not statistically significant: adulterated honeys had lower odour scores (odour intensity and fruity odour) and higher values in sweet odour, animalic odour, fruit odour and dry hay odour. Taste parameters showed lower values in the case of intensity, sweetness, flowery, dry hay taste and taste persistence.
Higher values were obtained for caramel flavour and sour taste. The EUnonEU acacia honey showed significant differences from at least one of the authentic honeys in flowery, sweet and animalic odour and in sweet, flowery and caramel taste. Sugar composition analysis showed that the EUnonEU honey blend had higher glucose and fructose contents (312.41 g/kg and 503.42 g/kg) than the reference honey (285.04 g/kg and 414.64 g/kg), which can explain of the sweeter taste and odour perceived.
The results of the linden honey sensory evaluation (Figure 1b) showed significant differences between reference and adulterated honey for eight parameters (p < 0.05): L10 was significantly different in fresh odour; L20 was different in sour taste; L50 was different in bitter taste and medicinal flavour; and L10, L20 and L50 were different in taste and odour intensity and in sweet taste. Odour intensity, resinous odour, taste intensity, sweet, bitter, medicinal taste, astringency and taste persistence were weaker in adulterated samples, while refreshing and sour taste, and fresh and medicinal odour were stronger compared to the reference linden sample. The mixture of EU and non- EU originated honey showed significant differences from at least one of the authentic linden honeys in seven parameters: taste intensity and persistence, refreshing, medicinal and bitter taste, taste intensity, resinous odour and odour intensity. Turkish researchers found also significant differences in aroma, taste and odour between pure and adulterated honeys [19].
Figure 1.Cont.
Figure 1. Results of the sensory profile analysis of (a) acacia and (b) linden honey, n = 12/parameter.
3.3. Results of Electronic Tongue Analysis
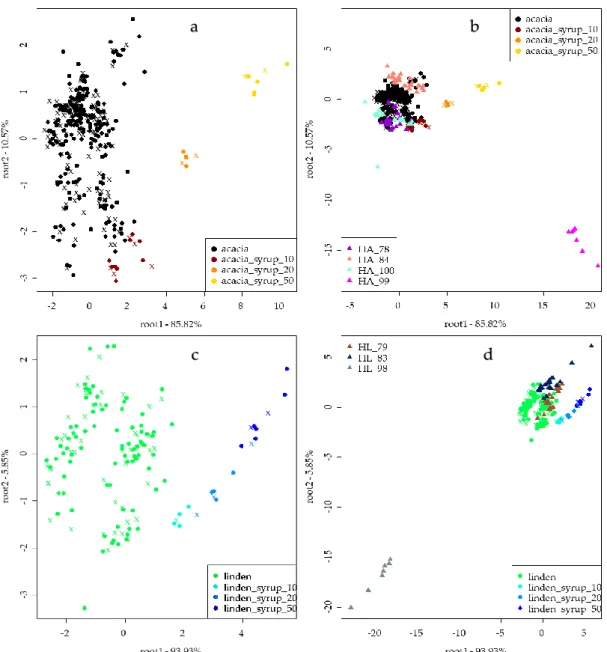
The LDA model built for the classification of authentic acacia and linden honeys based on the results of an electronic tongue can be seen in Figure 2. For both honey types, separation tendencies can be observed through root 1, according to the level of adulteration. Nevertheless, on root 2, separation of adulterants can be seen. The model of acacia honeys (Figure 2a) all presented average recognition and prediction abilities of 99.22%. Adulterated honeys (A10, A20 and A50) were classified correctly, while misclassification was found for authentic honeys belonging to A10 in 3.11%.
Independent prediction of the four EUnonEU blend acacia honey samples (Figure 2b and Table 5) showed that honey HA_84 was correctly classified as authentic acacia honey. In the case of the HA_78 and HA_100 honeys, misclassification was found; they were classified to the A10 group in 3.85% and 11.76%, respectively. Honey HA_99 was classified as an adulterated honey belonging to group A10 and the A50 groups in 33.33% and 66.67%, respectively.
Figure 1.Results of the sensory profile analysis of (a) acacia and (b) linden honey,n=12/parameter.
3.3. Results of Electronic Tongue Analysis
The LDA model built for the classification of authentic acacia and linden honeys based on the results of an electronic tongue can be seen in Figure2. For both honey types, separation tendencies can be observed through root 1, according to the level of adulteration. Nevertheless, on root 2, separation of adulterants can be seen. The model of acacia honeys (Figure2a) all presented average recognition and prediction abilities of 99.22%. Adulterated honeys (A10, A20 and A50) were classified correctly, while misclassification was found for authentic honeys belonging to A10 in 3.11%. Independent prediction of the four EUnonEU blend acacia honey samples (Figure2b and Table5) showed that honey HA_84 was correctly classified as authentic acacia honey. In the case of the HA_78 and HA_100 honeys, misclassification was found; they were classified to the A10 group in 3.85% and 11.76%, respectively.
Honey HA_99 was classified as an adulterated honey belonging to group A10 and the A50 groups in 33.33% and 66.67%, respectively.
Table 5.Classification results of independent prediction of EUnonEU acacia and linden honeys.
Electronic Tongue Electronic Nose
Authentic 10%
Syrup
20%
Syrup
50%
Syrup Authentic 10%
Syrup
20%
Syrup
50%
Syrup
HA_100 88.24% 11.76% 0.00% 0.00% 40.74% 59.26% 0.00% 0.00%
HA_78 96.15% 3.85% 0.00% 0.00% 5.26% 0.00% 94.74% 0.00%
HA_84 100.00% 0.00% 0.00% 0.00% 29.63% 70.37% 0.00% 0.00%
HA_99 0.00% 33.33% 0.00% 66.67% 0.00% 16.67% 83.33% 0.00%
HL_79 100.00% 0.00% 0.00% 0.00% 0.00% 0.00% 0.00% 100.00%
HL_83 100.00% 0.00% 0.00% 0.00% 29.63% 29.63% 22.22% 18.52%
HL_98 0.00% 0.00% 0.00% 100.00% 52.38% 38.10% 9.52% 0.00%
HA means acacia, HL means linden, and numbers are the registered numbers of the honeys.
Sensors2020,20, 4845 11 of 19
3.3. Results of Electronic Tongue Analysis
The LDA model built for the classification of authentic acacia and linden honeys based on the results of an electronic tongue can be seen in Figure 2. For both honey types, separation tendencies can be observed through root 1, according to the level of adulteration. Nevertheless, on root 2, separation of adulterants can be seen. The model of acacia honeys (Figure 2a) all presented average recognition and prediction abilities of 99.22%. Adulterated honeys (A10, A20 and A50) were classified correctly, while misclassification was found for authentic honeys belonging to A10 in 3.11%.
Independent prediction of the four EUnonEU blend acacia honey samples (Figure 2b and Table 5) showed that honey HA_84 was correctly classified as authentic acacia honey. In the case of the HA_78 and HA_100 honeys, misclassification was found; they were classified to the A10 group in 3.85% and 11.76%, respectively. Honey HA_99 was classified as an adulterated honey belonging to group A10 and the A50 groups in 33.33% and 66.67%, respectively.
Figure 2. Results of electronic tongue linear discriminant analysis (LDA) models for the classification of authentic and adulterated acacia (a) (n = 381) and linden (c) (n = 148) honeys and independent prediction of EUnonEU blends for acacia (b) (n = 381 + 66) and linden (d) (n = 148 + 59) honeys;
training, validation and independent prediction.
a )
b )
c )
d )
Figure 2.Results of electronic tongue linear discriminant analysis (LDA) models for the classification of authentic and adulterated acacia (a) (n=381) and linden (c) (n=148) honeys and independent prediction of EUnonEU blends for acacia (b) (n=381+66) and linden (d) (n=148+59) honeys;
Sensors 2020, 20, x 5 of 22
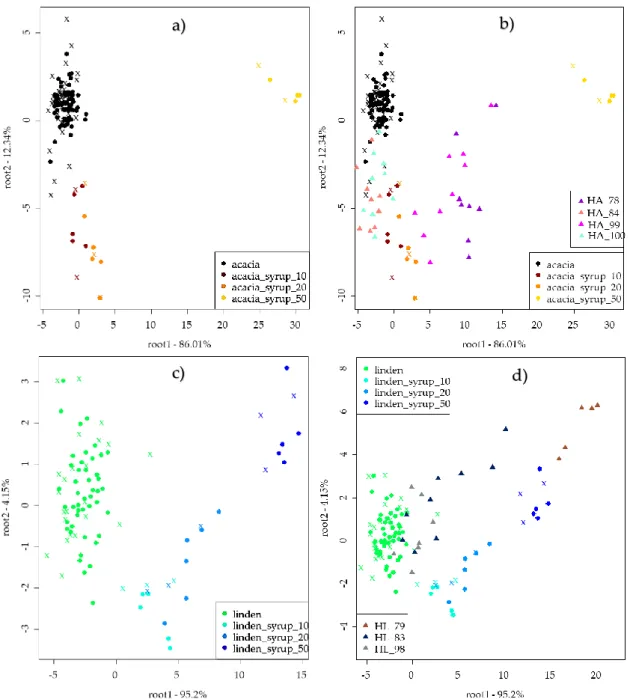
Figure 3. Results of the electronic nose LDA model for classification of authentic and adulterated acacia (a) (n= 127) and linden (c) (n= 94) honeys and models for independent prediction with EUnonEU blends for acacia (b) (n=127+35) and linden (d) (n= 94+21) honeys; training, validation and independent prediction.
a)
c) d)
b)
training,
Sensors 2020, 20, x 5 of 22
Figure 3. Results of the electronic nose LDA model for classification of authentic and adulterated acacia (a) (n= 127) and linden (c) (n= 94) honeys and models for independent prediction with EUnonEU blends for acacia (b) (n=127+35) and linden (d) (n= 94+21) honeys; training, validation and independent prediction.
a)
c) d)
b)
validation and
Sensors 2020, 20, x 5 of 22
Figure 3. Results of the electronic nose LDA model for classification of authentic and adulterated acacia (a) (n= 127) and linden (c) (n= 94) honeys and models for independent prediction with EUnonEU blends for acacia (b) (n=127+35) and linden (d) (n= 94+21) honeys; training, validation and independent prediction.
a)
c) d)
b)
independent prediction.
The LDA model of linden honeys (Figure2c) presented average recognition and prediction abilities of 98.23% and 92.92%, respectively. Authentic linden, L10 and L50 honeys were classified correctly. L20 presented 92.92% and 71.67% correct classifications during training and validation.
Misclassification was found in training; these resulted as belonging to L50 (7.08%). During validation, 14.14% was misclassified to L10 and L50. Independent predictions of the three EUnonEU blends (Figure2d and Table5) showed that two of the honeys were misclassified as authentic Hungarian linden (HL_79 and HL_83), while HL_98 was classified as adulterated honey with 50% syrup content (L50).
3.4. Results of Electronic Nose Analysis
The LDA results of the electronic nose for classification of authentic and adulterated acacia and linden honeys with independent prediction can be seen in Figure3. The LDA model of acacia presented a separation of A50 from other groups, while root 2 showed the tendency of separation
between points of authentic as well as A10 and A20 honeys. The LDA model of acacia honey presented average recognition and prediction abilities of 95.31% and 88.77%, respectively. The training set provided correct classification of authentic acacia, A10 and A50 honeys; in the case of A20 honeys, misclassification was found belonging to A10 in 18.76%. The validation set revealed weaker results:
A50 was classified correctly, misclassification was found for authentic acacia honeys belonging to A10 and A20 in 2.83%, A10 honey showed 85.84% of correct classification (misclassified as authentic honeys in 14.16%) and A20 honey showed misclassification to A10 in 25.09%. Independent prediction of the ten EUnonEU honeys showed that two of the honeys were classified as authentic, and others showed misclassification as A10, A20 and A50 honeys too. The results of detailed independent predictions can
be seen in TableSensors 2020, 20, x 5. 5 of 22
Figure 3. Results of the electronic nose LDA model for classification of authentic and adulterated acacia (a) (n= 127) and linden (c) (n= 94) honeys and models for independent prediction with EUnonEU blends for acacia (b) (n=127+35) and linden (d) (n= 94+21) honeys; training, validation and independent prediction.
a)
c) d)
b)
Figure 3.Results of the electronic nose LDA model for classification of authentic and adulterated acacia (a) (n=127) and linden (c) (n=94) honeys and models for independent prediction with EUnonEU blends for acacia (b) (n=127+35) and linden (d) (n=94+21) honeys;
Sensors 2020, 20, x 5 of 22
Figure 3. Results of the electronic nose LDA model for classification of authentic and adulterated acacia (a) (n= 127) and linden (c) (n= 94) honeys and models for independent prediction with EUnonEU blends for acacia (b) (n=127+35) and linden (d) (n= 94+21) honeys; training, validation and independent prediction.
a)
c) d)
b)
training,
Sensors 2020, 20, x 5 of 22
Figure 3. Results of the electronic nose LDA model for classification of authentic and adulterated acacia (a) (n= 127) and linden (c) (n= 94) honeys and models for independent prediction with EUnonEU blends for acacia (b) (n=127+35) and linden (d) (n= 94+21) honeys; training, validation and independent prediction.
a)
c) d)
b)
validation and
Sensors 2020, 20, x 5 of 22
Figure 3. Results of the electronic nose LDA model for classification of authentic and adulterated acacia (a) (n= 127) and linden (c) (n= 94) honeys and models for independent prediction with EUnonEU blends for acacia (b) (n=127+35) and linden (d) (n= 94+21) honeys; training, validation and independent prediction.
a)
c) d)
b)
independent prediction.
LDA results of linden honeys for classification of authentic and adulterated honeys based on the results of an electronic nose show a separation through root 1 (Figure3c). The model provided average recognition and prediction abilities of 94.45% and 80.83%, respectively. Authentic linden, L10 and L50 were classified correctly in training, and misclassification was detected for L20, misclassified as L10 in 22.17%. Validation provided correct classification for L50, and 92.74% of authentic honeys were classified correctly (misclassification to L10 (4.35% and L20 2.91%). L10 was classified correctly in 74.91% (misclassified as L20), and 55.67% of L20 was classified correctly. Independent prediction of EUnonEU linden honeys presented misclassifications to adulterated groups (Figure3d). One of the honeys was completely classified as counterfeit. Detailed classification can be found in Table5.
Independent prediction of EUnonEU acacia honeys (Table5) showed misclassification for HA_100 and HA_84 honeys to A10 honeys in 59.26% and 70.37%, respectively. HA_78 and HA_99 honeys were classified as 20% adulterated in 94.74% and 83.33%, respectively. Linden honey showed similar results, where HL_79 was classified as 50% adulterated.
3.5. Results of Partial Least Square Regression to Predict the Properties of Sensory Profile Analysis Using ET and EN
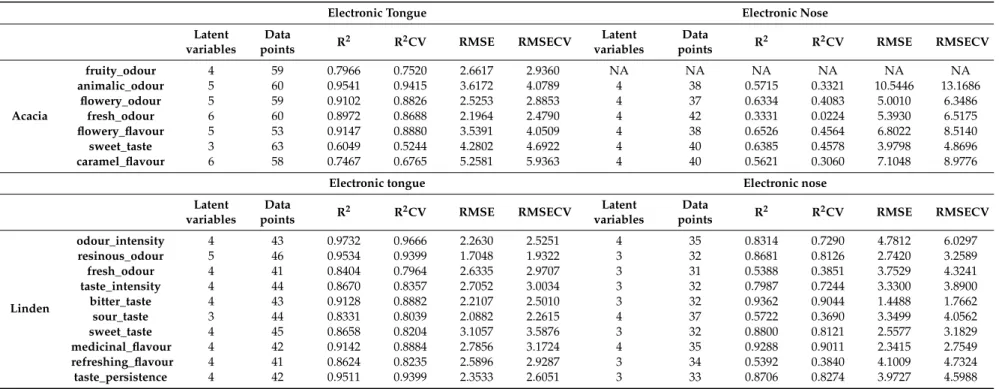
The results of the regression on the sensory properties using data of the electronic tongue and nose provided better results in the case of linden honey for both instruments; however, the results of the individual parameters were different depending on the device used (Table6). In the case of the electronic tongue for the prediction of sensory properties of the acacia honey, the best prediction was obtained for animalic odour and flowery flavour with R2CV of 0.9415 and 0.888, respectively. Similarly, EN provided the best prediction for flowery flavour and sweet taste with values of R2CV of 0.4083 and 0.4578, respectively. Prediction of fruity odour using the results of the electronic nose was not achieved after cross-validation. In conclusion, the results showed that PLSR models of the electronic nose were weaker for all parameters compared to the results of the electronic tongue.
The same situation was noticed in the case of the results of linden honeys. However, prediction of the sensory parameters in this case provided better results compared to the results of the acacia models.
PLSR models built using data of the electronic nose provided the best results for the prediction of the taste persistence, odour intensity and resinous odour with higher R2CV of 0.9. The electronic nose reached the highest performance in the prediction of medicinal flavour and bitter taste.
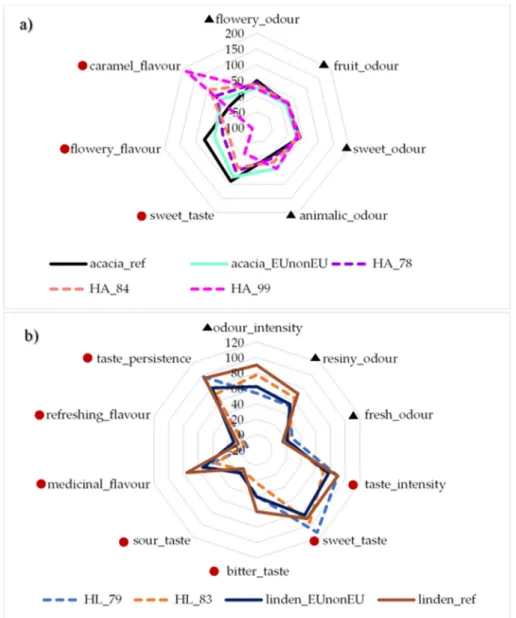
Independent prediction of the sensory parameters of the acacia (HA_78, HA_84 and HA_99) and linden honey (HL_79 and HL_83) can be seen in Figure4, where taste parameters were independently predicted using PLSR models of ET and odour proportion PLRS models of EN (Table6). The results of acacia honey showed that HA_99 honey was very different from the reference honey. However, HA_84 and HA_78 were similar to each other and to the reference honey sample. The results of linden honey showed that the HL_83 and HL_79 honeys were sweeter and weaker in other aroma properties than the reference linden honey, similarly to the EUnonEU blend of linden honey (HL_98).
Table 6.Results of the regression models built on the properties of sensory profile analyses of acacia and linden honey used in sensory profile analyses based on data of the electronic tongue and nose.
Electronic Tongue Electronic Nose
Latent variables
Data
points R2 R2CV RMSE RMSECV Latent
variables
Data
points R2 R2CV RMSE RMSECV
Acacia
fruity_odour 4 59 0.7966 0.7520 2.6617 2.9360 NA NA NA NA NA NA
animalic_odour 5 60 0.9541 0.9415 3.6172 4.0789 4 38 0.5715 0.3321 10.5446 13.1686
flowery_odour 5 59 0.9102 0.8826 2.5253 2.8853 4 37 0.6334 0.4083 5.0010 6.3486
fresh_odour 6 60 0.8972 0.8688 2.1964 2.4790 4 42 0.3331 0.0224 5.3930 6.5175
flowery_flavour 5 53 0.9147 0.8880 3.5391 4.0509 4 38 0.6526 0.4564 6.8022 8.5140
sweet_taste 3 63 0.6049 0.5244 4.2802 4.6922 4 40 0.6385 0.4578 3.9798 4.8696
caramel_flavour 6 58 0.7467 0.6765 5.2581 5.9363 4 40 0.5621 0.3060 7.1048 8.9776
Electronic tongue Electronic nose
Latent variables
Data
points R2 R2CV RMSE RMSECV Latent
variables
Data
points R2 R2CV RMSE RMSECV
Linden
odour_intensity 4 43 0.9732 0.9666 2.2630 2.5251 4 35 0.8314 0.7290 4.7812 6.0297
resinous_odour 5 46 0.9534 0.9399 1.7048 1.9322 3 32 0.8681 0.8126 2.7420 3.2589
fresh_odour 4 41 0.8404 0.7964 2.6335 2.9707 3 31 0.5388 0.3851 3.7529 4.3241
taste_intensity 4 44 0.8670 0.8357 2.7052 3.0034 3 32 0.7987 0.7244 3.3300 3.8900
bitter_taste 4 43 0.9128 0.8882 2.2107 2.5010 3 32 0.9362 0.9044 1.4488 1.7662
sour_taste 3 44 0.8331 0.8039 2.0882 2.2615 4 37 0.5722 0.3690 3.3499 4.0562
sweet_taste 4 45 0.8658 0.8204 3.1057 3.5876 3 32 0.8800 0.8121 2.5577 3.1829
medicinal_flavour 4 42 0.9142 0.8884 2.7856 3.1724 4 35 0.9288 0.9011 2.3415 2.7549
refreshing_flavour 4 41 0.8624 0.8235 2.5896 2.9287 3 34 0.5392 0.3840 4.1009 4.7324
taste_persistence 4 42 0.9511 0.9399 2.3533 2.6051 3 33 0.8706 0.8274 3.9727 4.5988
Parameters showing significant differences among the honeys in sensory profile analyses were chosen to build PLRS models.
Sensors2020,20, 4845 15 of 19
was not achieved after cross-validation. In conclusion, the results showed that PLSR models of the electronic nose were weaker for all parameters compared to the results of the electronic tongue.
The same situation was noticed in the case of the results of linden honeys. However, prediction of the sensory parameters in this case provided better results compared to the results of the acacia models. PLSR models built using data of the electronic nose provided the best results for the prediction of the taste persistence, odour intensity and resinous odour with higher R2CV of 0.9. The electronic nose reached the highest performance in the prediction of medicinal flavour and bitter taste.
Independent prediction of the sensory parameters of the acacia (HA_78, HA_84 and HA_99) and linden honey (HL_79 and HL_83) can be seen in Figure 4, where taste parameters were independently predicted using PLSR models of ET and odour proportion PLRS models of EN (Table 6). The results of acacia honey showed that HA_99 honey was very different from the reference honey. However, HA_84 and HA_78 were similar to each other and to the reference honey sample. The results of linden honey showed that the HL_83 and HL_79 honeys were sweeter and weaker in other aroma properties than the reference linden honey, similarly to the EUnonEU blend of linden honey (HL_98).
Figure 4. Results of the independent prediction of sensory parameters using the results of the electronic tongue and nose for (a) acacia and (b) linden honeys; predicted from the results of ET and ▲ predicted from the results of EN.
Figure 4.Results of the independent prediction of sensory parameters using the results of the electronic tongue and nose for (a) acacia and (b) linden honeys;
Sensors 2020, 20, x 8 of 22
Figure 4. Results of the independent prediction of sensory parameters using the results of the electronic tongue and nose for (a) acacia and (b) linden honeys; predicted from the results of ET and predicted from the results of EN.
predicted from the results of ET and
Sensors 2020, 20, x 5 of 22
Figure 3. Results of the electronic nose LDA model for classification of authentic and adulterated acacia (a) (n= 127) and linden (c) (n= 94) honeys and models for independent prediction with EUnonEU blends for acacia (b) (n=127+35) and linden (d) (n= 94+21) honeys; training, validation and independent prediction.
a)
c) d)
b)
predicted from the results of EN.
4. Discussion
The significantly lower total soluble dry matter content of the sugar syrup shows that lower contents (75.4%) affected the moisture content of the honeys (Table3). These results are in accordance with other studies, where increased sugar syrup addition resulted in higher moisture (lower dry matter) content [16,17,37]. Significantly lower pH values of adulterated honeys can be explained by the more acidic sugar syrup (pH 3.54±0.02). Similar results were obtained by Turkish [16] and Romanian researchers [38].
A decreasing tendency was found with the increase of added syrup concentration in total polyphenol content and antioxidant capacity measuring assays such as FRAP and CUPRAC (Table3) that can be explained with the low antioxidant capacity of the sugar syrup. Turkish researchers also found a lower antioxidant capacity in uncertified honeys [39]; however, the lower values could be due to different geographical origins too.
Sensory profile analysis of the adulterated and unadulterated acacia and linden honeys revealed significant differences between authentic and adulterated honey. In the case of acacia honey, only fruity odour, caramel, flowery flavour and sweet taste showed significant differences between the authentic