Examination of the effect of type and quantity of sugar on main sensory parameters of homemade
oat- fl akes biscuit
T IMEA KASZAB
1p, BLANKA HALASI
2and ZOLTAN KOVACS
11Department of Measurements and Process Control, Faculty of Food Science, Szent Istvan University, 14-16 Somloi str., 1118 Budapest, Hungary
2Department of Food Preservation, Faculty of Food Science, Szent Istvan University, 29-43 Villanyi str., 1118 Budapest, Hungary
CONFERENCE FULL PAPER
Received: January 31, 2020 • Accepted: September 10, 2020 Published online: November 2, 2020
© 2020 The Author(s)
ABSTRACT
The fiber intake is an important part of the human diet. The fiber-deficient nutrition may have long-term health problems. Oat (Avena sativa) is an excellent source offiber and it has many health benefits due to its rich vitamin and mineral composition. Oats are used asflour andflakes in the food industry. The oat-flakes can be used in a variety of cakes, but it can be also consumed as breakfast cereals or porridge.
The objective of our work was to determine the effect of the sugar content and sugar types on main sensory parameters of oat-flakes biscuit. During the experiments, six different types of biscuit were made with the addition of white or brown sugar at three different concentration levels. The moisture content, color, and the frangibility of the samples were analyzed during the 4-day storage period. The sensory evaluation of the biscuit samples was also performed on the first day of storage.
The parameters of the rupture test and color measurement did not show significant changes during the storage, but the individual types of biscuits made of different types and quantities of sugar could be well distinguished. Results of sensory evaluation showed significant differences in frangibility, structure and stickiness parameters.
KEYWORDS
oat-flakes, biscuit, sugar, sensory evaluation
pCorresponding author. E-mail: kaszab.timea@szie.hu
INTRODUCTION
The common oat (Avena sativa) is a species of cereal grain mainly grown for its utilization for human consumption as oatmeal as well as for livestock feed. Oat has always been regarded as a health promoting food without clear knowledge of its specific health related effects. However, today it is known for its effects on satiety and retarded absorption of nutrients as well as a deterrent of various disorders of the gastrointestinal tract. These beneficial effects are chiefly due to the solublefiber content of oats (Daou & Zhang, 2012). Today oats are among the richest and most economical sources of soluble dietary fiber. The present interest in soluble oat fiber originated from reports that showed that dietary oats can help in lowering cholesterol post- prandial blood glucose level as well as modifying immune response and reducing risk of colon cancer (Wood, 1986; Skendi et al., 2003; Lazaridou & Biliaderis, 2007).
In the food industry there are several ways to use the meal of oats. Consuming oats as flakes is perhaps the most popular today. The oatmeal is obtained by extrusion from the whole eye, so it contains all its components. Used for decoration of bakery products, whole or minced, but also suitable for enrichment or densification of dough as oatmeal flour (Szabo, 1982).
More healthy food product was developed with highß-glucan and oat content in theEKI- NAIK (Elelmiszer-tudomanyi Kutatointezet, Nemzeti Agrarkutatasi es Innovacios K€ozpont (Food Science Research Institute)). The aim of the research was to detect the change of theß- glycan as dietary fiber during the research. Finally, muffin was produced with oat feed. The oat feed content of the muffin was 50% (MTA, 2007).
In order to elucidate the effect of sugar composition on the water sorption and softening properties of cookie, three types of sugar composition (sugar, sugar-trehalose, and sugar-sor- bitol) were employed as an ingredient of cookie, and softening temperature of the cookie samples, adjusted to various water contents, was investigated using thermal rheological analysis.
The softening temperature decreased linearly with increasing water content of the cookie samples. The results suggest that sugar composition plays an important role in the softening properties of cookie samples (Kawai et al., 2014).
Experiment was made to find an optimal recipe for biscuits with the addition of pollen, and at the same time investigate the physical, chemical and health-promoting properties in obtained products (Krystyjan et al., 2015).
The sensory characteristics are one of the most important criteria for shopping, as they have a great impact on consumers. The main purpose of consumer sensory testing is to determine how well the product meets the consumer’s expectations. So it can be used to develop a product that is best seen by consumers (Lawless & Heimann, 2010). The objective of our work was to determine the effect of the sugar content and sugar types on rheological and sensory parameters of oat-flakes biscuit.
MATERIALS AND METHODS
Biscuit samples
During the experiments six different types of biscuit were made with the addition of white or brown sugar at three different concentration levels (0.10, 0.15, and 0.20 kg). Each group con- sisted of 15 samples. Two parallel 4-day short-time storage experiments were performed on two consecutive weeks. The storage parameters were as the follows (Table 1):
Methods
The moisture content of the samples was determined with classical drying method in VEN- TICELL (MMM Medcenter, M€unchen, Germany) drying chamber. The samples were dried at 1058C, 24 h until constant weight (Kaszab et al., 2008).
The color of the biscuits on the given day was also measured by ColorLite sph850 (ColorLite GmbH, Katlenburg-Lindau, Germany) spectrophotometer. Test results were obtained as CIE (Commission Internationale de laEclargie) L*, a*, b*color properties. The instrument settings were“28standard observer”and“standard illuminant D65”. Results of each measurement were calculated from the average of three measurements by the ColorLite equipment. The aim was to control the similarity of the groups.
The frangibility of the biscuits was measured by TA.XT.Plus (Stable Micro System, Surrey, UK) precision penetrometer, with P0.5S type, 0.5 col diameter stainless steel ball. Test settings were as follows: pretest speed at 1 mm/s, test speed at 0.1 mm/s and distance at 6 mm. A 5 kg load cell was used and the maximum rupture force (FMAX) and the distance of maximum rupture force (DMAX) were measured. Furthermore, the gradient of the curve up to maximum force (FMAX/DMAX) and the area below the rupture curve, such as work (A) were determined.
During the sensory evaluation, the aim was to rank the groups based on the sensory parameters.
These parameters were as the follows: shape, thickness, color, texture, global odour intensity, fran- gibility, stickiness, sweet taste intensity, general aspect. The samples were evaluated by 21 consumers, with 12 women and 9 men between the ages of 21 and 45 years. All the patterns on the unstructured scale had to be placed between the positive and the negative end of the given property based on nine properties. The full length of the scale was 100%, the distance between the beginning of the scale and the sample mark was measured. Finally, the samples in a 0–100 point system were scored.
The measured rheological properties values were evaluated by R-Studio Version 1.1.414 (R-Studio, 2018). After data reduction, a normality test (Shapiro–Wilk Test) was run on results of the samples. The equality of variances was checked by ANOVA. Furthermore, TukeyHSD test (P< 0.05) was used for detecting the significant differences between the groups (Reiczigel et al., 2014). Sensory attributes were predicted based on the results obtained with mechanical tests parameters by the means of partial least square (PLS) regression (Kvalheim, 2009). The PLS models are quantified by root mean standard error of calibration (RMSEC), root mean standard error of prediction (RMSEP) and coefficient of determination (R2) between the predicted and measured parameters. Leaving one-out (LOO) cross-validation procedure was used in this work.
RESULTS AND DISCUSSION
The moisture content was calculated by drying combined with mass measurement. The mois- ture content increased in the white sugar biscuits and decreased in the brown sugar samples during the short-time storage period.
Table 1.Storage parameters of oat-flakes biscuits
Experiments Temperature Relative humidity
1. 27±0.38C 22.2±2.5%
2. 27.1±0.98C 27.9±2.5%
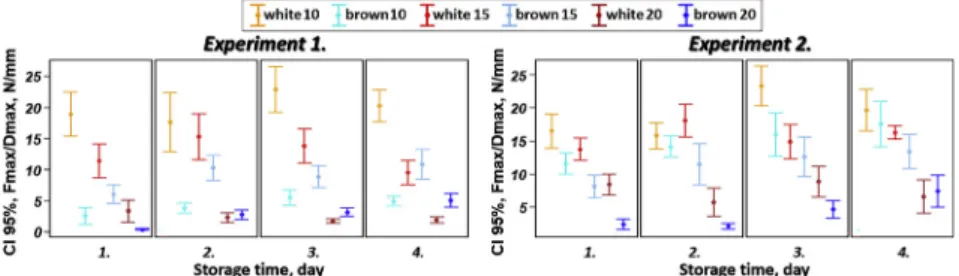
Before the rupture test the CIE L*a*b*color parameters were determined on each measuring day. Significant change was not found in the color parameters during the storage at both ex- periments. The frangibility of the biscuit samples were detected during the rupture test. From the determined rheological parameters the gradient (FMAX/DMAX) was the strongest in the function of the storage time (Fig. 1). The error bar diagram reveals at 95% confidence interval the average and the standard deviation of the groups at both experiments. The standard devi- ation of group with lower sugar quantity was higher.
Decreasing was not found in the value of the gradient, however, a decrease was observed with the increasing of the sugar content at both series. The ANOVA and the TukeyHSD test showed significant differences among the three different sugar concentrations in the case of both white sugar and brown sugar (Table 2A). TheFMAX,DMAX, and area (A) showed similar results to the gradient, however, the least significant difference was found to be significant in theDMAXvalues according to the TukeyHSD test (Table 2B). Table 3shows the TukeyHSD test results of the maximum rupture force (FMAX) and the area (A).
Table 2.TukeyHSD test results of gradient (FMAX/DMAX) and distance (DMAX) (P50.05) Fig. 1.The gradient (FMAX/DMAX) (average and the 95% confidence interval) in the function of the storage
time, (experiments from left to right: 1. and 2.)
During the sensory analysis all judges tested all 6 products (Fig. 2).Fig. 3shows the average of the points of each sensory property. The lower point means the more positive properties.
Based on the results, it can be concluded that the consumers were able to distinguish each group
Fig. 2.Samples from the 6 different recipes
Fig. 3.The results of the sensory evaluation based on 9 sensory properties Table 3.TukeyHSD test results of maximum rupture force (FMAX) and area (A) (P50.05)
morefirmly on the basis of the properties“thickness”,“structure”, and“stickiness”. In contrast, however, the samples were placed in a narrower range in terms of “color” and “sweet taste intensity”properties. This means that they could not clearly distinguish the samples based on these properties.
The texture properties showed the strongest significant difference between the groups based on the judging by points. The groups were separated successfully based on the stickiness and texture properties according to the increasing sugar concentration. The groups did not separate well based on the frangibility; however, the original aim of this work was to analyze the fran- gibility of the biscuits during storage (Table 4). The reason for this was the soft, sticky stock of higher sugar concentration samples.
The frangibility, texture, and stickiness properties were applied to estimate based on the FMAX,DMAX,FMAX/DMAX, andArheological parameters by Texture Analyzer. Results of thefirst day samples of both experiments were applied to the PLS regression (Table 5).
Table 4.TukeyHSD test results of frangibility, texture, and stickiness (P50.05)
Table 5.PLS calibration and cross-validation (leave one out (LOO)) to the sensory properties of oat-flakes biscuits based on the results of the maximum rupture force, distance of maximum rupture force, gradient
(ratio of maximum rupture force and distance) and area
Experiment Sensory property LV (number)
Calibration Cross-validation
R2 RMSECa R2 RMSEPb
1. Frangibilityc 4 0.6544 7.534 0.5116 8.851
Texturec 4 0.6798 17.94 0.5802 20.53
Stickinessc 4 0.6743 14.02 0.5851 15.81
2. Frangibilityc 4 0.8335 5.555 0.7790 6.395
Texturec 4 0.5965 19.56 0.4665 22.45
Stickinessc 4 0.6229 15.05 0.5645 16.17
1. Frangibilityd 4 0.7061 3.285 0.6234 3.713
Textured 4 0.7030 19.34 0.6196 21.86
Stickinessd 4 0.7058 12.94 0.6231 14.62
2. Frangibilityd 4 0.6066 3.700 0.4461 4.384
(continued)
The results showed the best estimations to the rheological sensory properties of biscuits with brown sugar based on the FMAX, DMAX, FMAX/DMAX, and A rheological parameters at two parallel experiments. The coefficient of determination of cross-validation (0.6650≤R2≥0.7648) means that there is an acceptable relationship between the predicted and measured variables.
Fig. 4 shows the results of the brown sugar groups of the estimation of the frangibility, texture, and stickiness sensory properties of experiment 2. The estimations contain the pa- rameters of calibration and leave one out (LOO) cross-validation inFig. 4.
R2= 0.8508 RMSEC = 5.423
R2= 0.7398
RMSEP = 7.137 R2= 0.7439
RMSEP = 12.97 R2= 0.8301
RMSEC = 10.59
R2= 0.7568 RMSEP = 11.89 R2= 0.8464
RMSEC = 9.746
Fig. 4.Results of the brown sugar groups of the estimation of the frangibility, texture, and stickiness sensory properties of experiment 2 based on maximum rupture force, distance of maximum rupture force, gradient,
and area Table 5.Continued
Experiment Sensory property LV (number)
Calibration Cross-validation
R2 RMSECa R2 RMSEPb
Textured 4 0.6479 20.57 0.4708 25.15
Stickinessd 4 0.6531 13.69 0.4788 16.73
1. Frangibilitye 4 0.8454 5.390 0.7648 6.636
Texturee 4 0.7824 12.03 0.6650 14.92
Stickinesse 4 0.6531 11.02 0.6846 13.53
2. Frangibilitye 4 0.8454 5.423 0.7398 7.137
Texturee 4 0.7824 10.59 0.7439 12.97
Stickinesse 4 0.7907 9.746 0.7568 11.89
aRoot mean square error of calibration.
bRoot mean square error of prediction.
cEstimation based on maximum rupture force, distance of maximum rupture force, gradient, area at white, and brown sugar groups.
dEstimation based on maximum rupture force, distance of maximum rupture force, gradient, area at white sugar groups.
eEstimation based on maximum rupture force, distance of maximum rupture force, gradient, area at brown sugar groups. LV: latent variable.
The results of PLS regression may be influenced by the consumer habits and/or nontrained panelists as well. Data of a well-trained panel might have given higher R2 and lower RMSEC/
RMSEP values.
CONCLUSION
The objective of our work was to determine the effect of the sugar content and sugar types on rheological and sensory parameters of oat-flakes biscuit. The determined parameters of rheo- logical measurement did not reveal large-scale change during the short-time storage, however, significant differences were found in the rheological parameters in the case of the white and brown sugar. The best descriptive parameter was the gradient of the curve until the maximum rupture force (FMAX). The FMAX, DMAX, FMAX/DMAX, and A parameters are capable of dis- tinguishing the structure of biscuits depending on the different quantities of sugar and sugar types. Based on the results of the sensory evaluation it can be stated that among the 9 sensory aspects the rheological properties show a significant difference in the different recipes. These sensory properties were estimated based on theFMAX,DMAX,FMAX/DMAX, andA.The texture, frangibility, and the stickiness sensory properties of biscuits with brown sugar content are estimated successfully based on the rheological parameters at two parallel experiments.
REFERENCES
Daou, C. and Zhang, H. (2012). Oat beta-glucan: its role in health promotion and prevention of diseases.
Comprehensive Reviews in Food Science and Food Safety, 11: 355–365.
Kaszab, T., Firtha, F., and Fekete, A. (2008). Influence of non-ideal storage conditions on carrot moisture content loss.Progress in Agricultural Engineering Sciences, 4(1): 61–75.
Kawai, K., Toh, M., and Hagura, Y. (2014). Effect of sugar composition on the water sorption and softening properties of cookie.Food Chemistry, 145: 772–776.
Krystyjan, M., Gumul, D., Ziobro, R., and Korus, A. (2015). The fortification of biscuits with bee pollen and its effect on physicochemical and antioxidant properties in biscuits. LWT–Food Science and Tech- nology, 63(1): 640–646.
Kvalheim, O.M. (2010). Interpretation of partial least squares regression models by means of target pro- jection and selectivity ratio plots.Journal of Chemometrics, 24: 496–504.
Lawless, H.T. and Heimann, H. (2010).Sensory evaluation of food, 2nd ed. Springer.https://doi.org/10.
1007/978-1-4419-6488-5.
Lazaridou, A. and Biliaderis, C.G. (2007). Molecular aspects of cereal b-glucan functionality: physical properties, technological applications and physiological effects.Journal of Cereal Science, 46: 101–118.
MTA Mez}ogazdasagi Kutatointezetenek K€ozlemenyei 2007/2 XIX.Evf. 2. sz am, 16-17. o., Martonvasar.
Reiczigel J., Harnos A., and Solymosi N. (2014).Biostatisztika nem statisztikusoknak, javıtott utannyomas, Pars Kft., Budapest.
Skendi, A., Biliaderis, C.G., Lazaridou, A., and Izydorczyk, M.S. (2003). Structure and rheological properties of water solubleb-glucans from oat cultivars of Avena sativa and Avena by santina.Journal of Cereal Science, 38: 15–31.
Szabo L. (1982).A zab, Magyarorszag kulturfloraja IX. k€otet, Pazsitf}ufelek II. f€uzet, Akademiai Kiado, Budapest.
Wood, P.J. (1986). Oat beta-glucan: structure, location and properties. In: Webster (Ed.),Oats: chemistry and technology. American Association of Cereal Chemistry, St. Paul, USA.pp. 121–152.
Open Access. This is an open-access article distributed under the terms of the Creative Commons Attribution 4.0 International License (https://creativecommons.org/licenses/by/4.0/), which permits unrestricted use, distribution, and reproduction in any medium, provided the original author and source are credited, a link to the CC License is provided, and changes–if any–are indicated. (SID_1)