Contents lists available atScienceDirect
Radiation Measurements
journal homepage:www.elsevier.com/locate/radmeas
On the relationship between K concentration, grain size and dose in feldspar
J.-P. Buylaert
a,b,∗, G. Újvári
a,c, A.S. Murray
b, R.K. Smedley
d,e, M. Kook
aaCenter for Nuclear Technologies, Technical University of Denmark, DTU Risø Campus, Denmark
bNordic Laboratory for Luminescence Dating, Department of Geoscience, Aarhus University, Risø Campus, DK-4000, Roskilde, Denmark
cInstitute for Geological and Geochemical Research, Research Centre for Astronomy and Earth Sciences, Hungarian Academy of Sciences, H-1112, Budapest, Hungary
dDepartment of Geography and Planning, University of Liverpool, Liverpool, UK
eSchool of Geography, Geology and the Environment, Keele University, Keele, Staffordshire, UK
A R T I C L E I N F O
Keywords:
Feldspar Potassium Rubidium Dose Isochron
A B S T R A C T
Previous work has been unable to establish a relationship between K concentration and Dein single-grains of feldspar. Here we use four well-bleached sediments with low external dose rate (typically≤1.5 Gy ka−1) to investigate this relationship. Single and multi-grain pIRIR measurements andμ-XRF analyses are made on Na- and K-rich extracts;μ-XRF is directly applied to grains sitting in single-grain discs to minimise uncertainty in grain identification. Micro-XRF is shown to be sufficiently precise and accurate and luminescence instrument reproducibility is confirmed using dose recovery measurements on heated feldspar. We are again unable to establish any correlation between single-grain Deand K concentration, even in feldspar grains for which the internal dose rate should dominate. We also measure highly variable Rb concentrations in these grains and are unable to detect, at the single-grain level, the correlation between K and Rb previously observed in multi-grain investigations. Nevertheless, these results are unable to explain the lack of Decorrelation with K. Finally, we investigate the dependence of Deon grain size (isochrons). Linear correlations are observed but slopes are inconsistent with model prediction. We conclude that this surprising absence of the expected relationships be- tween dose and K concentration and grain size does not arise from analytical precision, incomplete bleaching, sediment mixing or fading. It appears that we cannot measure feldspar doses in these samples as accurately as we thought.
1. Introduction
The over-dispersion in single-grain dose distributions determined in feldspar from a well-bleached setting must, at least in part, arise from the grain-to-grain variation in internal dose rate (dominated by stoi- chiometrically predicted variations in K concentration ranging from 0 to 14%). However, it has so far proved impossible to demonstrate this relationship experimentally (e.g.Trauerstein et al., 2014;Smedley and Pearce, 2016). Such correlations will not be particularly pronounced in medium to high dose rate environments where the internal dose rate is only a moderate contribution to the total, and this could partly explain why it has not been observed so far. However,Willerslev et al. (2007) investigated grains dispersed in old Greenland ice, i.e. grains with negligible external dose rate, and were nevertheless unable to demon- strate a correlation for their IR sensitive grains. In a related study, Thiel et al. were also unable to demonstrate a correlation between Deand K concentration for > 220 grains extracted from the bottom of the Greenland ice sheet (Christine Thiel, personal communication 2017).
In contrast to these negativefindings,Li et al. (2008)have been able
to demonstrate at the multi-grain level a clear relationship between De
and K-feldspar grain size (and thus internal dose rate) in their isochron work. Given these apparently contradictory results, here wefirst in- vestigate the relationship between Deand K concentration at the single grain level in a number of samples of known low external dose rate (typically≤1.5 Gy ka−1) expected to contain well-bleached feldspar.
We report on the precision and accuracy of our K measurements using μ-XRF and the dependence of the single-grain Deon K concentration.
We then re-examine the relationship of multi-grain Deand grain-size (and so internal dose rate). Finally, the relationship between Rb content and K concentration at the feldspar single-grain level is investigated.
The implications of ourfindings are discussed in the context of lumi- nescence dating of sand-sized feldspar grains.
2. Methods 2.1. Samples
This study focussed on feldspars originating from sedimentary
https://doi.org/10.1016/j.radmeas.2018.06.003
Received 15 December 2017; Received in revised form 30 March 2018; Accepted 2 June 2018
∗Corresponding author. Center for Nuclear Technologies, Technical University of Denmark, DTU Risø Campus, Denmark.
E-mail address:jabu@dtu.dk(J.-P. Buylaert).
1350-4487/ © 2018 The Authors. Published by Elsevier Ltd. This is an open access article under the CC BY-NC-ND license (http://creativecommons.org/licenses/BY-NC-ND/4.0/).
Please cite this article as: Buylaert, J.-P., Radiation Measurements (2018), https://doi.org/10.1016/j.radmeas.2018.06.003
environments of relatively low external dose rate (≤1.5 Gy ka−1) so that the internal 40K beta dose rate makes up a significant (≥30%) proportion of the total dose rate. Four low dose rate sand samples were chosen from aeolian, beach, shallow marine andfluvial environments.
The aeolian sample (178109) was a carbonate-cemented stratified aeolianite from Portugal. The beach sample (178112) from Skagen (Denmark) was an aeolian deposit sandwiched between two peat layers.
The shallow marine sample (981007) is of Eemian age and is inter- calated between an early Weichselian till and an early Eemian clay (Murray and Funder, 2003; Buylaert et al., 2011, 2012). A sample (D38146) from an∼3 m thick last glacial Chinese loess unit with a high external dose rate (∼3 Gy ka−1) (Section4.2) was also used. In all these four cases, because of the presence of sedimentary structures with the units, we can be confident that vertical mixing between units of dif- ferent ages is very unlikely; they are very likely to be well-bleached because of the deposition environments. Afifth sample, a low dose rate fluvial sand (133311) from The Netherlands was also used. Standard sample preparation techniques were applied (wet sieving to > 63μm, 10% HCl, 10% H2O2,10% HF for 20–40 min). Hydrofluoric etching of the grains is carried out to avoid the influence of coatings (e.g. Fe- oxides) and/or feldspar weathering products on the chemical analyses (Section 2.3). The potassium- and sodium-feldspar fractions were se- parated using heavy liquid (K-feldspar:ρ< 2.58 g cm−3; Na-feldspar:
2.58 g cm−3<ρ< 2.62 g cm−3) and then dried at 45 °C. Quartz was isolated from the > 2.62 g cm−3 fraction by 40–60 min concentrated HF treatment. A summary of relevant quartz OSL data, external dose rates and grain size ranges can be found inSupplementary Table 1.
2.2. Luminescence measurements
For single-grain measurements, Risø TL/OSL DA-20 readers with dual-laser single-grain attachments were used (Bøtter-Jensen et al., 2003). Multi-grain measurements were carried out on standard Risø TL/OSL DA-20 readers (Bøtter-Jensen et al., 2010). The IRSL and post- IR IRSL signals were detected through a combination of Corning 7/59 and Schott BG39 filters (blue filter combination). For single-grain measurements, feldspar grains were loaded in standard single-grain discs (10 × 10 grid, 300μm deep and wide holes). Molybdenum cups were used as a substrate for the multi-grain aliquots containing many hundreds of loose feldspar grains. Grain-size-dependent beta dose rates were taken fromHansen et al. (these proceedings). Post-IR IRSL signals (Thomsen et al., 2008) were measured using a post-IR IR150(Madsen et al., 2011) or a post-IR IR290(Thiel et al., 2011) protocol. Both for single grain and multi-grain De measurements, first IR stimulations were made with IR LEDs for 200 s with the sample held at 50 °C (except for sample D38146 for which it was 200 °C). The post-IR IR stimulation at 150 °C or 290 °C was done with the IR laser (1 s) in the case of single grains and with IR LEDs (200 s) for multi-grain aliquots. High tem- perature IR bleaching steps (200 s) at the end of the SAR cycle were carried out at 200 °C and 325 °C using LEDs for the pIRIR150 and pIRIR290protocols, respectively. Fading rates (gvalues) were measured following Auclair et al. (2003), using a SAR protocol on multi-grain aliquots mounted on stainless steel cups using silicon spray.
The software package Analyst(version 4.31.9;Duller, 2016) was used for signal processing and calculation of De,g2daysvalue and un- certainties. Net single-grain pIRIR signals were calculated from thefirst 0.034 s of stimulation minus a background derived from the last 0.272 s of stimulation. Multi-grain IR and pIRIR signals were derived from the first 2 s and the last 50 s of stimulation. Dose response curves were fitted using single saturating exponential functions. Single-grain De
values were accepted if the uncertainty on the test dose signal was <
10%. We could not detect a dependence of single-grain Deon recycling ratio, indicating that the average Deis unaffected by rejecting grains with relatively poor recycling ratios (Fig. S1); this has already been shown to be true for quartz single grain OSL (Thomsen et al., 2012, 2016). On average the recycling ratios are within 3% of unity (except
for sample 981007 for which it is 8%) which we consider satisfactory. A measurement error of 2.5% was incorporated into the uncertainty on the single-grain Devalues.
2.3. Chemical analyses
After Demeasurement, single-grain discs were transferred directly to a Brüker M4 Tornadoμ-XRF instrument (beam spot size:∼25μm, effective K, Ca sampling depth∼30μm, Na∼5μm) to determine the Si, Al, K, Na, Ca and Rb concentrations. Calibration of theμ-XRF in- volved three K-feldspar (JF-2, NIST SRM70a, NIM-S) and three Na- feldspar (BSC-375, AL-I, JSy-1) reference materials, each of well-known chemical compositions (Jochum et al., 2005). Calibration factors/
equations for each element of interest were obtained by comparing measured and accepted values of reference feldspars over a broad compositional range in K and Na. Repeated analyses of independently known absolute feldspar standards (BCS CRM-376/1, CRPG FK-N, SX 16-02 and ZK) with K concentrations between 4 and 14.2% demon- strated that theμ-XRF analyses are accurate within 0.2–0.9 %K and reproducible within 0.1–0.47 %K. Rb measurements of the CRPG FK-N potassium feldspar standard yielded a mean Rb concentration of 871 ppm (standard error (se) = 25 ppm, n = 5) to be compared to the certified value of 860 ppm.
Theμ-XRF analyses were restricted to pre-defined regions of each single-grain to reduce the Al background from the single-grain disc to negligible levels. Analyses focussed only on intact single grains, and if more than one grain was present in a hole these grains were ignored. At least three randomly placed spots were measured on each grain with acquisition times of 45 s using a single Rh target X-ray tube (600μA, 50 kV) focussed to a spot size of∼25μm by polycapillary lens optics.
Raw analytical data were corrected off-line using previously de- termined calibration factors (see above).
Subsequent to De measurement, multi-grain aliquots were trans- ferred to another luminescence reader equipped with a Risø XRF at- tachment (Kook et al., 2012) and analysed for relative K, Na and Ca content (e.g.Porat et al., 2015).
3. Precision
3.1. Single-grain dose measurement
The reproducibility of dose measurement was investigated using single grains. Annealed (550 °C/1 h) 180–212μm K-feldspar grains of sample 178109 were loaded in 12 single grain discs. One group of six discs was given a dose of 8 Gy and the other group a dose of 20 Gy and both groups were measured using a pIRIR50,290protocol (test dose 4 and 10 Gy, respectively). The overall measured-to-given dose ratio was close to unity (1.017 ± 0.004, n = 946 grains) and the associated average over-dispersion 6.2 ± 0.8% (n = 12 discs). This over-disper- sion has been added in quadrature to the uncertainty of all the single- grain dose measurement discussed below (cf.Thomsen et al. (2005)for single grain quartz OSL Devalues).
3.2. Single-grain K measurement
The precision of ourμ-XRF K measurements was tested using be- tween 3 and 7 repeat measurements on selected individual grains from three samples.Figs. S2a–cshows that these K analyses are reproducible within each grain with an average standard deviation of 0.8% K (Fig.
S2d).
4. Results
4.1. Relationship between single-grain Deand K concentration
In a typical sediment where the average total dose rate to 200μm K-
rich feldspar grains is 2.5 Gy.ka−1, calculations predict that∼30% of this dose rate should come from40K internal to the grain (assuming the usual 12.5% K concentration, Huntley and Baril, 1997). In this ex- periment, wefirst measure the pIRIR Deon a grain-by-grain basis and then the K concentration in each grain. Because the grains remain in the single-grain disc and are not disturbed between dose and concentration measurements, we are confident that our dose and concentration measurements directly correspond to one another.
Apparent potassium concentrations in K- and Na-rich separates from 4 samples are summarised inFig. 1and range between 0 and 16%, with most between 10 and 14%. It appears that none of the Na-feldspar extracts are pure; they all contain a significant fraction of high-K con- centration grains. There are also some low K concentration grains in the K-rich extracts for two samples (Fig. 1a and b) but these are not common. The expected relationships between dose and K concentra- tions (dashed lines inFig. 1) are based on the measured large aliquot quartz age and predicted feldspar dose rate. None of our samples show the expected relationship between Deand K concentration, and almost all of the single-grain doses (and the calculated KF CAM De) under- estimate the expected dose (single grains of sample 981007 also un- derestimate the independent Eemian age control,Murray and Funder, 2003). It is interesting to note that the synthetic aliquot data (summing all the luminescence from a single grain disc) also tend to under- estimate the large aliquot dose estimate for 3 out of 4 samples. This may have arisen from the different experimental conditions - large aliquot pIRIR De's were measured using IR LEDs whereas single grains were stimulated both with IR LEDs (IRSL at 50 °C) and the single grain IR laser (elevated temperature). Further research is needed to clarify the cause of this discrepancy.
4.2. Multi-grain isochron
An alternative approach to investigating the dependence of Deon the K contribution to internal dose rate is to measure the multi-grain K- feldspar De for different grain sizes and construct an age isochron (Mejdahl, 1983; Li et al., 2008). Four samples (178109, 178112, 133311, see above, and D38146) were sieved to different grain sizes (43–63, 63–90, 90–125, 125–180, 180–212, 212–250, 250–300, 300–500μm;Table S1). The overall purity of the K-rich extracts was confirmed using the multi-grain XRF-attachment on the reader (Fig. 2b,d,f,h). Measurements of several aliquots from individual sam- ples give an overall standard deviation of 0.30% K (this includes any natural inter-aliquot variability).
Isochrons of positive slopes were measured using both IR50 and pIRIR signals for three samples (Fig. 2a,c,e) but surprisingly for the loess sample (D38146,Fig. 2g) the slope is negative. In view of this we used a dose recovery test to confirm that our chosen protocol was able to measure accurately a given dose independent of grain size (data not shown). All deviations from unity are < 7% and do not correlate with the negative slope of the isochron. There is no evidence that we can attribute the unexpected negative slope of this sample to poor SAR performance.
In addition, even for the samples for which the isochrons are posi- tive the slopes of both the IR50and pIRIR data are consistently lower than expected and even the pIRIR data do not predict the expected dose at 0% K. In all cases the apparent feldspar age is dependent on grain size. Nevertheless it is interesting to note that the pIRIR signal mea- sured on 200μm grains would give an age consistent with quartz for samples 178112 and D38146 (Fig. 2c,g; see alsoFig. 1c for sample 178112). For the other two samples the pIRIR signal would under- estimate at 200μm (Fig. 2a,e, see alsoFig. 1a,d).
Average K concentration (%) 0 2 4 6 8 10 12 14 16
pIRIR50,150 De (Gy) 0 20 40 60 80 100
KF sg (n=18) 120
NaF sg (n=18) Qz la KF la KF synth. aliq.
KF SG CAM K and D
d) 133311 180-212 μm
pred KF D
Average K concentration (%) 0 2 4 6 8 10 12 14 16 pIRIR50,150 De (Gy)
0 5 10 15
KF sg (n=37) NaF sg (n=19) Qz la KF la KF synth. aliq.
KF CAM SG K and D
c) 178112 180-212 μm
pred. KF D
pIRIR50,290 De (Gy) 0 100 200 300 400
KF sg (n=73) NaF sg (n=15) Qz la KF la KF synth. aliq.
KF SG CAM K and D
a) 178109 180-212 μm
pred.KF D
pIRIR50,290 De (Gy) 0 100 200 300
KF sg (n=49) KF la Q la KF synth. aliq.
KF SG CAM K and D
b) 981007 150-250 μm
predKF D
Fig. 1.a–d. Single-grain pIRIR Deas a function of average K concentration per grain for four different samples. Grains from the Na-feldspar extract (NaF) have red symbols and those from K-feldspar extract (KF) are shown in black. Large aliquot (quartz = blue; K-feldspar = green) results, synthetic aliquots from KF single grain data (white), Central Age Model (Galbraith et al., 1999; CAM) single grain K and Deresults (cyan) and predicted feldspar dose (grey dashed line) are also shown. The large aliquot and synthetic aliquot KF De's are plotted at the K concentration measured using the multi-grain XRF-attachment. The predicted feldspar line was calculated from the quartz age and calculated feldspar dose rate for different K concentrations. Uncertainties on both axes represent one standard error. Note that 9 out 229 grains have K values significantly greater than 14%. We attribute this to experimental uncertainty, posibly arising from self-absorption geometry effects in theμ-XRF measurements; pressed powders used for calibration hadflat surfaces whereas single grains had irregular surfaces. (For interpretation of the references to colour in thisfigure legend, the reader is referred to the Web version of this article.)
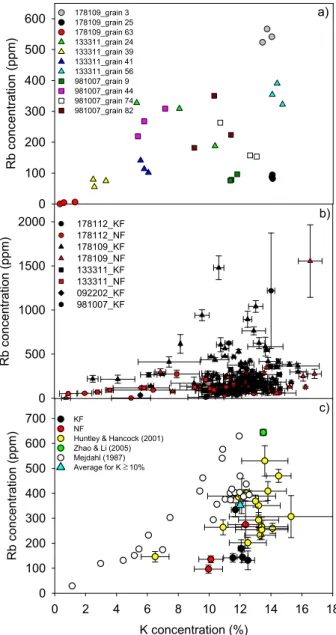
4.3. Single grain K/Rb ratios
Warren (1978)was thefirst to assess the contribution of87Rb to the
internal dose rate assuming a K to Rb ratio of 200:1. Later,Mejdahl (1987)andHuntley and Hancock (2001)observed a linear relationship between Rb concentration and K concentration for multi-grain K- Fig. 2.a–h. Multi-grain isochron plots (both IR50and pIRIR) and corresponding XRF analyses for the different K-feldspar grain size extracts for three samples presented inFig. 1and one additional Chinese loess sample (D38146). Predicted lines (dashed) are calculated from the quartz De(pink), beta attenuation factors (Mejdahl, 1979) and an assumed K concentration of 12.5% and a Rb concentration of 400 ppm. (For interpretation of the references to colour in thisfigure legend, the reader is referred to the Web version of this article.)
feldspar extracts but with different slopes.Mejdahl (1987)looked at the concentrations of bulk extracts whereasHuntley and Hancock (2001) corrected for the fact that the extracts were not pure K-feldspar. Here we examined this relationship both at the intra-grain and the inter- grain level. Finally, we compare our grain-averaged results with pub- lished values.
Fig. 3a summarises a representative selection of repeat K and Rb concentration measurements per grain (3 measurements per grain). It can be seen that in some grains the repeat measurements are re- producible whereas in others there is considerable spread in either or both axes (e.g. 133311_grain24, 981007_grain82). While it is true that the higher concentrations of Rb are only found in high K grains, some high K grains contain very low values of Rb.
The average single-grain Rb and K concentration results are pre- sented in Fig. 3b. There is significant variability in Rb (and K)
concentration between individual grains and no clear correlation be- tween K and Rb is visible. Although the number of grains is limited, it is interesting to note that none of the low K (< 7%) IR-sensitive grains show high Rb concentrations (> 250 ppm). For the high K (> 10%) grains, considerable variability (> 15 times) in Rb concentration is observed between individual grains, even within the same sample. For example, a single 200μm K-feldspar grain of sample 178109 with K concentration 10.6 ± 0.3% has a Rb concentration of 1478 ± 135 ppm. More than 35% of the internal beta dose rate for this grain is due to Rb assuming an internal U and Th contribution of 0.1 Gy ka−1(based onMejdahl, 1987;Zhao and Li, 2005). In contrast to this, another K-feldspar grain from the same sample with a K concentration of 12.0 ± 0.3% and Rb concentration of 88 ± 8 ppm, receives only 3% of the internal dose rate from Rb. The contribution of Rb to the total dose rate for these two grains is∼20% and∼1%, respectively. At least at the single-grain level, it may be that internal Rb variation between individual grains contributes to De scatter in K-rich feldspar grains.
Nevertheless, the observed De scatter between individual feldspar grains inFig. 1cannot be explained by inter-grain Rb concentration variation, because the predicted lines were derived using afixed as- sumed Rb concentration of 400 ppm. Had the actual Rb concentrations been significantly higher than this, the predicted Derelationship with K concentrations (dashed lines) would have been incorrectly low, and the measured single-grain Deestimates would have tended to lie above the predicted line; this is not observed. And since the assumed 400 ppm Rb concentration only contributes∼3% to the total dose rate, if the actual Rb concentrations were very much smaller than assumed, the dose rate (and so the dose) compared to other grains would only be 3% different from the mean. We conclude that variations in Rb cannot account for the absence of correlation of Dewith K concentration.
Fig. 3c summarises our Rb data averaged over all grains for the Na- and K-feldspar rich fractions together with published data. Our results are consistent with those reported earlier although systematically slightly lower; this may be due to different geological source areas. The average Rb concentration for feldspars with K concentration > 10% is 353 ± 20 ppm (σ= 131; n = 42; cyan symbol), which is in good agreement with the value of 400 ± 100 ppm suggested byHuntley and Hancock (2001). In our view, apart from theMejdahl (1987)data, any linear correlation between Rb and K concentration is rather weak. Be- cause the data inMejdahl (1987)was obtained on bulk Na and K-rich feldspar fractions and no correction was made for other mineral con- tamination, it is possible that his clear correlation was induced by quartz contamination of the extracts (i.e. as a result of dilution).
5. Discussion and conclusions
It seems very likely that the emitted energy per disintegration and the half-life are sufficiently well-known that the feldspar doses pre- dicted inFigs. 1 and 2do not suffer from significant systematic error.
Over a period of 26 years, the infinite matrix beta dose rate for40K has only changed by 2.5% (Aitken, 1985;Guérin et al., 2011). In addition, the grain size dependence has been calculated at least by Mejdahl (1979) and Fain et al. (1999) and both gave very similar results.
Therefore, we can infer that inaccuracies in the attenuation of dose- rates to different grain sizes cannot account for the unexpected re- lationships measured in this study.
The precision and accuracy of K analyses at the single-grain level have been demonstrated. By measuring calibration standards we de- duce that theμ-XRF analyses are accurate within 0.2–0.9 K % and re- producible within 0.1–0.47 K %. Repeated measurements on single- grains extracted from sediment samples further show that the overall standard deviation in our analysis of an individual grain (i.e. including natural variability in concentration within a grain) is 0.8% K. The corresponding value for the multi-grain XRF measurements is less than 0.4% K (including any variability as a function of grain size between 40μm and 500μm).
Fig. 3.a) Representative Rb versus K plots for individual feldspar grains (3 measurement per grain). b) Summary of individual grain Rb and K data for all measured grains (n = 202). Colour codes identify feldspar density fractions (red = Na-separate, black = K-separate). c) Same data as in b) but now aver- aged over all the grains in the Na- and K-feldspar extracts, together with pub- lished data. The average of all the samples with K concentration > 10% is also plotted (cyan symbol). Uncertainties represent one standard error for both axes in b) and c). (For interpretation of the references to colour in thisfigure legend, the reader is referred to the Web version of this article.)
In summary, we do not think that the discrepancies observed be- tween observations and predictions can be attributed to uncertainties in expected dose rates. They must be connected in some way to the measurement of dose. It is important at this point to emphasize that our dose estimates are all based on a quartz beta source calibration. This is standard practice because the rate of energy absorption from both beta particles and gamma rays is indistinguishable for quartz and feldspar.
However, beta source calibration is undertaken by matching the lumi- nescence (Lγ) from a known gamma dose (Dγ) with the luminescence (Lβ) from an unknown beta dose (Dβ). That is,Dγχγ=Dβχβ, whereχγ
andχβare the gamma and beta luminescence sensitivities per unit dose.
Thus, for the quartz dose rate to apply to feldspar we must assume that the ratioχγ/χβis the same for both quartz and feldspar. Since gamma rays and beta particles deposit energy by the same mechanism this ratio has been assumed to be unity in both cases. This is an important as- sumption and we return to it below.
It is unlikely that we are unable to detect the expected correlations between dose and K concentration or grain size because the grains are poorly bleached. Had this been the case, all single grain dose analyses should lie above the predicted relationships in Fig. 1, at least on average. Indeed, large aliquot K-feldspar De values (green) are in slightly better agreement with the expected values and are, except for sample 133311 (Fig. 1d), systematically larger than the CAM or syn- thetic aliquot single-grain K-feldspar Deestimates.
Incomplete bleaching also seems unlikely to be an explanation for the discrepancies in the multi-grain data presented inFig. 2. First of all, the samples were chosen from environments that were likely to be well- bleached with the possible exception of sample 133311 (Figs. 1d and 2e). In addition, in two cases the pIRIR relationship with grain size when extrapolated to zero predicts a dose consistent with or below the observed quartz dose (Fig. 2a,e). For sample 178112 (Fig. 2c), it is difficult to draw such a conclusion because the total doses are very small and a very-hard to bleach pIRIR component may play a role.
However, the IR50signal is probably well-bleached and the linear re- lationships observed for pIRIR and IR50 would require that any in- complete bleaching is independent of grain size. This is known not to be true for quartz (Olley et al., 1998;Truelsen and Wallinga, 2003) and seems very unlikely for feldspar. We are confident that incomplete bleaching can be dismissed as a significant contributory factor to the discrepancies observed inFigs. 1 and 2.
Neudorf et al. (2012)also did not observe a correlation between De
and single grain K concentrations and they concluded that the primary cause of their considerable over-dispersion was mixing of units of dif- ferent age. We are confident that this explanation does not apply to at least 4 out of 5 of our samples (see Section2.1).
Fading is an obvious explanation for dose underestimation; fading rates as a function of grain size are presented inFig. S3. Wefirst con- sider the standard large aliquot dose estimates for∼200μm diameter grains (Fig. 1). The large aliquot dose estimates are in fairly good agreement with those expected for samples 981007, 178112 and (by extrapolation) D38146 (Fig. 1b and c;Fig. 2c,g) for which fading ap- pears not to be a problem. On the other hand, the 200μm large aliquot dose estimates for samples 178109 and 133311 significantly under- estimate the expected values by ∼20 and ∼30%, respectively. The average pIRIR fading rates at 200μm are 1.5%/decade and 1.3%/
decade respectively and thus only able to potentially explain the large aliquot underestimate for sample 178109; for 133311 the fading rate is too low.
No significant trend in IR50 or pIRIRg values with grain size is observed in our samples, except for the IR50signal of sample 178112 for which there seems to be a positive correlation (Fig. S3). We now turn to the isochron data ofFig. 2. Given that fading appears to be independent of grain-size, one would expect to see pIRIR data parallel to the ex- pected feldspar dose dependence and intersecting the y-axis below the quartz dose. This is not observed inFig. 2. If, instead, fading were to be grain size dependent then it might have been possible to explain the
observed data inFig. 2e (133311 for which all data lie below the ex- pected line). However, neither IR50nor pIRIR150fading data show a correlation with grain size for this sample. Differential fading may ex- plain the data of sample 178112 (Fig. 2c), but only if a residual dose is subtracted from all dose values. On the other hand, grain size depen- dent fading is unlikely to explain the data in of 178109 (Fig. 2a) and cannot explain the data of sample D38146 (Fig. 2g). In thefirst case such an explanation would require that fading is negligible for very small grain sizes and very large at 400μm (which is not observed inFig.
S3). In the second case, fading cannot explain the dose overestimates.
It is also difficult to explain the lack of correlation between single grain De and K concentration (Fig. 1) in terms of differential fading between individual low and high K grains. In samples 178112 and 133311, the pIRIR Devalues recorded by the low K grains are either consistent with or above the predicted relationship; this implies that the pIRIR signal of low K grains is essentially stable. In contrast, that of high K grains must be very unstable because the high K doses lie con- siderably below the expected line. Published fading rates for the blue violet emission from alkali-feldspars do not suggest such a correlation (e.g.Huntley and Lian, 2006;Barré and Lamothe, 2010). Furthermore, published feldspar single grain studies do notfind any correlation be- tweeng value and K content (e.g.Neudorf et al., 2012; Trauerstein et al., 2014).
In summary, it has again proved impossible to observe the expected correlation between Deand K concentration (and grain size) even in low dose rate environments (down to 0.94 Gy.ka−1 external dose rate, 178112,Figs. 1c and 2c) where the internal dose rate contributes up to 50% of the total. We have demonstrated that our K analyses are precise and accurate and that it is unlikely that a grain-size-dependence of phenomena such as incomplete resetting or signal instability can ex- plain these results. We also dismiss post-depositional mixing as a po- tential cause in at least 4 out of 5 samples. It is deduced that the absence of correlation must be related to dose measurement using feldspar lu- minescence. Recent work by Hansen et al. (these proceedings) has shown that the beta to gamma dose rate ratio measured using lumi- nescence is 15% different for quartz and feldspar. This discrepancy must arise from differences in quartz OSL and feldspar pIRIR response toβandγradiation, i.e. the ratioχγ/χβreferred to above is different for quartz and feldspar, at least for these samples. We hypothesise that this phenomenon also exists both between individual feldspar grains and between grains of different sizes, and that this is at least part of the cause of the lack of correlations. Until these problems are resolved it would be unwise, in our view, to interpret single-grain feldspar dose distribution in terms of any extrinsic phenomena.
Acknowledgements
J.-P. Buylaert and G. Újvári received funding from the European Research Council under the European Union Horizon 2020 research and innovation programme ERC-2014-StG 639904 – RELOS. We thank Pedro Cunha and Antonio Martins for the Portuguese samples and Marie Fibæk for the Skagen sample. We are grateful to Louise Helsted for help with sample preparation.
Appendix A. Supplementary data
Supplementary data related to this article can be found athttp://dx.
doi.org/10.1016/j.radmeas.2018.06.003.
References
Aitken, M.J., 1985. Thermoluminescence Dating. Academic Press, London.
Auclair, M., Lamothe, M., Huot, S., 2003. Measurement of anomalous fading for feldspar IRSL using SAR. Radiat. Meas. 37, 487–492.
Barré, M., Lamothe, M., 2010. Luminescence dating of archaeosediments: a comparison of K-feldspar and plagioclase IRSL ages. Quat. Geochronol. 5, 324–328.
Buylaert, J.P., Thiel, C., Murray, A.S., Vandenberghe, D., Yi, S., Lu, H., 2011. IRSL and
post-IR IRSL residual doses recorded in modern dust samples from the Chinese Loess Plateau. Geochronometria 38, 432–440.
Buylaert, J.P., Jain, M., Murray, A.S., Thomsen, K.J., Thiel, C., Sohbati, R., 2012. A robust feldspar luminescence dating method for Middle and Late Pleistocene sediments.
Boreas 41, 435–451.
Bøtter-Jensen, L., Andersen, C.E., Duller, G.A.T., Murray, A.S., 2003. Developments in radiation, stimulation and observation facilities in luminescence measurements.
Radiat. Meas. 37, 535–541.
Bøtter-Jensen, L., Thomsen, K.J., Jain, M., 2010. Review of optically stimulated lumi- nescence (OSL) instrumental developments for retrospective dosimetry. Radiat. Meas.
45, 253–257.
Duller, G.A.T., 2016. Analyst v.4.31.9: User Manual. Aberystwyth Luminescence Research Laboratory, Aberystwyth University, pp. 1–83.
Fain, J., Soumana, S., Montret, M., Miallier, D., Pilleyre, T., Sanzelle, S., 1999. TL and ESR dating: beta-dose attenuation for various grain shapes calculated by a Monte-Carlo method. Quat. Geochronol. 18, 231–234.
Galbraith, R., Roberts, R.G., Laslette, G., Yoshidha Olley, J., 1999. Optical dating of single and multiple grain quartz from Jinmium Rock Shelter, Northern Australia. Part I, experimental design and statistical models. Archaeometry 41, 339–364.
Guérin, G., Mercier, N., Adamiec, C., 2011. Dose-rate conversion factors: update. Ancient TL 29, 5–8.
Hansen, V., Murray, A.S., Thomsen, K.J., Jain, M., Autzen, M., Buylaert J.-P., Towards understanding the origins of over-dispersion in beta source calibration. Radiat. Meas., (these proceedings).
Huntley, D.J., Baril, M.R., 1997. The K content of the K-feldspars being measured in optical dating or in thermoluminescence dating. Ancient TL 15, 11–13.
Huntley, D.J., Hancock, R.G.V., 2001. The Rb contents of the K-feldspar grains being measured in optical dating. Ancient TL 19, 43–46.
Huntley, D.J., Lian, O.B., 2006. Some observations on tunnelling of trapped electrons in feldspars and their implications for optical dating. Quat. Sci. Rev. 25, 2503–2512.
Jochum, K.P., Nohl, U., Herwig, K., Lammel, E., Stoll, B., Hofmann, A.W., 2005. GeoReM:
a new geochemical database for reference materials and isotopic standards.
Geostand. Geoanal. Res. 29, 333–338.
Kook, M.H., Lapp, T., Murray, A.S., Thiel, C., 2012. A Risø XRF attachment for major element analysis of aliquots of quartz and feldspar separates, 2012. In: UK Luminescence and ESR Meeting, Aberystwyth, September 2012, pp. 37 (abstract).
Li, B., Li, S.-H., Wintle, A.G., Zhao, H., 2008. Isochron dating of sediments using lumi- nescence of K-feldspar grains. J. Geophys. Res. 113, F02026.
Madsen, A.T., Buylaert, J.-P., Murray, A.S., 2011. Luminescence dating of young coastal deposits from New Zealand using feldspar. Geochronometria 38, 379–390.
Mejdahl, V., 1979. Thermoluminescence dating: beta-dose attenuation in quartz grains.
Archaeometry 21, 61–72.
Mejdahl, V., 1983. Feldspar inclusion dating of ceramics and burnt stones. Eur. PACT J 9,
351–364.
Mejdahl, V., 1987. Internal radioactivity in quartz and feldspar grains. Ancient TL 5, 10–17.
Murray, A.S., Funder, S., 2003. Optically stimulated luminescence dating of a Danish Eemian coastal marine deposit: a test of accuracy. Quat. Sci. Rev. 22, 1177–1183.
Neudorf, C.M., Roberts, R.G., Jacobs, Z., 2012. Sources of overdispersion in a K-rich feldspar sample from north-central India: insights from De, K content and IRSL age distributions for individual grains. Radiat. Meas. 47, 696–702.
Olley, J., Caitcheon, G., Murray, A., 1998. The distribution of apparent dose as de- termined by optically stimulated luminescence in small aliquots offluvial quartz:
implications for dating young sediments. Quat. Sci. Rev. 17, 1033–1040.
Porat, N., Faerstein, G., Medialdea, A., Murray, A.S., 2015. Re-examination of common extraction and purification methods of quartz and feldspar for luminescence dating.
Ancient TL 33, 22–30.
Smedley, R.K., Pearce, N.J.G., 2016. Internal U, Th and Rb concentrations of alkali- feldspar grains: implications for luminescence dating. Quat. Geochronol. 35, 16–25.
Thiel, C., Buylaert, J.-P., Murray, A.S., Terhorst, B., Hofer, I., Tsukamoto, S., Frechen, M., 2011. Luminescence dating of the Stratzing loess profile (Austria)‒Testing the po- tential of an elevated temperature post-IR IRSL protocol. Quat. Int. 234, 23–31.
Thomsen, K.J., Murray, A.S., Bøtter-Jensen, L., 2005. Sources of variability in OSL dose measurements using single grains of quartz. Radiat. Meas. 39, 47–61.
Thomsen, K.J., Murray, A.S., Jain, M., Bøtter-Jensen, L., 2008. Laboratory fading rates of various luminescence signals from feldspar-rich sediment extracts. Radiat. Meas. 43, 1474–1486.
Thomsen, K.J., Murray, A.S., Jain, M., 2012. The dose dependency of the overdispersion of quartz OSL single grain dose distributions. Radiat. Meas. 47, 732–739.
Thomsen, K.J., Murray, A.S., Buylaert, J.P., Jain, M., Hansen, J.H., Aubry, T., 2016.
Testing single-grain quartz OSL methods using sediment samples with independent age control from the Bordes-Fitte rockshelter (Roches d'Abilly site, Central France).
Quat. Geochronol. 31, 77–96.
Trauerstein, M., Lowick, S.E., Preusser, F., Schlunegger, F., 2014. Small aliquot and single grain IRSL and post-IR IRSL dating offluvial and alluvial sediments from the Pativilca val-ley. Peru. Quat. Geochron 22, 163–174.
Truelsen, J.L., Wallinga, J., 2003. Zeroing of the OSL signal as a function of grain size:
investigating bleaching and thermal transfer for a youngfluvial sample.
Geochronometria 22, 1–8.
Warren, S.E., 1978. Thermoluminescence dating of pottery: an assessment of the dose- rate from rubidium. Archaeometry 20, 69–70.
Willerslev, E., Cappellini, E., Boomsma, et al., 2007. Ancient biomolecules from deep ice cores reveal a forested southern Greenland. Science 317, 111–114.
Zhao, H., Li, S.-H., 2005. Internal dose rate to K-feldspar grains from radioactive elements other than potassium. Radiat. Meas. 40, 84–93.