Optimizing Sample Size for Molecular Characterization of Open-pollinated Maize (Zea Mays L.) Varieties Using Simple
Sequence Repeat Markers
G. ArAfAyne1, A. Menkir2, V.O. AdetiMirin3 and M. Gedil2*
1Ambo University, Department of Plant Sciences, Ambo, Ethiopia
2International Institute of Tropical Agriculture, Oyo Road, PMB 5320, Ibadan, Nigeria
3Department of Agronomy, University of Ibadan, Nigeria (Received 4 July 2017; Accepted 13 April 2018;
Communicated by V. Korzun)
Molecular-based characterization of open-pollinated varieties (OPVs) in maize is useful to define their unique profiles. A total of 58 SSR markers selected from a panel of 70 were used for genotyping three samples of 30, 50 and 100 plant bulks for each of 32 OPVs. The SSR markers detected a total of 253 alleles in the 32 maize OPVs across the three bulk samples. The number of alleles per marker varied from 2 to 7, with an overall mean of 4.36.
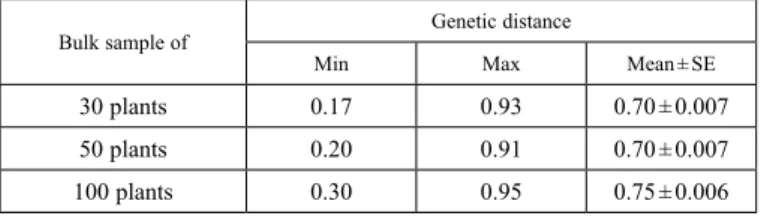
The genetic distance among the OPVs varied from 0.17 to 0.93 with an average of 0.70 ± 0.007 for bulk samples of 30 plants, 0.20 to 0.91 with an overall mean of 0.70 ± 0.007 for bulk samples of 50 plants and from 0.30 to 0.95 with an average of 0.75 ± 0.006 for bulk samples of 100 plants. Cluster analysis separated the 32 maize OPVs into two major groups, which were further separated into two sub-groups for each type of bulk sample. The group- ings of the OPVs into two major groups and their corresponding sub-groups was consistent with known breeding history (common parentage) and common target traits during develop- ment of the OPVs irrespective of the sample size used. However, in the bulk samples of 50 and 100 plants, some sub-groups were composed of OPVs with mixed maturity classes and diverse genetic backgrounds. Of the three independent bulk samples, the smallest sample size of 30 plants was found to be optimal for characterizing heterogeneous and heterozygous maize populations and OPVs owing to its cost-effectiveness and relative ease of sample processing.
Keywords: maize, cluster analysis, genetic diversity, SSR markers, OPV
Introduction
Maize (Zea mays L.) is a major staple food crop for more than 300 million people in sub- Saharan Africa (Smale et al. 2013). Decades of maize breeding in Africa resulted in the development and release of numerous varieties and hybrids. Nearly 44% of the maize area in developing countries is planted to improved maize hybrids and 56% to open-pol- linated varieties (OPVs) (CIMMYT 1994). The relative ease at which the OPVs move through farmer-to-farmer seed exchange coupled with their specific adaptation to mar-
*Corresponding author; Email: m.gedil@cgiar.org; Phone: +234 8039784424
ginal production environment and their endowment with specific end-use quality traits preferred by farmers could be the reasons why OPVs still dominate in smallholder farm- ers’ fields in Africa (Pixley 2006). Furthermore, seed of OPVs can be recycled for at least three years, saving resource-poor farmers from buying seeds every season to plant their fields in areas where climate conditions and the potential yield are very unpredictable (Semagn et al. 2014). As OPVs can be easily developed by inter-crossing inbred lines with good combining ability or families selected from broad-based populations with dis- tinct and stable characteristics across seasons and production environments (Lyimo et al.
2014), they will continue to occupy a significant maize production area in many develop- ing countries.
The involvement of non-governmental organizations (NGOs) to assist smallholder farmers to recover from drought and other disasters may also contribute to persistent production of OPVs in large areas, as NGOs mainly distribute OPVs (Semagn et al.
2014). Many NGOs often rely on local seed suppliers for relief, and in some years, the seeds supplied to the farmers may be of poor quality resulting in very low yield (Warbur- ton et al. 2010). Consequently, determining the identity of OPVs may guarantee the pro- duction and supply of good quality seeds to farmers. This can be accomplished using morphological markers, and DNA fingerprinting (Warburton et al. 2010). Although OPVs are genetically variable, protocols have been developed and used to demonstrate that they are distinct, uniform, and stable (DUS). DUS is mainly done based on morphological traits recorded in the field for one or more growing season (Warburton et al. 2010). Mor- phological traits are measured on 40 plants and are recorded from the seedling stage up to physiological maturity; thus, they are time-consuming and could also be affected by the prevalent environmental conditions (Hipi et al. 2013). Therefore, the characterisation of OPVs using molecular markers offers complementary information to identify and distin- guish different OPVs of maize with confidence. Different molecular markers are now available to characterize OPVs. Amongst these, Simple Sequence Repeats (SSRs) have been commonly used because of their high polymorphic information content (PIC) per marker, uniform distribution in the genome and multi-allelic nature.
The presence of a considerable amount of genetic variability within maize OPVs re- quire analysis of a large and representative sample of individuals for each OPV that makes analyses difficult, costly, and time-consuming (Dubreuil et. al. 2006; Warburton et al. 2010). Genotyping with SSRs using pools of individuals from a population has proven to be much more efficient than characterizing several individuals per population (Warbur- ton et al. 2010). Bulk samples used in numerous genetic diversity studies involved 8 to 15 individual plants (Reif et al. 2005; Dubreuil et al. 2006; Eschholz et al. 2008; Etten et al.
2008) or two bulk samples each of 15 individual plants (Dubreuil et al. 2006; Warburton et al. 2010) to represent the inherent genetic diversity within populations. However, lim- ited studies have been conducted to assess whether bulk samples containing more than 30 plants per population will provide better classification of OPVs with molecular markers.
Many improved OPVs have been registered and released for production by resource- poor farmers in West and Central Africa (WCA). Understanding the genetic relationships among these OPVs will be useful for their deployment to farmers to minimize the poten-
tial risk associated with genetic uniformity under variable growing conditions. The objec- tives of this study were to (i) assess the genetic relationships among maize OPVs devel- oped at IITA using SSR markers, (ii) identify a set of SSR markers that can be used to establish the unique profile of maize OPVs in WCA, and (iii) determine an optimum sample size for effective molecular characterization of OPVs.
Materials and Methods
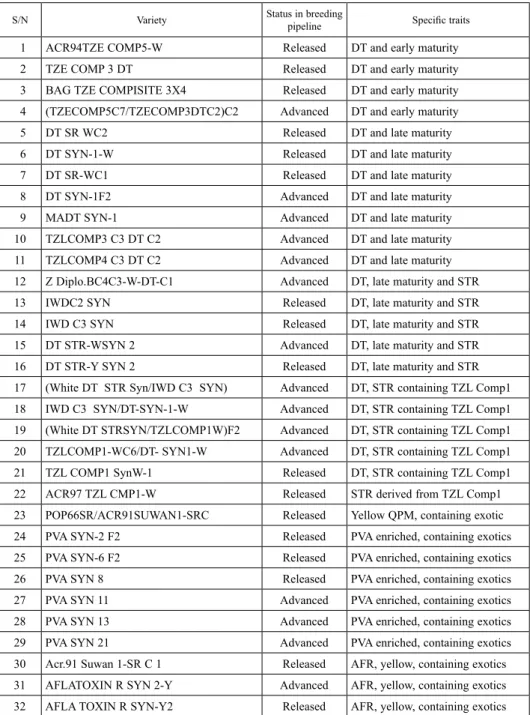
A total of 32 OPVs developed at the International Institute of Tropical Agriculture (IITA) were used for this study (Table1). Amongst these, 15 OPVs are at advanced stages of test- ing for release, whereas 17 have already been released by the National Agricultural Re- search Systems in collaboration with IITA. Seeds of these varieties were obtained from the Maize Improvement Program of IITA. A total of 250 seeds drawn at random from each OPV were planted in different pots to obtain sufficient number of plants for DNA extraction.
DNA was extracted from lyophilized leaves using a modified CTAB procedure as de- scribed in Azmach et al. (2013). Each OPV was represented by three leaves of 30, 50 and 100 plants. The extraction was done using the bulk samples of 30, 50 and 100 as de- scribed by Semagn et al. (2012a).
A total of 70 SSR markers covering the ten chromosomes of the maize genome, includ- ing 18 chosen from the Maize GDB (Maize GDB; http://www.maizegdb.org) and 52 SSR markers used by Warburton et al. (2002), were screened for amplification and polymor- phism using eight samples representing OPVs with diverse genetic backgrounds. Amongst these, 58 polymorphic primers were used for genotyping the three independent bulks for each of the 32 OPVs (Table S1*). PCR amplification was carried out in a total volume of 25 µl containing 2.5 μl of genomic DNA, 2.5 μl of 10X PCR buffer, 2 μl dNTPs, 1 μl MgCl2, 1 μl of the forward and the reverse primers each, 1 μl of Dimethyl Sulfoxide, 0.15 μl of 5 u/μl Taq polymerase and 13.85 μl of ultra-pure water. The PCR reactions were performed in Veriti or GenAmp 9700 Thermo cyclers (Applied Bio systems, USA) using the following PCR programme: pre-denaturation step at 94 °C for 2 min, a touchdown step with 9 cycles with denaturing at 93 °C for 15 s, annealing at 65 °C for 20 s and exten- sion at 72 °C for 30 s followed by 24 cycles of denaturing at 93 °C for 15 s, annealing at 55 °C for 20 s, and extension at 72 °C for 30 s and final extension for 5 min at 72 °C. The amplicons were visualized by electrophoresis on 2% agarose gels stained with ethidium bromide. The images were captured with a gel documentation system (ENDURO GDS, Labnet International, inc., USA).
The SSR bands/alleles were scored as present (1), absent (0) and missing data (?). Bi- nary data generated from the 58 SSR markers were used to estimate the genetic relation- ship among the 32 OPVs using Power Marker version 3.25 (Liu and Muse 2005) and Gene Alex version 6.5 (Peakall and Smouse 2012). Numbers of alleles per marker and polymorphic information content (PIC) values were calculated using Power Marker ver- sion 3.25. The genetic diversity parameters such as effective number of alleles (Ne),
*Further details about the Electronic Supplementary Material (ESM) can be found at the end of the article.
Table 1. List of OPVs developed at IITA and used for the present study
S/N Variety Status in breeding
pipeline Specific traits
1 ACR94TZE COMP5-W Released DT and early maturity
2 TZE COMP 3 DT Released DT and early maturity
3 BAG TZE COMPISITE 3X4 Released DT and early maturity
4 (TZECOMP5C7/TZECOMP3DTC2)C2 Advanced DT and early maturity
5 DT SR WC2 Released DT and late maturity
6 DT SYN-1-W Released DT and late maturity
7 DT SR-WC1 Released DT and late maturity
8 DT SYN-1F2 Advanced DT and late maturity
9 MADT SYN-1 Advanced DT and late maturity
10 TZLCOMP3 C3 DT C2 Advanced DT and late maturity
11 TZLCOMP4 C3 DT C2 Advanced DT and late maturity
12 Z Diplo.BC4C3-W-DT-C1 Advanced DT, late maturity and STR
13 IWDC2 SYN Released DT, late maturity and STR
14 IWD C3 SYN Released DT, late maturity and STR
15 DT STR-WSYN 2 Advanced DT, late maturity and STR
16 DT STR-Y SYN 2 Released DT, late maturity and STR
17 (White DT STR Syn/IWD C3 SYN) Advanced DT, STR containing TZL Comp1
18 IWD C3 SYN/DT-SYN-1-W Advanced DT, STR containing TZL Comp1
19 (White DT STRSYN/TZLCOMP1W)F2 Advanced DT, STR containing TZL Comp1
20 TZLCOMP1-WC6/DT- SYN1-W Advanced DT, STR containing TZL Comp1
21 TZL COMP1 SynW-1 Released DT, STR containing TZL Comp1
22 ACR97 TZL CMP1-W Released STR derived from TZL Comp1
23 POP66SR/ACR91SUWAN1-SRC Released Yellow QPM, containing exotic
24 PVA SYN-2 F2 Released PVA enriched, containing exotics
25 PVA SYN-6 F2 Released PVA enriched, containing exotics
26 PVA SYN 8 Released PVA enriched, containing exotics
27 PVA SYN 11 Advanced PVA enriched, containing exotics
28 PVA SYN 13 Advanced PVA enriched, containing exotics
29 PVA SYN 21 Advanced PVA enriched, containing exotics
30 Acr.91 Suwan 1-SR C 1 Released AFR, yellow, containing exotics
31 AFLATOXIN R SYN 2-Y Advanced AFR, yellow, containing exotics
32 AFLA TOXIN R SYN-Y2 Released AFR, yellow, containing exotics
PVA: Pro-Vitamin A, DT: Drought tolerance, STR: Striga resistance, QPM: Quality protein maize, AFR: Aflatoxin resist- ance.
Shannon’s information index of diversity in a population (I) and expected heterozygosity (He) under random mating were calculated using Hurtado et al. (2008) formula with Gene Alex. Genetic distance (GD) among the OPVs was determined using Jaccard distance in SAS version 9.3 (SAS Institute 2010). Dendrograms were constructed from the GD ma- trix for each of the three independent bulk samples using Ward’s clustering algorithm implemented in SAS (SAS Institute 2010).
Results Overall Genetic Diversity of OPVs with SSR markers
The 58 SSR markers detected a total of 253 alleles in 32 maize OPVs across the three bulk samples. The number of alleles per marker ranged from 2 for Phi034 to 7 for BNLG 2180, with an average of 4.36. The PIC value ranged between 0.37 and 0.78 with a mean of 0.63 (Table S1). Most of the 58 SSRs were found to be discriminatory in the present study, with PIC values above average. The observed heterozygosity (Ho) varied from 0.01 for PHI 008 to 1 for PHI 109642, with an average of 0.65. The gene diversity varied from 0.5 to 0.81, with an average of 0.69. The lowest gene diversity was found with primer Phi034 while the highest value was obtained with primer UMC 1152.
Genetic diversity within and between Samples
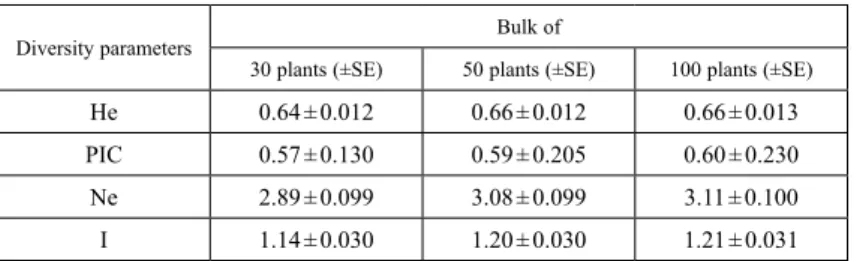
In the present study, three bulk samples of each OPV containing 30, 50 and 100 plants were genotyped with 58 SSR markers to determine the optimum sample size for molecu- lar characterization of maize OPVs. The SSRs detected a total of 231 alleles in bulk sample containing 30 plants and 243 alleles each in bulk samples containing 50 and 100 plants. The number of alleles per marker varied from 2 to 6 in bulk samples of 30 and 50 plants, and 2 to 7 in bulk sample of 100 plants. Bulk samples containing 30 and 50 plants had one allele each which was not found in the 100 plants bulk, whereas the bulk sample of 100 plants had seven alleles which were not found in the other two bulks. Among the seven alleles, four were common to drought tolerant, Striga resistant and yellow en- dosperm OPVs whereas the remaining three alleles were found only in drought tolerant OPVs. The 30, 50 and 100 plant bulk samples had an average PIC value of 0.57, 0.59 and
Table 2. Mean Allelic Patterns across the three bulks
Diversity parameters Bulk of
30 plants (±SE) 50 plants (±SE) 100 plants (±SE)
He 0.64 ± 0.012 0.66 ± 0.012 0.66 ± 0.013
PIC 0.57 ± 0.130 0.59 ± 0.205 0.60 ± 0.230
Ne 2.89 ± 0.099 3.08 ± 0.099 3.11 ± 0.100
I 1.14 ± 0.030 1.20 ± 0.030 1.21 ± 0.031
He: Expected Heterozygosity; PIC: Polymorphic information content; Ne: No. of Effective Alleles;
I: Shannon’s Information Index; SE: Standard error.
0.60, respectively (Table 2). The 100 bulk sample had the highest average effective num- ber of alleles (3.11) followed by the 50 (3.08) and the 30 (2.89) bulk samples. The 30, 50, and 100 bulk samples had an average Shannon’s Diversity Index of 1.14, 1.20 and 1.21, respectively (Table 2).
Grouping of OPVs Within Different Samples
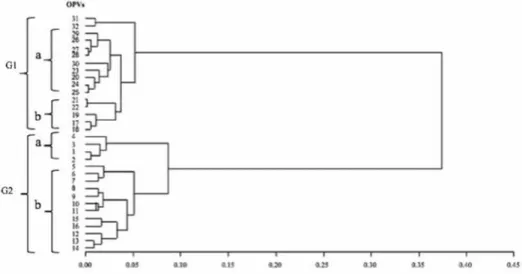
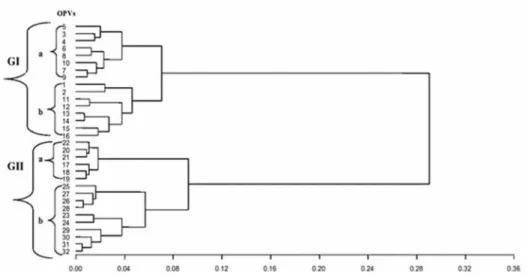
The dendrogram constructed for each of the three bulk samples involving 30, 50, and 100 plants showed two major groups. In the bulk sample of 30 (Fig. 1), the first major group (GI) consisted of two sub-groups, with sub-group a containing Striga resistant/drought tolerant OPVs (a third subgroup is made up of entries 31 and 32 which are aflatoxin resist- ant) and sub-group b containing the yellow to orange OPVs enriched with pro-vitamin A or QPM. Also, the second major group (GII) consisted of drought tolerant OPVs that were split into two sub-groups based on maturity classes. In the bulk sample of 50 plants (Fig. 2), the first major group (GI) had two sub-groups, with one of the sub-groups con- taining two drought tolerant and Striga resistant maize OPVs with a common parent and the second sub-group consisting of OPVs with yellow to orange kernel color with high levels of pro-vitamin A, except four white varieties. The second major group (GII) also had two sub-groups consisting of OPVs separated into early and late maturity drought tolerant genotypes. In the bulk sample of 100 plants (Fig. 3), the first major group (GI) had two clearly defined sub-groups, with each sub group having a mixture of early and late maturity drought tolerant OPVs. On the other hand, the second major group (GII) was split into two sub-groups, with one sub-group containing 10 OPVs with yellow to orange kernel color. Most of the yellow varieties were formed from inbred lines selected for high pro-vitamin A content.
Figure 1. Ward’s clustering showing the genetic relationship among the 32 maize OPVs using bulk samples of 30 plants. Letter ‘G’ denotes group number whereas ‘a’, ‘b’, denote subgroups within a group. The numbers
indicated for the OPVs correspond to their respective serial numbers in Table 1
Genetic Diversity within Groups
Genetic distance matrix was used to determine the level of relatedness among the OPVs.
The GD estimates between OPVs for the bulk sample of 30 plants ranged from 0.17 to 0.93 with an average of 0.70 ± 0.007 (Table 3). The minimum GD (0.17) was found be-
Figure 3. Ward’s clustering showing the genetic relationship among the 32 maize OPVs using bulk samples of 100 plants. Letter ‘G’ denotes group number whereas ‘a’, ‘b’, denote subgroups within a group. The numbers
indicated for the OPVs correspond to their respective serial numbers in Table 1
Figure 2. Ward’s clustering showing the genetic relationship among the 32 maize OPVs using bulk samples of 50 plants. Letter ‘G’ denotes group number whereas ‘a’, ‘b’, denote subgroups within a group. The numbers
indicated for the OPVs correspond to their respective serial numbers in Table 1
tween TZL COMP1 SynW-1 and ACR97 TZL CMP1-W, whereas the maximum GD (0.93) was found between Acr.91 Suwan 1-SR C1 and TZLCOMP4 C3 DT C2. The two major groups exhibited a broad range of genetic diversity among OPVs with 61 pairs of OPVs in the first group and 108 pairs of OPVs in the second group having GD estimates exceeding 0.50 (Supplementary Table 2). The pair wise GD estimates between OPVs for bulk sample of 50 plants varied from 0.20 for POP66SR/ACR 91 SUWAN1-SRC Vs PVA SYN 8 to 0.91 for TZE COMP 3 DT Vs PVA SYN 21, with an average of 0.70 ± 0.007 (Table 3). Again, the two major groups showed considerable genetic diversity among OPVs with 63 pairs of OPVs in the first group and 114 pairs of OPVs in the second group having GD estimates exceeding 0.50 (Supplementary Table 2). The GD estimates be- tween OPVs for bulk sample of 100 plants ranged from 0.3 between AFLATOXIN R SYN 2-Y and AFLATOXIN R SYN-Y2 to 0.95 between TZE COMP 3 DT and (White DT STR Syn / TZL COMP1-W) F2, with an average of 0.75 ± 0.006 (Table 3). The two major groups showed substantial GD estimates among OPVs with the first and second groups having 102 and 117 pairs of OPVs showing genetic distance estimates exceeding 0.50, respectively (Supplementary Table 2).
Discussion
A total of 253 alleles were detected in 32 maize OPVs across the three bulk samples genotyped with 58 SSR markers. The average number of alleles per marker of 4.36 which was similar to the average number of alleles of 4.17 found by Song et al. (2013), 4.47 reported by Pabendon et al. (2009) and 4.16 found by Pinto et al. (2003). However, the average number of alleles found in this study was lower than the 5.2 alleles obtained by Semagn et al. (2014) in two bulk samples of 218 OPVs assayed using 51 SSRs. The ob- served marked differences in the number of alleles detected per SSR marker in this study and those of others may have arisen from differences in: (i) the genetic diversity and number of genotypes tested, (ii) repeat types, (iii) the number and polymorphism of SSR primers examined, and (iv) the methodologies employed for detection of polymorphic markers.
The average PIC value of 0.63 obtained in the present study is similar to the result of Pineda-Hidalgo et al. (2013), who reported a mean value of 0.68 in 28 Mexican maize landraces. However, the PIC value obtained in the present study were considerably lower
Table 3. Genetic distance among genotypes (OPVs) based on number of plants in the three bulk samples
Bulk sample of Genetic distance
Min Max Mean ± SE
30 plants 0.17 0.93 0.70 ± 0.007
50 plants 0.20 0.91 0.70 ± 0.007
100 plants 0.30 0.95 0.75 ± 0.006
Min: minimum, Max: maximum, SE: Standard error.
than those found by Hoxha et al. (2004), who obtained an average PIC values of 0.71 us- ing 20 SSR loci. Amongst the 58 SSR primers, 55 showed PIC values higher than 50%, indicating their potential usefulness to detect differences among the OPVs included in the present study. SSR markers with PIC value higher than 0.5 are efficient in discriminating genotypes and extremely useful in detecting polymorphism (DeWoody et al. 1995).
Therefore, the results indicate that most of the 58 SSR markers used were efficient in clas- sifying the 32 maize OPVs.
Molecular characterization of genetically heterogeneous maize OPVs with high levels of within OPV genetic diversity requires sampling of a large number of representative individual plants in order to capture the allelic diversity present within an OPV. Because sampling a large number of individual plants is time consuming and expensive, several studies have analysed bulk samples with SSRs (Dubreuil et al. 2006; Eschholz et al. 2008;
Etten et al. 2008; Reif et al. 2005; Warburton et al. 2010) for quick and effective genotyp- ing of OPVs. Three dendrograms were constructed for each of the three bulk samples using the Ward’s clustering method to determine the genetic relationships among the 32 OPVs. The pattern of grouping of the OPVs across the three bulk samples into two major groups was consistent with known breeding history and common target traits during the development of OPVs. For example, in group 1 subgroup a consists of varieties devel- oped from germplasm containing introduced temperate and tropical genetic materials.
The most common parentage of these varieties originated from Thailand. Likewise, sub- group b involved varieties developed from TZLcomp1 which is Striga resistant compos- ite. It thus appears that the strong selection pressure for specific traits and adaptation to stressful conditions had significant impact on the genome of the OPVs included in the present study. However, in the bulk samples of 50 and 100 plants, some sub-groups com- prised of OPVs which were not consistent with the maturity classes and specific target traits. On the other hand, the two major groups as well as the sub-groups in the bulk sam- ple of 30 plants were consistent with known maturity groups, genetic backgrounds and common characteristics of the OPVs. The four early and 12 late maturity and drought tolerant OPVs were assigned to the second major group with the two maturity classes clearly separated into two well defined sub-groups. Similarly, the 10 OPVs containing exotic germplasm were assigned to a sub-group in the first major group. It is notable that a bulk sample of 30 plants can provide a clear separation of OPVs into well defined groups. Warburton et al. (2010) found 30 individuals were more satisfactory than 15 plants. Amongst the three bulk samples evaluated in the present study, the 100 plant bulk sample showed the highest average number of effective alleles (Ne), PIC and Shannon’s diversity index (I). It also showed the highest number of unique alleles (7) which were not found in the 30 and 50 bulk samples. Among the seven alleles, four were common to drought tolerant, Striga resistant and yellow endosperm OPVs whereas the remaining three alleles were found only in drought tolerant OPVs, suggesting that the larger the sample size the higher the possibility of detecting unique alleles as detected in the 100 sample size.
The GD estimates for pairs of the 32 OPVs show substantial genetic diversity within the two major groups defined by cluster analysis. This implies that the varieties bred for
specific target traits are genetically diverse and their release for production will minimize the potential risk associated with vulnerability of genetic uniformity to disease and pest outbreaks as well as changes in climatic conditions. Furthermore, the enormous genetic diversity present within each OPV presents a potential source of novel alleles for toler- ance to drought, resistance to Striga hermonthica, increased levels of pro-vitamin A and other desirable traits to further boost productivity and nutrient content in breeding pro- grams.
Acknowledgments
We are indebted to the African Union commission (AUC) and IITA, Ibadan, Nigeria, for funding this research.
References
Azmach, G., Gedil, M., Menkir, A., Spillane, C. 2013. Marker-trait association analysis of functional gene markers for provitamin A levels across diverse tropical yellow maize inbred lines. BMC Plant Biol. 13 (1):227.
CIMMYT. 1994. World Maize Facts and Trends. Maize seed industries, revisited: Emerging Roles of the Public and Private sectors. Mexico, D.F.
DeWoody, J.A., Honeycutt, R.L., Skow, L.C. 1995. Micro satellite markers in white-tailed deer. J. Hered.
86:317–319.
Dubreuil, P., Warburton, M., Chastanet, M., Hoisington, D., Charcosset, A. 2006. More on the introduction of temperate maize into Europe: large-scale bulk SSR genotyping and new historical elements. Maydica 51:281–291.
Eschholz, T.W., Peter, R., Stamp, P., Hund, A. 2008. Genetic diversity of Swiss maize (Zea mays L. ssp. Mays) assessed with individuals and bulks on agarose gels. Genet Resour. Crop Ev. 55:971–983.
Etten, J.V., Lopez, M.R.F., Monterroso, L.G.M., Samayoa, K.M.P. 2008. Genetic diversity of maize (Zea mays L. ssp. mays) in communities of the western highlands of Guatemala: geographical patterns and processes.
Genet Resour. Crop Ev. 55:303–317.
Hipi, A., Surahman, M., Ilyas, S., Giyanto. 2013. Seed Genetic Purity Assessment of Maize Hybrid Using Microsatellite Markers (SSR). International Journal of Applied Science and Technology 3(5):66–71.
Hurtado, P., Olsen, K.M., Buitrago, C., Ospina, C., Marin, J., Duque, M., deVicente, C., Wongtiem, P., Wenzel, P., Killian, A., Adeleke, M., Fregene, M. 2008. Comparison of simple sequence repeat (SSR) and diversity array technology (DArT) markers for assessing genetic diversity in cassava (Manihot esculenta Crantz).
Plant Genet. Resour. 6(3):208–214.
Hoxha, S., Shariflue, M.R., Sharp, P. 2004. Evaluation of genetic diversity in Albanian maize using SSR mark- ers. Maydica 49:97–103.
Liu, K., Muse, S.V. 2005. Power Marker: an integrated analysis environment for genetic marker analysis.
Bioinformatics 21:2128–2129.
Lyimo, S., Mduruma, Z., DeGroote, H. 2014. The use of improved maize varieties in Tanzania. Afr. J. Agr. Res.
9(7):643–657.
Pabendona, M.B., Mejaya, M.J., Koswara, J., Aswidinnoor, H. 2009. SSR-based genetic diversities among maize inbred lines and their relationships with F1 phenotypic data of MR4 and MR14 testcrosses.
Indonesian Journal of Agriculture 2:41–48.
Peakall, R., Smouse, P.F. 2012. Gen AlEx 6.5: Genetic analysis in Excel. Population genetic software for teach- ing and research – An update. Bioinformatics 28:2537–2539.
Pineda-Hidalgo, K.V., Méndez-Marroquín, K.P., Alvarez, E.V., Chávez-Ontiveros, J., sánchez-Peña, P., Garzón-Tiznado, J.A., Vega-García, M.O., López-Valenzuela, J.A. 2013. Microsatellite-based genetic diversity among accessions of maize landraces from Sinaloa in México. Hereditas 150:53–59.
Pinto, L.R., Vieira, M.L.C., Souza Jr, C.L., Souza, A.P. 2003. Genetic diversity assessed by microsatellites in tropical maize populations submitted to a high-intensity reciprocal recurrent selection. Euphytica 134:277–
Pixley, K.V. 2006. Hybrid and Open-Pollinated Varieties in Modern Agriculture. Arnel Hallauer International 286.
Symposium on Plant Breeding, Mexico, 17–22 August 2003, 234–250.
Reif, J.C., Hamrit, S., Heckenberger, M., Schipprack, W., Peter, M.H., Bohn, M., Melchinger, A.E. 2005.
Genetic structure and diversity of European flint maize populations determined with SSR analyses of indi- viduals and bulks. Theor. Appl. Genet. 111:906–913.
SAS Institute. 2010. SAS user’s guide, version 9.3. SAS Institute, Cary, Nc. USA.
Semagn, K., Beyene, Y., Makumbi, D., Mugo, S., Prasanna, B.M., Magorokosho, C., Atlin, G. 2012. Quality control genotyping for assessment of genetic identity and purity in diverse tropical maize inbred lines.
Theor. Appl. Genet. 125:1487–1501.
Semagn, K., Magorokosho, C., Ogugo, V., Makumbi, D., Warburton, M. 2014. Genetic relationships and struc- ture among open-pollinated maize varieties adapted to Eastern and Southern Africa using microsatellite markers. Mol. Breed 34(3):1423–1435.
Smale, M., Byerlee, D., Jayne. 2013. Maize revolutions in sub-Saharan Africa. In: An African green revolution (pp. 165–195). Springer Netherlands.
Song, L., Xue, L., Chen, W., Halo, Z., Bai, L., Zhang, G. 2013. Genetic relationships among Chinese maize OPVs based on SSR markers. Journal of Integrative Agriculture 12(7):1130–1137.
Warburton, M.L., Xianchun, X., Crossa, J., Franco, J., Melchinger, A.E., Frisch, M., Bohn, M., Hoisington, D.
2002. Genetic characterization of CIMMYT inbred maize lines and open pollinated populations using large scale finger printing methods. Crop Sci. 42:1832–1840.
Warburton, M.L., Setimela, P., Franco, J., Cordova, H., Pixley, K., Banziger, M., Dreisigacker, S, Bedoya, C., MacRobert, J. 2010. Toward a cost-effective fingerprinting methodology to distinguish maize open-polli- nated varieties. Crop Sci. 50:1–11.
Electronic Supplementary Material (ESM)
Electronic Supplementary Material (ESM) associated with this article can be found at the website of CRC at https://akademiai.com/loi/0806
Electronic Supplementary Table S1. Summary of the 58 SSRs used in the present study
Electronic Supplementary Table S2. Genetic distance among genotypes within groups based for the three bulk samples