The association between muscle dysmorphia and eating disorder symptomatology: A systematic review and meta-analysis
LAURA BADENES-RIBERA1, MARIA RUBIO-APARICIO2, JULIO SÁNCHEZ-MECA3, MATTEO ANGELO FABRIS4* and CLAUDIO LONGOBARDI4
1Departamento de Methodologia and Behavioral Science, University of Valencia, Valencia, Spain
2Departamento de Psicología de la Salud, University of Valencia, Alicante, Spain
3Departamento de Psicología Básica y Metodología, University of Murcia, Murcia, Spain
4Dipartimento di Psicologia, Università degli Studi di Torino, Turin, Italy
(Received: January 27, 2019; revised manuscript received: June 25, 2019; accepted: July 24, 2019)
Background and aims:Research shows inconsistentfindings about the link between muscle dysmorphia (MD) and eating disorder (ED) symptomatology. The aim of this study is to synthesize the scientific evidence available on this topic, the researchers conducted a systematic review and meta-analysis.Methods:The literature search enabled us to identify 39 published articles, which provided 36 independent estimations of the correlation between the two variables. Results: Our analysis found a positive association between MD and ED symptoms (r+=.36; 95%
CI=0.30, 0.41). Moderator analyses showed that the type of sample and the tools for assessing MD and ED were statistically associated with the MD–ED effect sizes. The methodological quality of the studies exhibited a positive, statistically significant association with the MD–ED effect sizes.Conclusions:Higher levels of MD were related to greater ED symptomatology, but several study characteristics may moderate the association between the two variables. In this study, we discuss limitations and implications for clinical practice and future research.
Keywords:Adonis complex, reverse anorexia, eating behaviors, meta-analysis, muscle dysmorphia
INTRODUCTION
In a study of the psychiatric effects of steroid consumption, Pope, Katz, and Hudson (1993) described a new syndrome called “reverse anorexia,” due to its similarities with anorexia nervosa (AN) and subsequently renamed“muscle dysmorphia” (MD; Pope, Gruber, Choi, Olivardia, &
Phillips, 1997). These authors suggested that MD is a form of body dysmorphic disorder (BDD) characterized by an obsessive preoccupation with the size and shape of one’s muscles, causing significant distress or impairment in daily functioning. Individuals with MD have a preoccupation with not being sufficiently lean and muscular. They believe that their muscles are smaller than they truly are (Grieve, Truba, &
Bowersox, 2009; Olivardia, 2001), and they perceive themselves as puny and unattractive (Olivardia, Pope, &
Hudson, 2000). Consequently, they seek even greater mus- culature and greater leanness to enhance the visibility of their muscularity (Choi, Pope, & Olivardia, 2002).
Additional symptoms associated with MD include the following: poor quality of life (Pope et al., 2005; Tod &
Edwards, 2015a;Tod, Edwards, & Cranswick, 2016); higher rates of mood and anxiety disorders (Cafri, Olivardia, &
Thompson, 2008); risk of obsessive–compulsive symptom- atology and interpersonal sensitivity (Longobardi, Prino, Fabris, & Settani, 2017); lower self-esteem and self-perception (Chaney, 2008; Mitchell, Murray, Cobley, et al., 2017);
increased feelings of loneliness (Chaney, 2008); impairments in social and occupational functioning (Olivardia et al., 2000;
Pope, Khalsa, & Bhasin, 2017; Tod et al., 2016); and depression, neuroticism, and perfectionism (Mitchell, Murray, Cobley, et al., 2017).
MD is more prevalent in males, particularly those who engage in sports that emphasize increased muscle mass or power gain, such as weightlifting or bodybuilding (American Psychiatric Association [APA], 2013;Cella, Iannaccone, &
Cotrufo, 2012; Fabris, Longobardi, Prino, & Settani, 2017;
Pope, Phillips, & Olivardia, 2000). However, studies have also observed MD symptoms in females (Hale, Diehl, Weaver, & Briggs, 2013; Readdy, Cardinal, & Watkins, 2011; Robert, Monroe-Chandler, & Gammage, 2009; Tod et al., 2016). Thus, prior research has shown that both female and male bodybuilders are at extremely high risk of having MD symptoms (Hale et al., 2013). The average age of onset of MD is approximately 19–20 years (Cafri et al., 2008;
Olivardia, 2001), and its etiology is not yet well known (Grieve, 2007).
At present, the American Psychiatric Association (APA, 2013) recognizes MD as a specifier for BDD in the fifth
* Corresponding author: Matteo Angelo Fabris; Dipartimento di Psicologia, Università degli Studi di Torino, Via Verdi 10, Turin 10124, Italy; Phone: +39 011 6703056; Fax: +39 011 8126231;
E-mail:matteoangelo.fabris@unito.it
This is an open-access article distributed under the terms of theCreative Commons Attribution-NonCommercial 4.0 International License, which permits unrestricted use, distribution, and reproduction in any medium for non-commercial purposes, provided the original author and source are credited, a link to the CC License is provided, and changes–if any–are indicated.
DOI: 10.1556/2006.8.2019.44 First published online September 11, 2019
edition of Diagnostic and Statistical Manual of Mental Health Disorders (DSM-5); therefore, it belongs to the obsessive–compulsive disorder spectrum. According to the DSM-5, individuals with MD are preoccupied with the idea that their body build is too small or insufficiently lean or muscular, even though they have a normal-looking body or are quite muscular. Consequently, they perform repetitive behaviors (e.g., mirror checking, excessive grooming, skin picking, and reassurance seeking) or mental acts (e.g., comparing their appearance with that of others) in response to their appearance concerns. Therefore, the body, level of muscularity, and leanness are the obsession, and the compulsion is the desire or drive to gain more muscularity or leanness (Pope et al., 2000; Sandgren & Lavalle, 2018).
Other DSM-5 diagnostic criteria specify the following necessary traits of the disorder: (a) appearance preoccupa- tion should cause clinically significant distress or im- pairment in social, occupational, or other important areas of functioning; and (b) it should not be better explained by concerns with body fat or weight in an individual whose symptoms meet diagnostic criteria for an eating disorder.
Several studies have found an association between MD symptoms and higher levels of ED symptomatology (Giardino & Procidano, 2012; Goodale, Watkins, &
Cardinal, 2001; Hildebrandt, Schlundt, Langenbucher, &
Chung, 2006;Klimek & Hildebrandt, 2018;Lopez, Pollack, Gonzales, Pona, & Lundgren, 2015; Mitchell, Murray, Hoon, et al., 2017; Murray et al., 2012; Olivardia et al., 2000), little or no control over one’s dietary regime, compulsive exercise (Olivardia et al., 2000), diet pill use (McFarland & Kaminski, 2009), vomiting (Hildebrandt et al., 2006; McFarland & Kaminski, 2009), laxative use (Hildebrandt et al., 2006), and a prior history of EDs (Olivardia et al., 2000). Nevertheless, other studies have failed to find an association between MD and ED symptomatology (e.g., Cafri et al., 2008; Maida &
Armstrong, 2005). For instance, Cafri et al. (2008) examined the link between MD and EDs in a sample of weightlifting males who met the current criteria for MD, past MD, or no history of MD. They administered the Structured Clinical Interview for DSM Disorders (SCID) to assess MD and EDs. Theirfindings revealed that the MD group did not show higher rates of EDs, any steroid use, or steroid abuse/dependence than controls. It is possible that the SCID was less sensitive than other assessment tools in detecting the association between MD and ED. Along the same lines, Maida and Armstrong (2005) carried out a study with a sample of males who lift weights and manifest a broad range of attitudes about their bodies, from those falling within the mainstream to those whose worries may be classified as pathological. These authors did not find a relationship between MD symptomatology and the bulimia subscale from the Eating Disorders Inventory (EDI), but they found that MD was positively related to variables measuring symptoms of body dissatisfaction, obsessive– compulsive disorder, depression, and anxiety.
This variability in thefindings might be partly due to the different sampling and methodological characteristics of the studies (Nieuwoudt, Zhou, Coutts, & Booker, 2012). Across studies, differences exist in the definition of DM and the measurement tools used to assess MD and ED
symptomatology (Lavender, Brown, & Murray, 2017;
Lopez-Cuautle, Vazquez-Arevalo, & Mancilla-Diaz, 2016;Mitchell, Murray, Cobley, et al., 2017;Sandgreen &
Lavalle, 2018). Thus, to assess MD, studies have used different self-report questionnaires and interview schedules, such as the Muscle Dysmorphic Disorder Inventory (MDDI;
Hildebrandt, Langenbucher, & Schlundt, 2004), three dif- ferent versions of the Muscle Dysmorphia Inventory (MDI;
Lantz, Rhea, & Cornelius, 2002;Rhea, Lantz, & Cornelius, 2004; Short, 2005), the Muscle Appearance Satisfaction Scale (MASS;Mayville, Williamson, White, Netemeyer, &
Drab, 2002), the Muscle Dysmorphia Symptom Question- naire (MDSQ; Olivardia et al., 2000), Hale’s Scale (Hale, 2008), and the Muscle Dysmorphia Questionnaire (Cubberley, 2009). To assess ED symptomatology, studies have used the Eating Disorder Examination Questionnaire (EDE-Q; Fairburn & Beglin, 1994), the EDI (Garner, Olmstead, & Polivy, 1983), or the Eating Attitudes Test- 26 (EAT-26; Garner, Olmstead, Bohr, & Garfinkel, 1982).
The studies also differ in the sampling procedure (e.g., convenience sample vs. probabilistic sample), the target population investigated [e.g., non-clinical samples:
university students, athletes, and bodybuilders; clinical samples: MD-diagnosed participants, AN-diagnosed participants, and people who use anabolic androgenic ste- roid (AAS)], the gender of the participants (e.g., only males, only females, or mixed samples), the geographical location (USA, Australia, Mexico, Italy, Spain, etc.), and the ethnic- ity of the participants (Sandgren & Lavalle, 2018;Suffolk, Dovey, Goodwin, & Meyer, 2013).
To the best of our knowledge, no one has yet systemati- cally studied the association between MD and ED symptom- atology using a meta-analysis. A prior meta-analysis synthesized the evidence about the relationship between the drive for muscularity (DFM) and ED symptomatology, obtaining an average correlation of r+=.27 and indicating that higher levels of DFM were associated with higher levels of ED psychopathology (Tod & Edwards, 2015b). Based on Cohen (1988), correlation coefficients of about .1, .3, and .5 can be interpreted as reflecting small, moderate, and large associations, respectively. Therefore, Todd and Edwards’s (2015b) findings showed a small to moderate association between DFM and ED symptomatology. Nevertheless, DFM and MD are different but related constructs. The former describes individual motivation to become more muscular, whereas the latter is a psychological disorder that represents the pathological pursuit of muscularity and leanness (Cafri et al., 2005). Hence, the desire to increase muscularity (i.e., DFM) does not imply distress (i.e., MD; Kimmel &
Mahalik, 2004; Morrison, Morrison, & McCann, 2006).
Therefore, people can present a high DFM without necessar- ily being distressed by perceived inadequacy or developing MD. Thus, the research has shown that individuals with MD are different from normal weightlifters in their symptom pathology and psychiatric comorbidity (Cafri et al., 2008;
Olivardia et al., 2000). Recent evidence suggests that the former has a greater presence of eating disordered attitudes and beliefs than the latter (Mitchell, Murray, Hoon, et al., 2017;Murray, Nagata, et al., 2017). In addition, research also suggests that these constructs may have different neuropsy- chological correlates (Griffiths, Murray, & Touyz, 2013).
Therefore, we primarily aimed to conduct a systematic review and meta-analysis to synthesize the scientific evidence about the relationships between MD and ED symptomatology, given the inconsistencies in the results from empirical studies that have previously investigated this association. A second aim was to identify the study char- acteristics that might moderate the heterogeneous results that emerged, such as the geographic location, type of sample, measurement instruments for MD and ED, age, gender, and ethnicity, among others.
METHODS
We conducted a systematic review and meta-analysis on the relationship between MD and ED symptomatology follow- ing the Preferred Reporting Items for Systematic Reviews and Meta-Analyses (PRISMA) guidelines (Moher, Liberati, Tetzlaff, Altman, & The PRISMA Group, 2009). Because PRISMA guidelines were developed to be applied to meta- analyses studying intervention efficacy, some of their items were not applicable to our meta-analysis. Consequently, we also adhered to the guidelines recently proposed by the American Psychological Association Publications and Communications Board Task Force (Appelbaum et al., 2018, Table 9, p. 2123).
Study selection criteria
The studies had to meet the following inclusion criteria:
(a) the study had to be published in a peer-reviewed journal, (b) it had to be an original and quantitative investigation, (c) it had to assess MD using measurement instruments that specifically evaluated the symptoms and diagnostic criteria of MD (e.g., MASS, MDDI, MDI, etc.), (d) it had to assess ED using measurement instruments that specifically evalu- ated the symptoms and/or diagnostic criteria of ED (e.g., EAT, EDI, and EDE), and (e) it had to empirically examine the relationship between MD and ED symptoms.
We established no date, language, or participant’s age limits.
We excluded qualitative studies, literature reviews, system- atic reviews, meta-analyses, commentaries, editorials, and studies that did not assess MD and its relationship with ED symptomatology.
Search strategy
The researchers carried out electronic searches in June 2018 in the Medline (via PubMed), PsycInfo, Science Direct, and Web of Science databases, using the following terms in ALL FIELDS: muscle dysmorph*, MDI, reverse anorexia, bigorexia, vigorexia, and Adonis complex. Furthermore, we conducted manual searches of lists of references from the retrieved studies to identify additional studies that met the selection criteria. This search yielded two additional eligible studies. In addition, the researchers screened lists of references from previous reviews and meta-analyses (e.g., Dos Santos, Tirico, Stefano, Touyz, & Claudino, 2015;Mitchell, Murray, Cobley, et al., 2017;Sandegren &
Lavalle, 2018;Suffolk et al., 2013;Tod & Edwards, 2015b) tofind studies that met the inclusion criteria for the present
meta-analysis. Finally, in order to locate unpublished papers, the researchers sent e-mails to 12 of the most prolific authors in thefield. Of the six responses we received, none led to the discovery of an unpublished study.
Two researchers carried out the eligibility process for this meta-analysis independently, resolving disagreements be- tween raters by consensus. Figure1presents aflowchart of the study screening and selection process.
Coding of the studies
The researchers produced a protocol for extracting the characteristics of the studies and applied it to each study.
The following characteristics were coded: year of the study, geographical location, sampling method, type of sample (e.g., clinical, community, gymnasiums, university, and AAS users), sample size, gender, mean age, sexual orienta- tion, ethnicity, education level, tools used for assessing MD and ED, and statistics reported to calculate the effect sizes.
In addition, the researchers assessed the methodological quality of the studies by applying an ad hoc 10-item checklist, given that in the literature there is no clear methodological checklist to use in studies with a cross- sectional design where the purpose is to analyze the relation- ships between two variables, as in this study. Most quality checklists are designed for randomized trials and other types of research, particularly evaluations of interventions (e.g., Cochrane checklist). Therefore, their criteria focus on interventions and follow-up assessments. Other checklists are focused on cohort studies (e.g., Quality Assessment Tool for Observational Cohort and Cross-Sectional Studies from National Institutes of Health); however, most of their items are also related to interventions and follow-up assessments.
Therefore, we developed our own criteria to assess the methodological quality of primary studies.
Appendix A shows each of the 10 items on the quality checklist. Each item scored 1 when the study met the criteria and 0 otherwise. We calculated a total quality score (TQS) for each study by adding up all the corresponding quality item scores (range: 0–10), with a higher score indicating higher overall quality.
The researchers carried out the coding process in a standardized and systematic manner and two reviewers independently extracted the data. Interrater reliability was satisfactory, with a mean intraclass correlation of .98 (SD=0.036), ranging from 0.90 to 1 for continuous variables, and with a mean κ coefficient of 0.92 (SD= 0.078), ranging from 0.81 to 1 for qualitative variables.
Inconsistencies between coders were resolved by consensus.
Computing effect sizes
The effect size index was a correlation coefficient (e.g., the Pearson’s correlation coefficient, its Fisher’s Z transforma- tion, the ϕ coefficient, the point-biserial correlation coefficient) calculated between an MD scale and an ED scale (Borenstein, Hedges, Higgins, & Rothstein, 2009). For each study, the researchers translated the Pearson’s correlations to Fisher’s Z in order to normalize their distributions and stabilize their variances. Then, the researchers back-translated the Fisher’sZvalues for the individual effect sizes, as well as
those for the mean effect sizes and their confidence limits, into the Pearson’s correlation metric in order to make their interpretation easier (Borenstein et al., 2009).
In studies that reported several correlations for the MD–ED relationship, because researchers used multiple measures of MD and/or ED, we calculated their average to avoid statistical dependence.
In studies that did not directly report correlation coefficients, we applied appropriate translations between effect sizes. Thus, several studied reported odds ratios (ORs;
Bo et al., 2014; Cafri et al., 2008; Olivardia et al., 2000;
Pope et al., 2005), and we applied a formula to transform them into correlation coefficients. For each study, the ORs were translated into d, with d=Log1.65eðORÞ, Loge being the natural logarithm. Then, theds were translated intor,with r= ffiffiffiffiffiffiffiffid
d2þa
p , whereawas estimated witha=ðnn1þ1·nn22Þ2, andn1, n2 were the sample sizes in the two conditions (Sánchez-Meca, Marín-Martínez, & Chac ´on-Moscoso, 2003).
Statistical analyses
The researchers carried out a meta-analysis to assess the relationship between MD and ED symptomatology. In order to accommodate the variability shown by the effect sizes, we assumed a random-effects model (Borenstein et al., 2009;
Sánchez-Meca & Marín-Martínez, 2008). We calculated a pooled correlation coefficient and its corresponding 95%
confidence interval (CI). In addition, we assessed the statis- tical significance of the pooled correlation using theZtest.
The researchers constructed a forest plot to represent the individual and pooled effect size estimates, with their 95%
CIs, and to allow visual inspection of effect size heteroge- neity. We calculated both Cochran’s Q statistic and the I2 index to assess the consistency of the effect sizes (Borenstein et al., 2009; Huedo-Medina, Sánchez-Meca, Marín-Martínez, & Botella, 2006). A Q statistic with p<.05 was indicative of heterogeneity among the effect sizes. We estimated the degree of this heterogeneity using theI2index.I2values of around 25%, 50%, and 75% denoted low, moderate, and large heterogeneity, respectively.
To examine the influence of moderator variables on effect size variability, the researchers calculated analyses of variance (ANOVAs) and meta-regressions for categorical and continuous variables, respectively, by assuming a mixed-effects model (Borenstein et al., 2009;L ´opez-L ´opez, Marín-Martínez, Sánchez-Meca, van den Noortgate, &
Viechtbauer, 2014). We assessed the statistical significance of qualitative and continuous moderators with theQB and QR statistics, respectively. In addition, we calculated an estimate of the proportion of variance accounted for by the moderator variable following Raudenbush’s (2009) proposal (L´opez-L ´opez et al., 2014). We assessed the model Figure 1.Flowchart of the study selection process in the systematic review and meta-analysis of MD and ED symptomatology
misspecification with the QWandQEstatistics for qualita- tive and continuous moderators, respectively.
Finally, to assess publication bias, the researchers used both a funnel plot with Duval and Tweedie’s trim-and-fill method for imputing missing data and the Egger’s test (Duval & Tweedie, 2000;Sterne & Egger, 2005). A funnel plot with Duval and Tweedie’s trim-and-fill method uses available data to impute missing (unreported) studies and recalculates the overall effect that would be observed with their inclusion (Duval & Tweedie, 2000). The Egger’s test is an unweighted simple regression, which takes the precision of each study as the independent variable (precision being defined as the inverse of the standard error of each effect size) and the effect size divided by its standard error as the dependent variable. A non-statistically significant result of the t-test for the hypothesis of an intercept equal to zero means that publication bias can be eliminated as a threat to the validity of the pooled effect (Sterne & Egger, 2005).
The researchers interpreted all statistical tests assuming a significance level of 5% (p<.05). The statistical analyses were performed with the Comprehensive Meta-analysis software program, version 3.0 (Biostat, Englewood, NJ, USA;Borenstein, Hedges, Higgins, & Rothstein, 2014).
RESULTS
Study selection
The search strategy produced a total of 3,575 manuscripts.
After scanning the titles and abstracts of the 3,575 identified manuscripts, the researchers preselected 544 relevant stud- ies based on the inclusion and exclusion criteria. Then, eliminating duplicates (n=405) left a total of 139 studies to review. After a review of the full text of the remaining articles, 39 fulfilled the selection criteria. Nevertheless, nine articles did not report a correlation between MD and ED or statistical data to calculate it. In these cases, the researchers sent e-mails to the authors of the studies to obtain these data, but none of them replied to our request. Therefore, we excluded these studies from the meta-analysis (Babusa
&Túry, 2012; Babusa, Urban, Czeglédi, & Túry, 2012;
Guidi, Clementi, & Grandi, 2013; Hale et al., 2013;
Hildebrandt, Langenbucher, Karmin, Loeg, & Hollander, 2011;Hildebrandt et al., 2006;Hildebrandt, Walker, Alfano, Delinsky, & Bannon, 2010;Kanayama, Barry, Hudson, &
Pope, 2006; Magallares, 2016). Thus, the meta-analysis included 30 published articles; all of these studies were published in a peer-reviewed journal between 2000 (Olivardia et al., 2000) and 2018 (Klimek, Murray, Brown, Gonzales, & Blashill, 2018). Three of the 30 articles provided data on four, two, and three independent samples, respectively (Giardino & Procidano, 2012; Lamanna, Grieve, Derryberry, Hakman, & McClure, 2010; Segura García et al., 2010). Thus, the data set for our meta-analysis was composed of a total of 36 independent samples.
Study characteristics
Appendix Bpresents descriptive characteristics of the arti- cles included (n=39) in the systematic review, yielding a
total of 45 studies or independent samples. Overall, the majority of the studies used a convenience sample (e.g., gymnasiums, vitamin stores, bodybuilding discussion forums, Facebook, and university) and a cross-sectional design. Only one study used a probabilistic sample (Castro-Lopez, Cach ´on-Zagalaz, Molero, & Zagalaz- Sánchez, 2013). A large number of studies were conducted in the USA (n=23), with 14 carried out in Europe, 4 in Australia, and 2 in Mexico; one was conducted in China, and a multinational was study carried out in the UK, the USA, Australia, and Singapore.
The 45 independent samples included 8,516 participants (mean=189, range=11, and 648 participants). The weight- ed mean age of all participants was 25.89 years. Of the 45 independent samples, 31 were composed exclusively of men and 7 of women, whereas both males and females participated in the remaining 7 samples. Overall, the major- ity of the participants was Caucasian, with the presence of varying percentages of other racial and ethnic groups.
Finally, the majority of the participants had received at least some college education.
The studies used a variety of instruments to measure MD and ED. The tools most commonly used to assess MD were the MDDI (Hildebrandt et al., 2004;n=16), the MDI (Rhea et al., 2004; n=7), and the MASS (Mayville et al., 2002;
n=11). The assessment instruments most frequently used in the ED studies were the EAT-26 (Garner et al., 1982;n=15), the EDI (Garner et al., 1983; n=12), and the EDE-Q (Fairburn & Beglin, 1994;n=10).
Assessment of methodological quality
Appendix C presents the results obtained from the assess- ment of the methodological quality of the studies. Specifi- cally, the appendix shows the scores of individual studies on each quality item. The researchers also obtained a TQS by adding up the 1s and 0s for the checklist items (range = 0–10). On average, the studies had a methodological quality of 5.28 (SD=1.22), with a range of 3–7 points.
Most of the studies met the following criteria: (a) they used participant’s samples that allowed an appropriate representation of a clinical or at-risk MD or ED population (n=31); (b) they employed measurement instruments with good psychometric properties (validity and reliability) to assess MD in the study sample (n=30); (c) they employed measurement instruments with good psychometric proper- ties (validity and reliability) to assess ED in the study sample (n=28); (d) they did not dichotomize the assess- ment of MD and ED (n=39); (e) they reported on results related to all the MD and ED instruments described in
“Methods” section (n=44); (f) they applied appropriate statistical tests (non-parametric vs. parametric methods) to assess the relationships between MD and ED (n=24); and (g) they had no private financial support (n=39). Never- theless, most of the studies did not provide data on power analysis or report CIs around the effect sizes measured.
Finally, the following criteria were least likely to be met by the studies: (a) use of representative sampling procedures (n=1) and (b) a priori determination of the sample size to identify an effect (n=2). In addition, none of the studies specified whether there were dropouts or if these dropouts
had similar sociodemographic characteristics to those of the final sample.
Synthesis of results
This meta-analysis estimated the relationship between MD and ED symptomatology. Figure2presents a forest plot of the MD–ED associations found in each individual study and their 95% CIs, as well as the mean correlation coefficient resulting from pooling all the studies and its corresponding 95% CI.
As Figure 2 shows, the pooled effect size for the relationship between MD and ED was r+=.356 (95%
CI=0.298, 0.411, κ=36). In addition, the analysis found considerable heterogeneity among individual effect sizes, [Q(35)=200.925,p<.0001,I2=82.7%].
Analysis of publication bias
Because all the studies included were published papers, we carried out analyses to determine whether publication bias might be a threat to the validity of the results of the meta-analysis. The Duval and Tweedie (2000) trim-and-fill method did not impute any effect size (seeAppendix D). In addition, the Egger’s test applied to the intercept of a simple regression model of the effect sizes did not reach statistical significance [intercept=1.09, t(34)=1.176, p=.248].
Therefore, we can reasonably rule out publication bias as a serious threat to our meta-analytic findings.
Moderator analyses of the relationships between MD and ED symptomatology
The effect sizes showed a large amount of heterogeneity (I2=82.7%). Consequently, the researchers conducted sta- tistical analyses to identify the study characteristics that might explain this heterogeneity. Specifically, we used weighted ANOVAs and simple meta-regressions for cate- gorical and continuous moderator variables, respectively, taking the correlation coefficients between MD and ED symptomatology as the dependent variable.
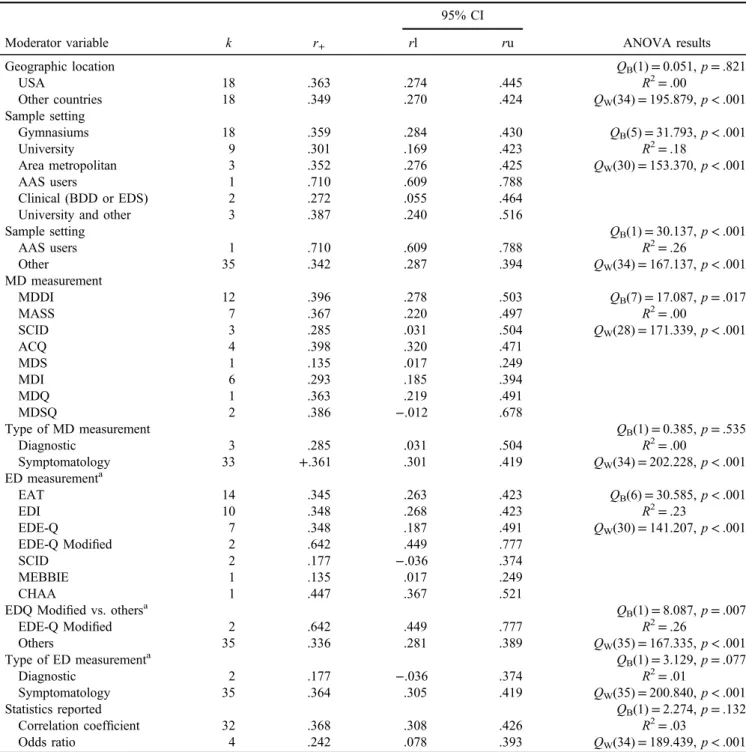
Table1presents the results of the ANOVAs conducted on the categorical variables, such as country of the study, type of sample, MD and ED measurement instrument, and type of statistics reported. Three moderator variables showed a statistically significant association with effect sizes: (a) the type of sample used in the study, (b) the measurement instrument used to assess MD, and (c) the measurement instrument used to assess ED. The type of sample used in the study, classified as people who reported current AAS use versus other samples, accounted for 26% of the variance (p<.001). Specifically, a study found stronger MD–ED associations when it was conducted among people who used AAS (r+=.710), compared to other samples (r+=.342). In addition, the tools used to assess ED explained 26% of the variance (p<.001), with stronger MD–ED associations found when the EDE-Q Modified was the instrument used to assess ED (r+=.642), in comparison with other instruments (r+=.336). Finally, studies that used
Study name Statistics for each study Correlation and 95% CI
Lower Upper
Correlation limit limit Z-Value p-Value
Baile et al. (2011) .447 0.367 0.521 9.798 .000
Bo et al. (2014) .170 0.078 0.259 3.589 .000
Brown et al. (2017) .461 0.284 0.608 4.730 .000
Cafri et al. (2008) .059 -0.220 0.329 0.409 .682
Castro-Lopez et al. (2013) .280 0.127 0.420 3.535 .000
De Santis et al. (2012) .402 0.223 0.555 4.196 .000
Dryer et al. (2016) .363 0.219 0.491 4.735 .000
Giardiono & Procidano (2012) Sample1 .510 0.213 0.721 3.183 .001 Giardiono & Procidano (2012) Sample2 .420 -0.240 0.815 1.266 .205 Giardiono & Procidano (2012) Sample3 .500 0.235 0.696 3.474 .001 Giardiono & Procidano (2012) Sample4 .580 0.231 0.797 3.036 .002
Goodale et al. (2001) .546 0.465 0.618 10.960 .000
Hildebrandt et al. (2012) .180 0.043 0.311 2.561 .010
Hildebrandt et al. (2004) .496 0.393 0.586 8.321 .000
Hughes et al. (2016) .329 0.221 0.429 5.728 .000
Jin et al. (2015) .156 0.076 0.234 3.817 .000
Klimek et al. (2018) .570 0.462 0.661 8.615 .000
Lamanna et al. (2010) Sample1 .227 0.024 0.412 2.192 .028
Lamanna et al. (2010) Sample2 .467 0.303 0.604 5.138 .000
Latorre-Román et al. (2015) .422 0.245 0.572 4.410 .000
Lopez et al. (2015) .155 -0.025 0.325 1.690 .091
Maida & Amstrong (2005) .183 -0.008 0.361 1.878 .060
McFarland & Kaminski (2009) .135 0.017 0.249 2.244 .025
Mitchell et al. (2017) .310 0.061 0.523 2.420 .016
Murray et al. (2016) .710 0.609 0.788 9.678 .000
Murray et al. (2012) .539 0.330 0.697 4.551 .000
Nieuwoudt et al. (2015) .411 0.345 0.473 11.094 .000
Olivardia et al. (2000) .490 0.256 0.670 3.828 .000
Pope et al. (2005) .272 0.026 0.487 2.161 .031
Rhea et al. (2004) .460 0.324 0.577 6.050 .000
Santarnecchi & Dèttore (2012) .330 0.193 0.454 4.561 .000 Segura-García et al. (2010). Sample 1 .183 -0.030 0.380 1.686 .092 Segura-García et al. (2010). Sample 2 .251 -0.036 0.500 1.721 .085 Segura-García et al. (2010). Sample 3 .271 -0.195 0.637 1.146 .252
Sladek et al. (2014) .221 0.042 0.386 2.410 .016
Walker et al. (2009) .167 0.085 0.247 3.943 .000
.356 0.298 0.411 11.259 .000
-1.00 -0.50 0.00 0.50 1.00
Negative r Positive r
Figure 2.Forest plot of the association between MD and ED symptomatology
quantitative measurement instruments to assess ED symp- tomatology, such as EDE-Q or EAT, that had a larger mean effect size (r+=.364) than the studies that used other instruments (r+=.177), although this difference was only marginally statistically significant (p=.077,R2=.01).
Table2presents the simple meta-regressions conducted on continuous variables, such as mean age, gender
(% male), and ethnicity (% Caucasian) of the sample, as well as the methodological TQS. The only moderator vari- able that exhibited a statistically significant association with effect sizes was the methodological TQS for the individual studies, accounting for 25% of the variance (p<.05).
In addition, in order to identify the individual items on the quality checklist that were statistically associated with Table 1.Results of the weighted ANOVAs for the influence of categorical variables on the effect sizes
Moderator variable k r+
95% CI
ANOVA results
rl ru
Geographic location QB(1)=0.051,p=.821
USA 18 .363 .274 .445 R2=.00
Other countries 18 .349 .270 .424 QW(34)=195.879,p<.001
Sample setting
Gymnasiums 18 .359 .284 .430 QB(5)=31.793,p<.001
University 9 .301 .169 .423 R2=.18
Area metropolitan 3 .352 .276 .425 QW(30)=153.370,p<.001
AAS users 1 .710 .609 .788
Clinical (BDD or EDS) 2 .272 .055 .464
University and other 3 .387 .240 .516
Sample setting QB(1)=30.137,p<.001
AAS users 1 .710 .609 .788 R2=.26
Other 35 .342 .287 .394 QW(34)=167.137,p<.001
MD measurement
MDDI 12 .396 .278 .503 QB(7)=17.087,p=.017
MASS 7 .367 .220 .497 R2=.00
SCID 3 .285 .031 .504 QW(28)=171.339,p<.001
ACQ 4 .398 .320 .471
MDS 1 .135 .017 .249
MDI 6 .293 .185 .394
MDQ 1 .363 .219 .491
MDSQ 2 .386 −.012 .678
Type of MD measurement QB(1)=0.385,p=.535
Diagnostic 3 .285 .031 .504 R2=.00
Symptomatology 33 +.361 .301 .419 QW(34)=202.228,p<.001
ED measurementa
EAT 14 .345 .263 .423 QB(6)=30.585,p<.001
EDI 10 .348 .268 .423 R2=.23
EDE-Q 7 .348 .187 .491 QW(30)=141.207,p<.001
EDE-Q Modified 2 .642 .449 .777
SCID 2 .177 −.036 .374
MEBBIE 1 .135 .017 .249
CHAA 1 .447 .367 .521
EDQ Modified vs. othersa QB(1)=8.087,p=.007
EDE-Q Modified 2 .642 .449 .777 R2=.26
Others 35 .336 .281 .389 QW(35)=167.335,p<.001
Type of ED measurementa QB(1)=3.129,p=.077
Diagnostic 2 .177 −.036 .374 R2=.01
Symptomatology 35 .364 .305 .419 QW(35)=200.840,p<.001
Statistics reported QB(1)=2.274,p=.132
Correlation coefficient 32 .368 .308 .426 R2=.03
Odds ratio 4 .242 .078 .393 QW(34)=189.439,p<.001
Note. k: number of studies.r+: mean effect size.rl andru: 95% lower and upper confidence limits aroundr+;QB: between-categoriesQ statistic;QW: within-categoriesQstatistic;R2: proportion of variance accounted for by the moderator variable; ED: eating disorder; EDE-Q:
Eating Disorder Examination Questionnaire; MEBBIE: Male Eating Behavior and Body Image Evaluation; CHAA: Cuestionario de Hábitos de Alimentaci´on Alterados; SCID: structured clinical Interview for DSM-IV; MDDI: Muscle Dysmorphic Disorder Inventory; MASS:
Muscle Appearance Satisfaction Scale; MDI: Muscle Dysmorphia Inventory; AAS: anabolic androgenic steroid; ACQ: Adonis Complex Questionnaire; MDSQ: Muscle Dysmorphia Symptom Questionnaire; MDQ: Muscle Dysmorphia Questionnaire; CI: confidence interval;
ANOVA: analysis of variance; BDD: body dysmorphic disorder.
aHughes et al.’s (2016) study used two tools for assessing EDs (EAT-26 and EDEQ).
the effect sizes, we applied ANOVAs for each individual item (see Table3). As Table3shows, items 4, 5, and 6 were statistically associated with the effect sizes. Thus, studies that reported any estimate of the reliability/validity of the MD measurement instrument (item 4) or any estimate of the reliability/validity of the ED measurement used in the study sample (item 5) showed a mean effect size (r+=.403 and r+=.416, respectively) larger than those that did not (r+=.255 and r+=.196, respectively), accounting for a large proportion of variance (R2=.13 and R2=.31, respectively). In addition, studies that did not dichotomize MD and/or ED variables showed a mean effect size (r+=.376) larger than those that did so (r+=.219), accounting for a moderate proportion of variance (R2=.06).
DISCUSSION
This is the first meta-analytic study on the relationship between MD and ED symptomatology. Our results showed that there is a positive and statistically significant relation- ship between MD and ED symptomatology, indicating that higher levels of MD were associated with higher levels of ED symptomatology. Following Cohen’s (1988) criteria, a correlation coefficient of r+=.356 can be interpreted as reflecting a relationship of moderate magnitude. Ourfind- ings are consistent with the findings from Tod and Edwards’s (2015b) review, which found an association between DFM and ED symptomatology. However, the strength of the correlation was greater between MD and Table 2. Results of the simple weighted meta-regressions of continuous moderators on the effect sizes
Moderator variable k bj QR QE R2
Mean age (years) 36 0.0015 0.05 196.51** .0
Gender (% males) 36 0.0000 0.45 199.26** .0
Ethnicity (% Caucasian) 19 −0.0003 0.03 101.58** .0
Methodology quality checklist (0–10) 36 0.0776 10.03* 176.31** .25
Note. k: number of studies;bj: unstandardized regression coefficient;QR:Qstatistic for testing the statistical significance of the moderator variable;QE:Qstatistic for testing the model misspecification;R2: proportion of variance accounted for by the moderator variable.
*p<.05. **p<.001.
Table 3.Results of the weighted ANOVAs for the influence of methodological quality items on the effect sizes
Quality item k r+
95% CI
ANOVA results
rl ru
1. Probabilistic sampling QB(1)=0.988,p=.320
Yes 1 .280 .127 .420 R2=.00
No 35 .359 .299 .415 QW(34)=202.124,p<.001
2. Adequate target population QB(1)=1.118,p=.290
Yes 24 .380 .310 .446 R2=.01
No 12 .316 .215 .411 QW(34)=191.814,p<.001
4. Reliability/validity MD measurement tool QB(1)=6.928,p=.008
Yes 24 .403 .331 .470 R2=.13
No 12 .255 .167 .339 QW(34)=192.883,p<.001
5. Reliability/validity ED measurement tool QB(1)=26.172,p<.001
Yes 24 .416 .349 .479 R2=.31
No 12 .196 .147 .244 QW(34)=159.323,p<.001
6. Absence of dichotomous DM and ED QB(1)=6.412,p=.011
Yes 30 .376 .314 .434 R2=.06
No 6 .219 .109 .324 QW(34)=186.515,p<.001
8. Statistical test appropriate QB(1)=0.058,p=.810
Yes 21 .360 .280 .435 R2=.00
No 15 .346 .265 .423 QW(34)=202.325,p<.001
9. Privatefinancial support QB(1)=0.138,p=.711
Yes 4 .373 .288 .452 R2=.00
No 32 .354 .290 .414 QW(34)=201.692,p<.001
10. Statistical power QB(1)=0.426,p=.514
Yes 2 .251 −.101 .548 R2=.00
No 34 .361 .302 .418 QW(34)=202.397,p<.001
Note.Results for item 3 (dropouts were similar in socio-demographic characteristics to those of thefinal sample) and item 7 (absence of reporting bias) were not analyzed because all studies scored 0 and 1, respectively.k: number of studies;r+: mean effect size;rl andru: 95%
lower and upper confidence limits aroundr+;QB: between-categoriesQstatistic;QW: within-categoriesQstatistic;R2: proportion of variance accounted for by the moderator variable; ANOVA: analysis of variance; ED: eating disorder; MD: muscle dysmorphia.
ED symptomatology (r=.36) than between DFM and ED (r=.27). These findings suggest that both MD and DFM share an association with EDs. People with DFM and MD want to gain lean muscle mass, which is achieved not only through physical training but also by maintaining a diet high in lean protein and using food supplements. Therefore, dietary practices are an important factor in both DFM and MD. Furthermore, research suggests that the behavior and diet subscales of the DFM predict MD characteristics (Robert et al., 2009), which might explain that both MD and DFM share an association with EDs. In other research, DFM has been identified as a precursor to the development of MD (Olivardia et al., 2000). Therefore, those who scored high on a measure of MD displayed a higher degree of DFM. From this point of view, MD might be considered an extreme variant of DFM.
We ruled out publication bias as a threat to our meta- analytic results, but we found great variability among the individual effect sizes. In order to identify the study features that could explain at least part of the effect size variability, we carried out ANOVAs and meta-regressions. Several study characteristics were statistically related to effect size, such as the type of sample, the methodological quality, and the MD and ED measurement instruments used. First, our findings showed stronger associations between MD and ED symptomatology in males reporting current AAS use than in other people (undergraduates, athletes, etc.). However, this result must be interpreted very cautiously because AAS samples were represented in only one study. Therefore, it seems plausible that males who use AAS exhibit elevated levels of MD symptomatology. Indeed, some of the most common motivations for using AAS are to increase muscle mass and strength (Cohen, Collins, Darkes, & Gwartney, 2007), to improve physical appearance (Kimergård, 2015), and to decrease body dissatisfaction and MD symptoms (Grogan, Shepherd, Evans, Wright, & Hunter, 2006). In this way, research has identified MD symptoms as a predictor of the use of substances such as anabolic steroids, prohor- mones, and ephedrine (Cafri, van den Berg, & Thompson, 2006). Thus, people who use AAS might be at greater risk of developing MD and ED symptomatology. These findings suggest the need to implement health promotion and prevention programs to reduce AAS use.
Furthermore, our results showed that of all the ED measurement instruments, the EDE-Q Modified (Murray et al., 2012) was the most sensitive tool in identifying relationships with MD symptomatology. Some conceptual overlapping between the EDE-Q Modified and the measures of MD is likely. It is important to note that the EDE-Q Modified is a version of the EDE-Q with the gender-relevant items identified and reversed in polarity to enhance its sensitivity in indexing male concerns (Murray et al., 2012). For instance, the item on the EDE-Q “Have you had a definite fear that you might gain weight or become fat?”was reversed on the EDE-Q Modified to“Have you had a definite fear that you might lose weight or become less muscular?”Other examples of reversed items are“Have you been deliberately trying toincreasethe amount of food you eat to influence your shape or weight?”and“Has thinking about foodor its protein contentmade it more difficult to concentrate on things you are interested in; for example,
reading, watching TV, or following a conversation?”(mod- ifications italicized). Such overlaps might influence the strength of the relationships between MD and ED symp- tomatology. In addition, it is plausible that the strength of the association between MD and the EDE-Q Modified might be affected by the type of sample used to examine this relationship. In this regard, the only two studies that applied the EDE-Q Modified (Murray, Griffiths, Mond, Kean, &
Blashill, 2016;Murray et al., 2012) used samples of parti- cipants who were not from a community population. In one of them; the participants were AAS users (Murray et al., 2016), and in the other study, they were clinical participants (Murray et al., 2012). Therefore, clinicians should be aware of this fact and take it into account when identifying co- occurrence.
Moreover, our findings revealed that of all the ED assessment instruments, the SCID was the least sensitive in identifying relationships between MD and ED symptom- atology, which might explain why the study by Cafri et al.
(2008) did not reveal a relationship between MD and ED symptomatology. One possible explanation is that the SCID provides a more thorough and conservative assessment of an ED, having less overlap with MD than other ED measures.
This might suggest that MD is associated with certain ED symptoms but not strongly or consistently with a separate ED diagnosis.
Finally, our findings suggest that studies with higher methodological quality are more sensitive in identifying relationships between MD and ED symptomatology. In addition, we found stronger MD–ED associations in the studies that assessed the psychometric properties of the MD and ED instruments with the data found than in those that did not assess these properties. These results agree with psychometric theory, which proposes that using measure- ment instruments with good psychometric properties will provide greater sensitivity in revealing statistical associa- tions between variables than using non-reliable and/or non-valid instruments. Finally, we found lower MD–ED associations in the studies that dichotomized the MD and ED measures (i.e., reporting ORs instead of Pearson’s correlation coefficients). These results agree with statistical theory, which proposes that dichotomizing variables pro- duce a loss of sensitivity in detecting statistical associations among variables (Schmidt & Hunter, 2015). Therefore, one would expect higher correlations in studies with higher methodological quality that used quantitative measurement instruments for MD assessment, such as MASS and MDDI, and for ED assessment, such as EAT or EDE-Q.
Limitations
This meta-analysis has several limitations. Five studies could not be included in the final analysis because the statistical data reported did not allow us to calculate the effect sizes, and their authors did not reply to the request for data. Furthermore, most of the studies included were con- ducted in the USA, which might limit the generalization of the results. In addition, given the existence of great heterogeneity among the effect sizes, it is possible that other moderator variables not considered in our meta- analysis might be relevant in explaining this heterogeneity
(Menees, Grieve, Mienaltowski, & Pope, 2013). These moderators are likely to be psychosocial constructs such as socially prescribed perfectionism (Dryer, Farr, Hiramatsu, & Quinton, 2016) or masculinity-related constructs (Tod et al., 2016). Increased understanding and awareness of MD and ED symptomatology might contribute to identifying and referring people at risk, so that they can receive help from mental health services. Finally, it is important to remember that all the studies included in this meta-analysis were cross-sectional, which means we cannot draw causal inferences about the relationship between MD and ED symptomatology.
Recommendations for future research
Most research on MD–ED has used non-clinical samples, often university students, who, in general, have low psychopathology. Thus, future research should investigate the MD–ED association in clinical samples, that is, in people diagnosed with MD and/or ED. These studies might improve our knowledge to develop more optimal treatment approaches. On other hand, tofind out whether the EDE-Q Modified (Murray et al., 2012) is really the most sensitive tool for assessing the association between MD and ED symptomatology, additional studies are needed to analyze this relationship in community samples.
Moreover, given that most of the studies used cross- sectional designs, which do not allow us to draw causal inferences about the relationship between MD and ED symptomatology, future research should implement longitudinal studies. These studies might help to clarify the relationship between MD and ED symptomatology in chronological terms, for instance, whether ED precedes MD or vice versa, and they might clarify the stability of MD and/
or ED symptomatology.
Finally, given that most of the studies were conducted in the USA and with male participants, future research should study this topic in other social contexts and in the female population in order to investigate potential differences based on cultural factors and/or sex differences.
CONCLUSIONS
This is the first meta-analytic study on the relationship between MD and ED symptomatology, contributing to a more accurate view of this phenomenon, despite the limita- tions described above. Furthermore, ourfindings may have some implications for clinical practice. They suggest that the symptoms and behaviors characteristic of MD tend to co-occur with ED symptomatology in males and females.
Thus, when evaluating individuals presenting with MD, clinicians should investigate the possibility of the presence of ED, and vice versa, particularly in males. In this regard, a recent case study showed the transition from thinness- oriented to muscularity-oriented disordered eating during the course of treatment for AN (Murray, Griffiths, Mitchison, & Mond, 2017). As the authors of this study pointed out, the emergence of muscularity-oriented disordered eating during the treatment of AN might be misinterpreted as healthy, due to the move away from
dangerously low body weight, which is the objective of AN treatment.
People with MD symptomatology may also have ED symptomatology, which appears to be associated with greater psychopathology (Chandler, Grieve, Derryberry, &
Pegg, 2009; Ebbeck, Watkins, Concepcion, Cardinal, &
Hammermeister, 2009; Grieve & Shacklette, 2012; Pope et al., 2005). This situation, in addition to the serious limitations in social and work performance caused by MD and the associated unhealthy behaviors, makes it necessary to use strategies for identifying at-risk individuals and for prevention, such as inviting them to participate in psychotherapy. Because MD and ED symptomatology, and the co-occurrence of these symptoms, can occur more often among athletes, the development of such intervention strat- egies may be of special interest for mental health profes- sionals working in the sports area. We do not believe that participation in sports is inherently pathological, but it is likely that some individuals take up sports for reasons (which may be pathological) that correlate with MD and ED symptomatology or increase the risk of developing symptoms of these two disorders. A psychological assess- ment conducted by an experienced sports psychologist could identify the athletes in need of psychological treat- ment. Based on our data, we recommend that clinicians use the MDDI or MASS to assess MD and the EDE-Q Modified to assess ED when examining the co-occurrence of MD and ED symptomatology. These are the most sensitive measure- ment instruments in identifying relationships between MD and ED (considering the previous discussion about the EDEQ Modified).
Funding sources:This research is not funded by a specific project grant.
Authors’ contribution: CL and MAF conceived of the presented idea and developed the theory. LB-R and MR-A performed the computations and statistical analysis.
JS-M verified the analytical methods and supervised the findings of this work. All authors discussed the results and contributed to the final manuscript.
Conflict of interest:The authors declare no potential conflict of interest with regard to the research, authorship, and/or publication of this article.
REFERENCES
References marked with an asterisk indicate studies included in the meta-analysis.
American Psychiatric Association [APA]. (2013).Diagnostic and statistical manual of mental disorders (DSM-5). Washington, DC: American Psychiatric Association.
Appelbaum, M., Cooper, H., Kline, R. B., Mayo-Wilson, E., Nezu, A. M., & Rao, S. M. (2018). Journal article reporting standards for quantitative research in psychology: The APA Publications and Communications Board Task Force report. American Psychologist, 73(1), 3–25. doi:10.1037/amp0000191